Time to Surgery and Breast Cancer Survival in the United States
- PMID: 26659430
- PMCID: PMC4788555
- DOI: 10.1001/jamaoncol.2015.4508
Time to Surgery and Breast Cancer Survival in the United States
Erratum in
-
Error in Figure 2 Axis Labels.JAMA Oncol. 2016 Sep 1;2(9):1244. doi: 10.1001/jamaoncol.2016.2968. JAMA Oncol. 2016. PMID: 27467898 No abstract available.
Abstract
Importance: Time to surgery (TTS) is of concern to patients and clinicians, but controversy surrounds its effect on breast cancer survival. There remains little national data evaluating the association.
Objective: To investigate the relationship between the time from diagnosis to breast cancer surgery and survival, using separate analyses of 2 of the largest cancer databases in the United States.
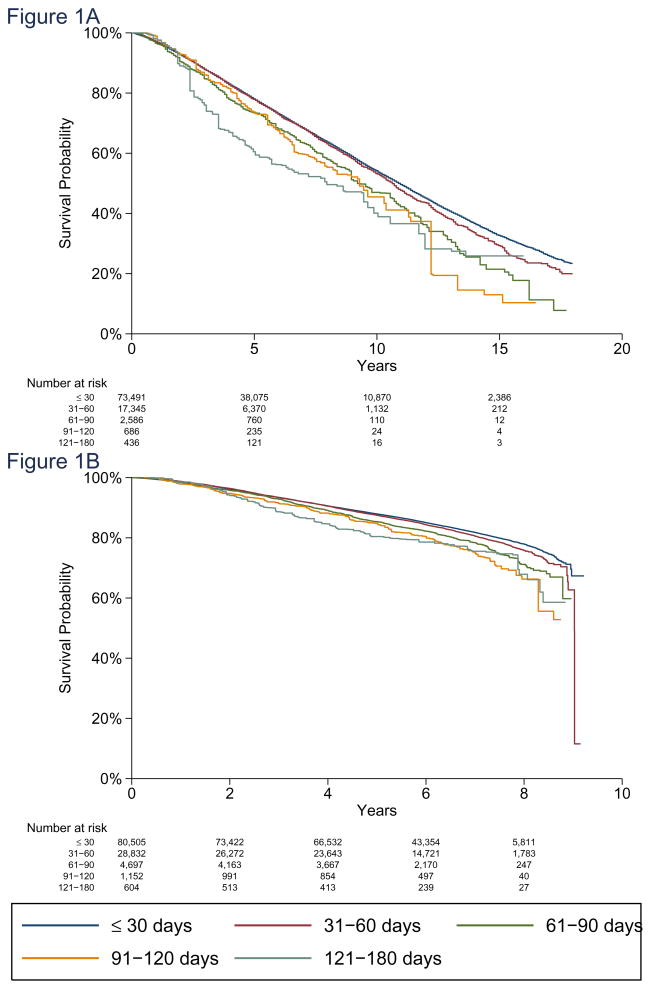
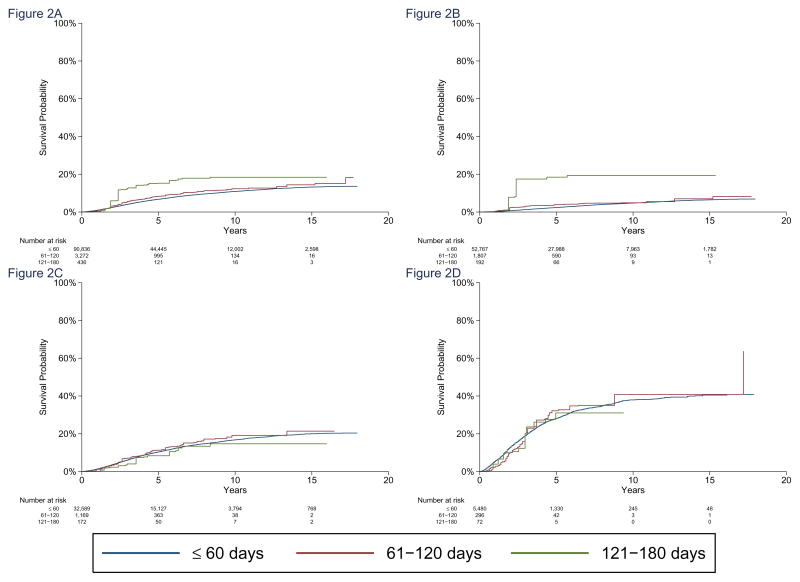
Design, setting, and participants: Two independent population-based studies were conducted of prospectively collected national data from the Surveillance, Epidemiology, and End Results (SEER)-Medicare-linked database and the National Cancer Database (NCDB). The SEER-Medicare cohort included Medicare patients older than 65 years, and the NCDB cohort included patients cared for at Commission on Cancer-accredited facilities throughout the United States. Each analysis assessed overall survival as a function of time between diagnosis and surgery by evaluating 5 intervals (≤30, 31-60, 61-90, 91-120, and 121-180 days) and disease-specific survival at 60-day intervals. All patients were diagnosed with noninflammatory, nonmetastatic, invasive breast cancer and underwent surgery as initial treatment.
Main outcomes and measures: Overall and disease-specific survival as a function of time between diagnosis and surgery, after adjusting for patient, demographic, and tumor-related factors.
Results: The SEER-Medicare cohort had 94 544 patients 66 years or older diagnosed between 1992 and 2009. With each interval of delay increase, overall survival was lower overall (hazard ratio [HR], 1.09; 95% CI, 1.06-1.13; P < .001), and in patients with stage I (HR, 1.13; 95% CI, 1.08-1.18; P < .001) and stage II disease (HR 1.06; 95% CI, 1.01-1.11; P = .01). Breast cancer-specific mortality increased with each 60-day interval (subdistribution hazard ratio [sHR], 1.26; 95% CI, 1.02-1.54; P = .03). The NCDB study evaluated 115 790 patients 18 years or older diagnosed between 2003 and 2005. The overall mortality HR was 1.10 (95% CI, 1.07-1.13; P < .001) for each increasing interval, significant in stages I (HR, 1.16; 95% CI, 1.12-1.21; P < .001) and II (HR, 1.09; 95% CI, 1.05-1.13; P < .001) only, after adjusting for demographic, tumor, and treatment factors.
Conclusions and relevance: Greater TTS is associated with lower overall and disease-specific survival, and a shortened delay is associated with benefits comparable to some standard therapies. Although time is required for preoperative evaluation and consideration of options such as reconstruction, efforts to reduce TTS should be pursued when possible to enhance survival.
Figures
Comment in
-
Timeliness in Breast Cancer Treatment-The Sooner, the Better.JAMA Oncol. 2016 Mar;2(3):302-4. doi: 10.1001/jamaoncol.2015.4506. JAMA Oncol. 2016. PMID: 26658500 No abstract available.
References
-
- McCahill LE, Privette A, James T, et al. Quality measures for breast cancer surgery: initial validation of feasibility and assessment of variation among surgeons. Arch Surg. 2009;144(5):455–462. discussion 462-453. - PubMed
-
- Kaufman CS, Shockney L, Rabinowitz B, et al. National Quality Measures for Breast Centers (NQMBC): a robust quality tool: breast center quality measures. Ann Surg Oncol. 2010;17(2):377–385. - PubMed
-
- Del Turco MR, Ponti A, Bick U, et al. Quality indicators in breast cancer care. Eur J Cancer. 2010;46(13):2344–2356. - PubMed
Publication types
MeSH terms
Grants and funding
LinkOut - more resources
Full Text Sources
Other Literature Sources
Medical