Review
. 2016 Apr;22(2):199-212.
doi: 10.1177/1073858415621035. Epub 2015 Dec 10.

Relearning to See in Cortical Blindness

Affiliations
Review

Relearning to See in Cortical Blindness

Michael D Melnick et al. Neuroscientist. 2016 Apr.

Erratum in

  • Corrigendum.
    [No authors listed] [No authors listed] Neuroscientist. 2016 Apr;22(2):213. doi: 10.1177/1073858415626325. Epub 2016 Jan 6. Neuroscientist. 2016. PMID: 26740082

Abstract

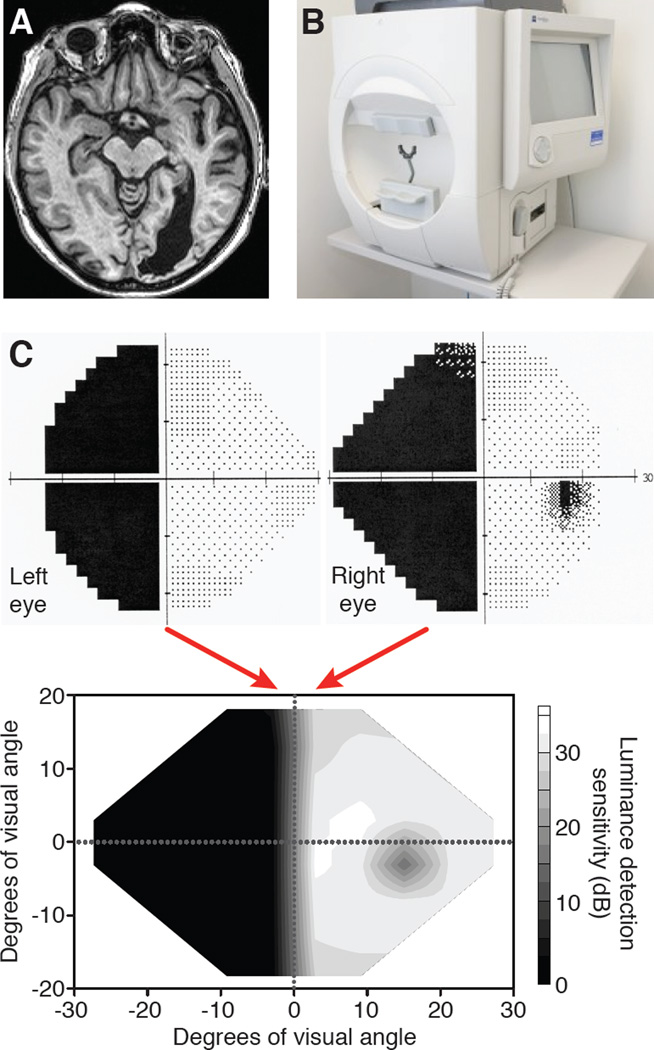
The incidence of cortically induced blindness is increasing as our population ages. The major cause of cortically induced blindness is stroke affecting the primary visual cortex. While the impact of this form of vision loss is devastating to quality of life, the development of principled, effective rehabilitation strategies for this condition lags far behind those used to treat motor stroke victims. Here we summarize recent developments in the still emerging field of visual restitution therapy, and compare the relative effectiveness of different approaches. We also draw insights into the properties of recovered vision, its limitations and likely neural substrates. We hope that these insights will guide future research and bring us closer to the goal of providing much-needed rehabilitation solutions for this patient population.

Keywords: V1; perceptual learning; stroke; vision loss; vision rehabilitation.


Figures

Figure 1
Figure 1. Assessing the impact of primary visual cortex damage in humans
A. Horizontal magnetic resonance image of the head of a patient >6 months after a stroke affecting the occipital cortex of the right hemisphere. The eyes are clearly visible at the top of the image. Note the markedly enlarged ventricle in the posterior half of the right hemisphere, a common consequence of degenerated cortical brain matter. B. Photograph of a Humphrey visual field perimeter machine showing the “bowl” in which small spots of light are presented in a regular array. The patient’s head is fitted into a chin-forehead rest frame at the entrance of the bowl and vision is corrected monocularly using trial lenses inserted into the black holder at the center of the bowl aperture. C. A portion of the 24-2 Humphrey visual field printout generated for each eye of the patient whose brain lesion is shown in A. This patient is considered to have a large, left, homonymous hemianopia. Note also the small blind spot, visible only in the right eye of this patient. The luminance detection sensitivity measured monocularly by Humphrey perimetry can then be combined to generate a singular, interpolated map of luminance detection sensitivity in Decibels (dB) across the central visual field (bottom plot).
Figure 2
Figure 2. Details of stimuli and tasks employed for visual retraining of CB subjects
Except for VRT (A), all stimuli are drawn to scale, with the scale bar shown in panel D. Panels C and D show the largest and smallest stimuli used in retraining by Raninen and Chokon and colleagues. Note that during training, only one stimulus was actually shown on each trial. Panel H illustrates three different tasks used by Chokron and colleagues (2008). Each of three tasks was used in separate sessions. Arrows and dashed circles in E and I illustrate dot motion directions and spatial extent of the stimuli. Neither was shown during the actual task. Where specific stimulus locations were indicated, their eccentricity is shown next to each stimulus schematic. Where stimulus locations were variable or not indicated, a descriptor of whether the stimuli were presented inside the blind field or near/along the blind field border is provided next to the appropriate stimulus schematic. OM = outcome measure, AFC = alternative forced choice.
Figure 3
Figure 3. Impact of visual discrimination training on Humphrey visual fields
Composite visual field maps were obtained from Humphrey perimetry as described in Figure 1 in a chronic CB patient trained using the methods of Das, Tadin and Huxlin (2014). The top graphs show composite visual fields obtained prior to, and then after left-right, global direction discrimination training at locations indicated by light grey circles (see Figure 2E). The bottom graph is a subtraction map between the two top visual field maps. Shades of red indicated regions that improved by >6 dB of sensitivity; shades of grey indicate areas that decreased in sensitivity. Note that the regions of improved sensitivity largely occur at sites of visual training, but there are regions of improvement at locations along the blind field border where training was not directly administered.

Similar articles

Cited by

References

    1. Azzopardi P, Cowey A. Motion discrimination in cortically blind patients. Brain. 2001;124:30–46. - PubMed
    1. Bach-Y-Rita P. Controlling variables eliminates hemianopia rehabilitation results. Behavioural and Brain Sciences. 1983;6:448.
    1. Barbur JL, Harlow AJ, Weiskrantz L. Spatial and temporal response properties of residual vision in a case of hemianopia. Philosophical Transactions of the Royal Society of London - Series B: Biological Sciences. 1994;343:157–166. - PubMed
    1. Barbur JL, Watson JDG, Frackowiak RSJ, Zeki S. Conscious visual perception without V1. Brain. 1993;116(Part 6):1293–1302. - PubMed
    1. Bergsma DP, Elshout JA, van der Wildt GJ, van den Berg AV. Transfer effects of training-induced visual field recovery in patients with chronic stroke. Topics in Stroke Rehabilitation. 2012;19(3):212–225. - PubMed

Publication types

MeSH terms