. 2016 Mar;76(4):349-58.
doi: 10.1002/pros.23126. Epub 2015 Dec 10.

Spectrum of mitochondrial genomic variation and associated clinical presentation of prostate cancer in South African men

Affiliations

Spectrum of mitochondrial genomic variation and associated clinical presentation of prostate cancer in South African men

John P McCrow et al. Prostate. 2016 Mar.

Abstract

Background: Prostate cancer incidence and mortality rates are significantly increased in African-American men, but limited studies have been performed within Sub-Saharan African populations. As mitochondria control energy metabolism and apoptosis we speculate that somatic mutations within mitochondrial genomes are candidate drivers of aggressive prostate carcinogenesis.

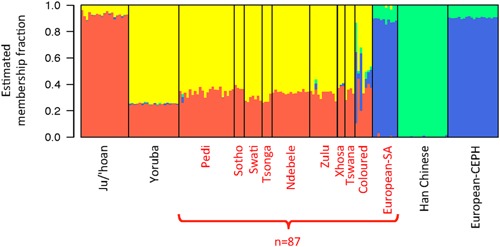
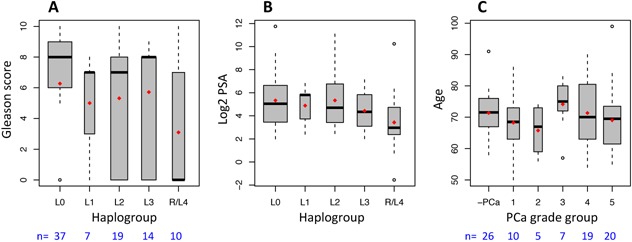
Methods: We used matched blood and prostate tissue samples from 87 South African men (77 with African ancestry) to perform deep sequencing of complete mitochondrial genomes. Clinical presentation was biased toward aggressive disease (Gleason score >7, 64%), and compared with men without prostate cancer either with or without benign prostatic hyperplasia.

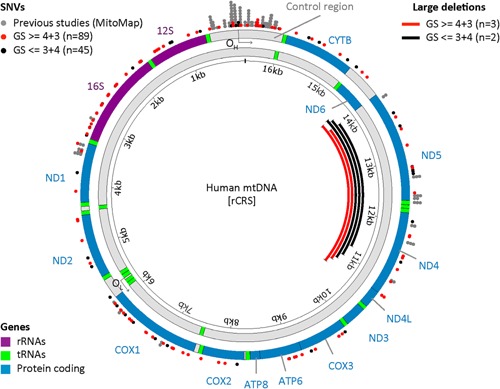
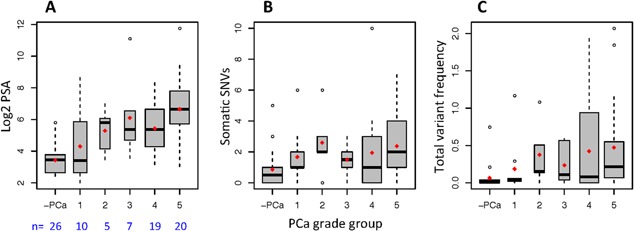
Results: We identified 144 somatic mtDNA single nucleotide variants (SNVs), of which 80 were observed in 39 men presenting with aggressive disease. Both the number and frequency of somatic mtDNA SNVs were associated with higher pathological stage.

Conclusions: Besides doubling the total number of somatic PCa-associated mitochondrial genome mutations identified to date, we associate mutational load with aggressive prostate cancer status in men of African ancestry.

Keywords: African ancestry; mitochondria; outcomes; prostate cancer; variation.


Figures

Figure 1
Figure 1
Cluster ancestral fractions for PCa participants in this study (red label) and reference populations (black label) for comparison. Ancestral fractions estimated by STRUCTURE with K = 4 clusters. The Orange cluster corresponds to African–Khoesan ancestry, Yellow to African–Bantu, Blue to European, and Green to Asian.
Figure 2
Figure 2
Correlations between (A) ancestral mtDNA‐haplogroups and clinical presentation by Gleason score, (B) haplogroups and serum PSA levels, and (C) PCa grade group categories of risk associated with age at presentation, including no PCa (‐PCa). The earliest lineage (L0) presented with significantly (P < 0.05) higher PCa risk than later diverging lineages. There was no significant association between age and PCa grade group. Red dots on box‐plots indicate mean values.
Figure 3
Figure 3
Distribution of somatic SNVs in aggressive PCa patients (red, this study GS > = 4 + 3), and no‐PCa or indolent PCa (black, this study GS < = 3 + 4), overlaid with previously reported PCa associated SNVs from Mitomap (gray). Large deletions detected by targeted amplification are depicted as red (GS > = 4 + 3) and black (GS < = 3 + 4) lines. The human mitochondrial genome is depicted as the heavy strand (outer) and light strand (inner), with location of genes, and origins of replication for each strand. The control region and rRNA genes contain a significant enrichment of SNVs compared to other regions.
Figure 4
Figure 4
PCa grade groups, including no PCa (‐PCa), associated with (A) serum PSA levels, and mtDNA mutational load measured by (B) number of somatic SNVs, and (C) total variant frequency of somatic SNVs in South African men of African ancestry. Red dots on box‐plots indicate mean values.
Figure 5
Figure 5
Receiver Operator Characteristic (ROC) curve for three factors associated with PCa aggression. Serum PSA levels, number of SNVs, and cumulative variant frequency (VF) calculated as the sum of variant frequency differences between tumor and blood samples that are above 2.0%. VF thus accounts for both the breadth and depth of mutation load within each population of heteroplasmic mtDNA.

References

    1. Jemal A, Siegel R, Ward E, Hao Y, Xu J, Thun MJ. Cancer statistics, 2009. CA Cancer J Clin 2009; 59(4):225–249. - PubMed
    1. La Vecchia C, Bosetti C, Lucchini F, Bertuccio P, Negri E, Boyle P, Levi F. Cancer mortality in Europe, 2000‐2004, and an overview of trends since 1975. Ann Oncol 2010; 21(6):1323–1360. - PubMed
    1. Bigler SA, Pound CR, Zhou X. A retrospective study on pathologic features and racial disparities in prostate cancer. Prostate Cancer 2011; 2011:239460. - PMC - PubMed
    1. Hsing AW, Tsao L, Devesa SS. International trends and patterns of prostate cancer incidence and mortality. Int J Cancer 2000; 85(1):60–67. - PubMed
    1. Tindall EA, Monare LR, Petersen DC, van Zyl S, Hardie RA, Segone AM, Venter PA, Bornman MS, Hayes VM. Clinical presentation of prostate cancer in black South Africans. Prostate 2014; 74(8):880–891. - PMC - PubMed

Publication types

MeSH terms