. 2015 Dec 14;10(12):e0144864.
doi: 10.1371/journal.pone.0144864. eCollection 2015.

Huntingtin Subcellular Localisation Is Regulated by Kinase Signalling Activity in the StHdhQ111 Model of HD

Affiliations

Huntingtin Subcellular Localisation Is Regulated by Kinase Signalling Activity in the StHdhQ111 Model of HD

Kathryn R Bowles et al. PLoS One. .

Erratum in

Abstract

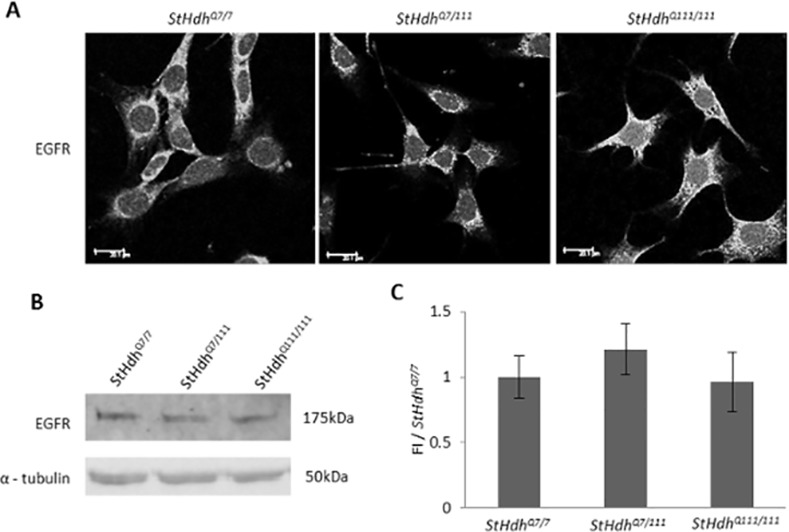
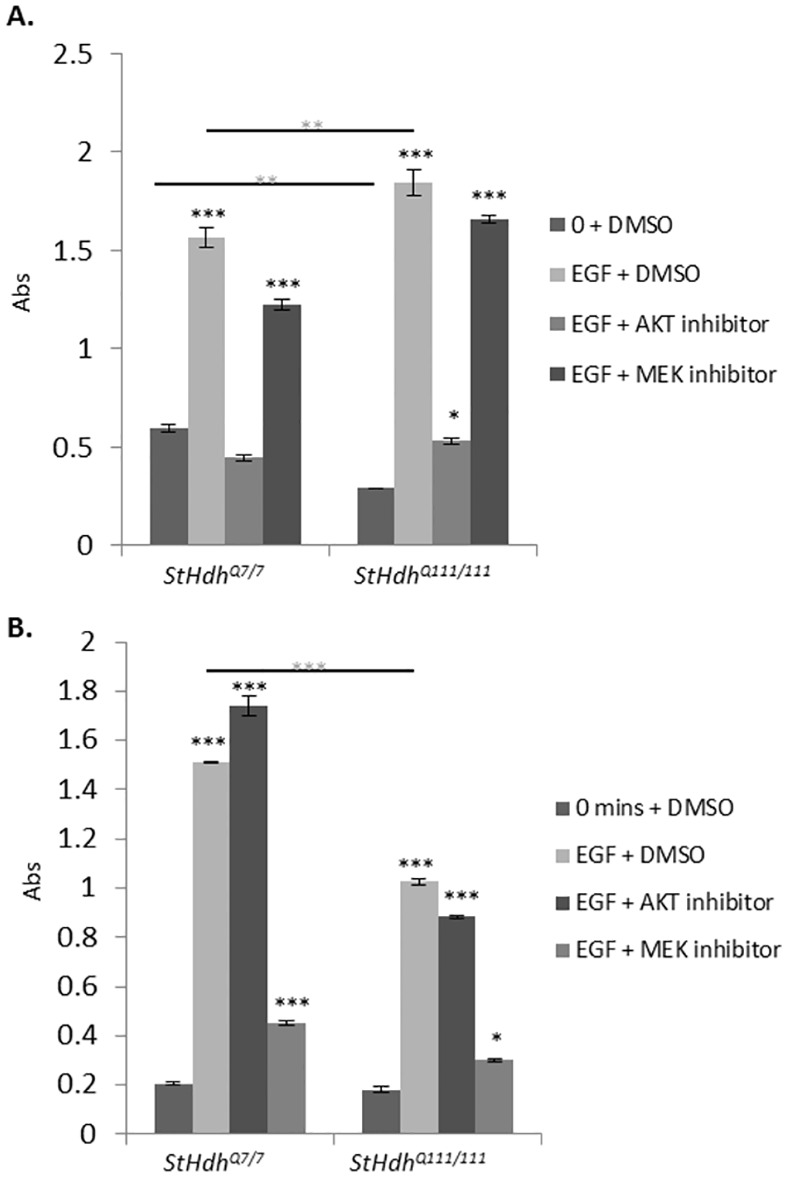
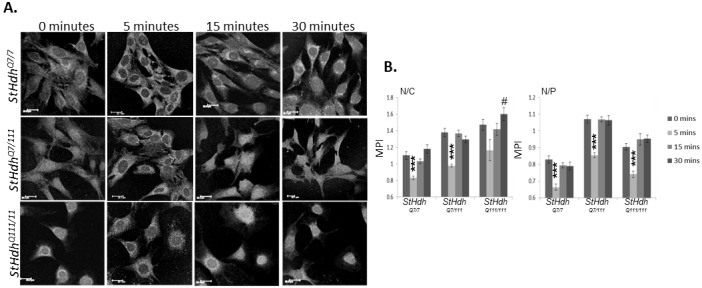
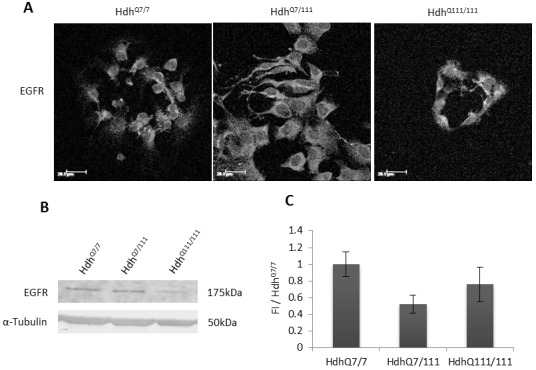
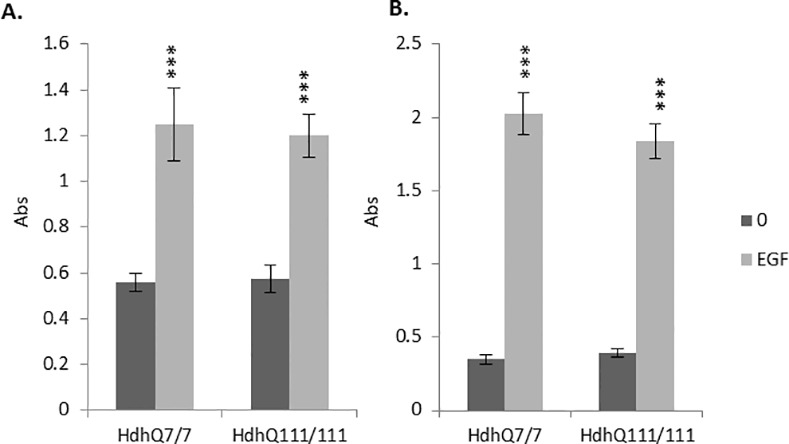
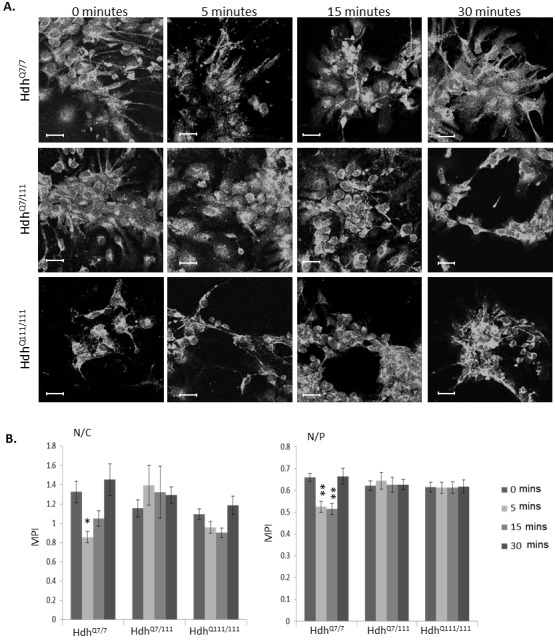
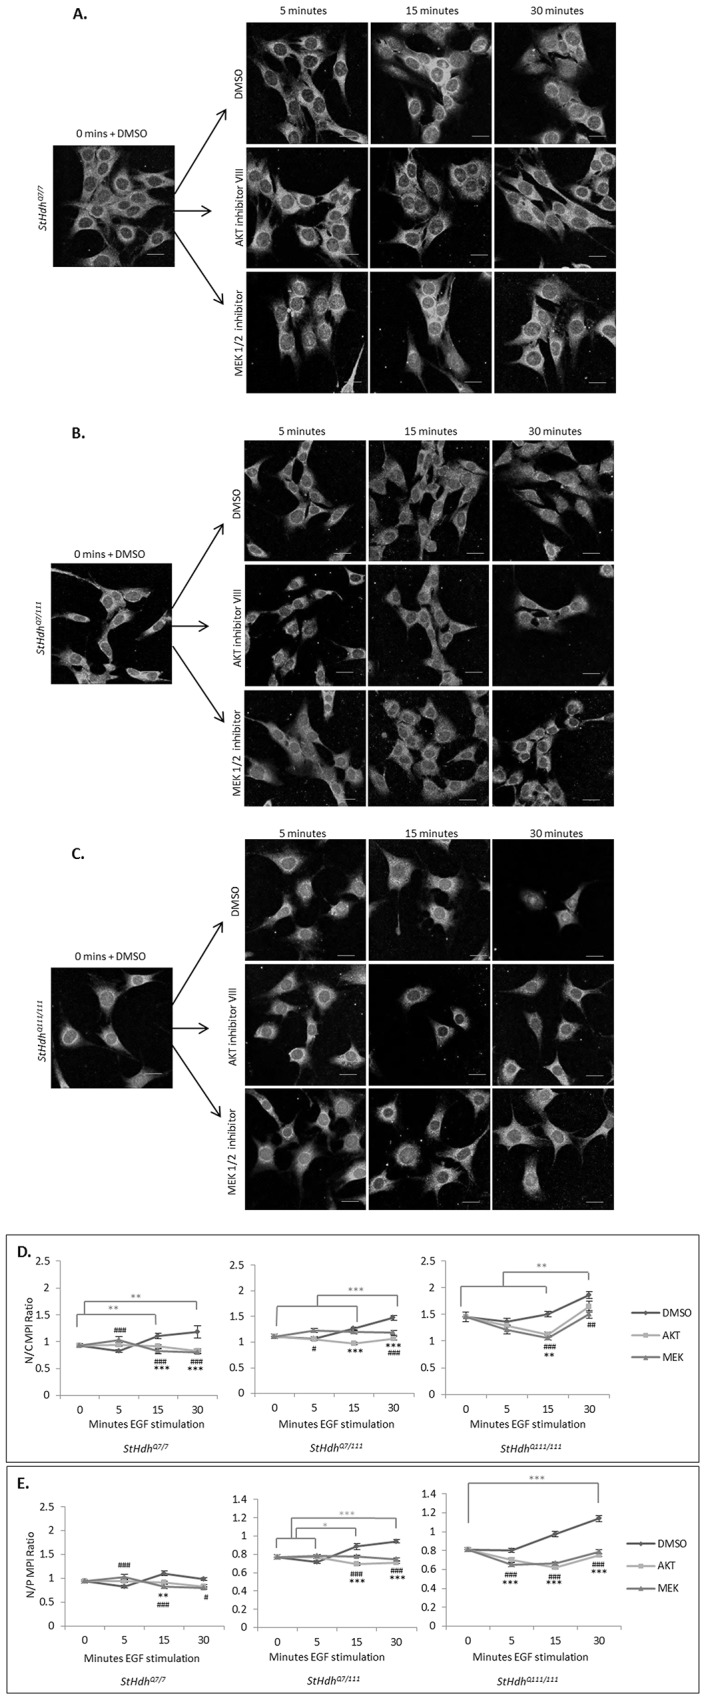
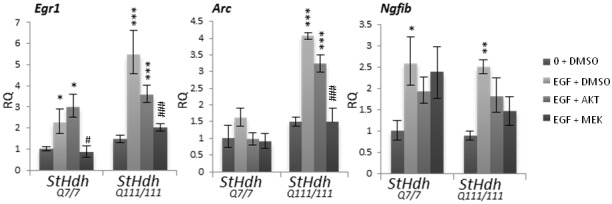
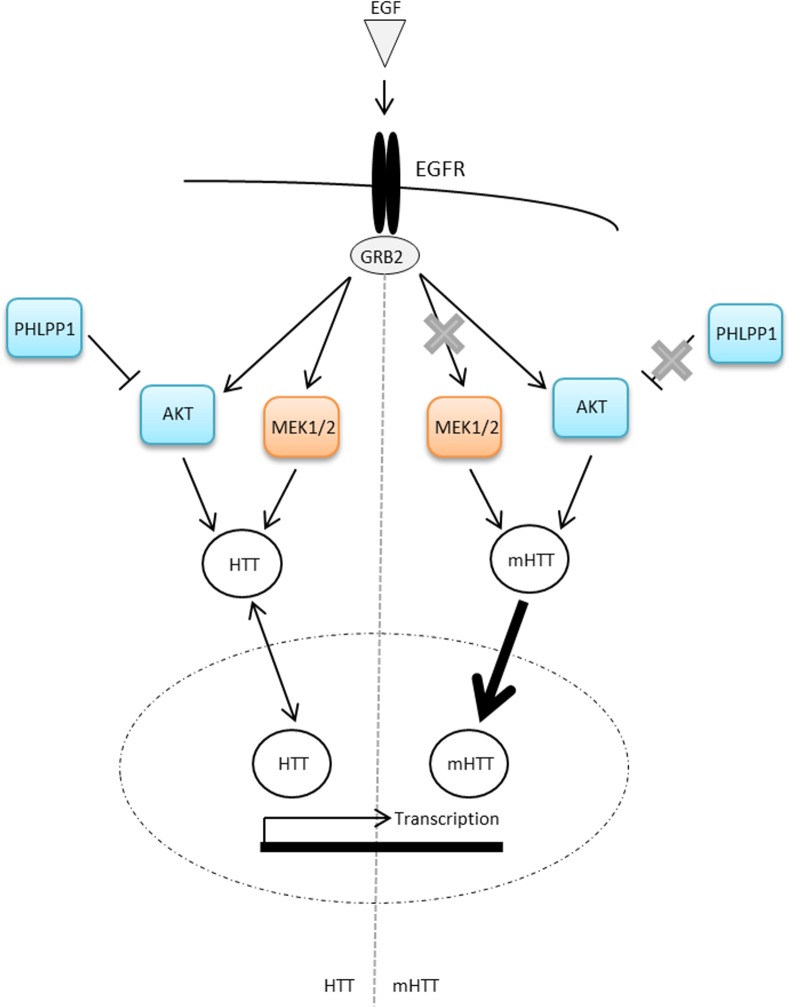
Huntington's disease is a neurodegenerative disorder characterised primarily by motor abnormalities, and is caused by an expanded polyglutamine repeat in the huntingtin protein. Huntingtin dynamically shuttles between subcellular compartments, and the mutant huntingtin protein is mislocalised to cell nuclei, where it may interfere with nuclear functions, such as transcription. However, the mechanism by which mislocalisation of mutant huntingtin occurs is currently unknown. An immortalised embryonic striatal cell model of HD (StHdhQ111) was stimulated with epidermal growth factor in order to determine whether the subcellular localisation of huntingtin is dependent on kinase signalling pathway activation. Aberrant phosphorylation of AKT and MEK signalling pathways was identified in cells carrying mutant huntingtin. Activity within these pathways was found to contribute to the regulation of huntingtin and mutant huntingtin localisation, as well as to the expression of immediate-early genes. We propose that altered kinase signalling is a phenotype of Huntington's disease that occurs prior to cell death; specifically, that altered kinase signalling may influence huntingtin localisation, which in turn may impact upon nuclear processes such as transcriptional regulation. Aiming to restore the balance of activity between kinase signalling networks may therefore prove to be an effective approach to delaying Huntington's disease symptom development and progression.


Conflict of interest statement

Competing Interests: The authors have declared that no competing interests exist.

Figures

Fig 1
Fig 1. A. The EGFR is present in StHdh Q7/7, StHdh Q7/111 and StHdh Q111/111, cells and has a similar subcellular localisation Scale bar = 20μm. B. Western Blot indicating similar expression of the EGFR protein in all three cell lines, α-tubulin was used as a loading control. C. Quantification of fluorescence intensity of protein bands in B normalised to loading control and expressed as a proportion of StHdh Q7/7 (FI/StHdh Q7/7); there are no significant differences in the levels of EGFR between StHdh Q7/7, StHdh Q7/111 and StHdh Q111/111 cells.
Error bars = ± SEM. Images are representative of multiple experiments. N = 3 replications.
Fig 2
Fig 2. Mean absorbance (Abs) read at 450nm following a sandwich ELISA protocol for the detection of phosphorylated A. AKT1 and B. MEK1 in StHdh Q7/7 and StHdh Q111/111 cells at 0 mins and 10 mins of 100ng/ml EGF stimulation, either with or without a prior 2 hour incubation with 500nM AKT inhibitor VIII or 1μM MEK 1/2 inhibitor.
In cases where inhibitors were not used, cells were incubated with the equivalent volume of DMSO for the same amount of time prior to treatment and processing. Error bars = ±SEM. Black asterisks denote a significant difference from 0 mins + DMSO. Grey asterisks indicate genotypic differences. N = 3 replications *p<0.05, ** p<0.01, *** p<0.001.
Fig 3
Fig 3. A. Subcellular localisation of an N-terminal epitope of huntingtin and mutant huntingtin in StHdh Q7/7, StHdh Q7/111 and StHdh Q111/111 cell lines. Cells were fixed following 0, 5, 15 and 30 min. of stimulation with 100ng/ml EGF, labelled with Mab2166 against amino acids 181–810, then analysed by confocal microscopy. Scale bar = 20μm. B. Quantitative analysis of immunofluorescence images in A. Nuclear/Cytoplasmic (N/C) and Nuclear/Perinuclear (N/P) mean pixel intensity ratios (MPI) for StHdh Q7/7, StHdh Q7/111 and StHdh Q111/111 cells following 0, 5, 15 and 30 min. of stimulation with 100ng/ml EGF.
Mean pixel intensities were calculated from confocal microscopy images using GNU Image Manipulator. All images were randomised and analysed blind to genotype and length of time stimulated with EGF. Each condition consisted of 9 confocal microscopy images taken from 3 separate coverslips. n = 66–91. Error bars = ± SEM. Data representative of 3 experiments; * Denotes a significant difference from 0min.; # Denotes a significant difference from 5mins; */# p<0.05, **/## p<0.01, ***/### p<0.001.
Fig 4
Fig 4. A. The EGFR is present in HdhQ7/7, HdhQ7/111 and HdhQ111/111, cells and has a similar subcellular localisation. Scale bar = 20μm B. Western Blot indicating similar expression of the EGFR protein in all three genotypes, α-tubulin was used as a loading control. C. Quantification of fluorescence intensity of protein bands in B normalised to loading control and expressed as a proportion of HdhQ7/7 (FI/HdhQ7/7).
Error bars = ± SEM. Images are representative of multiple experiments. N = 3 replications.
Fig 5
Fig 5. Mean absorbance (Abs) read at 450nm following a sandwich ELISA protocol for the detection of phosphorylated A. AKT1 and B. MEK1 in HdhQ7/7 and HdhQ111/111 primary cells at 0 mins and 10 mins of 100ng/ml EGF stimulation.
Error bars = ±SEM. Black asterisks denote a significant difference from 0 mins + DMSO. N = 5 replications. *** p<0.001.
Fig 6
Fig 6. Subcellular localisation of an N-terminal epitope of huntingtin and mutant huntingtin in HdhQ7/7, HdhQ7/111 and HdhQ111/111 primary cell lines.
Cells were fixed following 0, 5, 15 and 30 min. of stimulation with 100ng/ml EGF, labelled with Mab2166, then analysed by confocal microscopy. Scale bar = 20μm. B. Quantitative analysis of immunofluorescence images in A. Nuclear/Cytoplasmic (N/C) and Nuclear/Perinuclear (N/P) mean pixel intensity ratios (MPI) for HdhQ7/7, HdhQ7/111 and HdhQ111/111 primary cells following 0, 5, 15 and 30 min. of stimulation with 100ng/ml EGF. Mean pixel intensities were calculated from confocal microscopy images using GNU Image Manipulator. All images were randomised and analysed blind to genotype and length of time stimulated with EGF. Each condition consisted of 9 confocal microscopy images taken from 3 separate coverslips. n = 49–70. Error bars = ± SEM. Data representative of 3 experiments; * Denotes a significant difference from 0min.; *p<0.05, ** p<0.01.
Fig 7
Fig 7. A. StHdh Q7/7, B. StHdh Q7/111 and C. StHdh Q111/111 cells treated with either AKT inhibitor VIII, MEK 1/2 inhibitor, or the equivalent volume of DMSO for 2 hours prior to 0, 5, 15 and 30 mins stimulation with 100ng/ml EGF, then probed with amino-terminal huntingtin antibody Mab2166. Scale bar = 20μm. D-E. Quantification of mean pixel intensity (MPI) from images represented in A-C for the D. Nuclear/Cytoplasmic (N/C) ratio and E. Nuclear/Perinuclear (N/P) ratio.
Error bars = SEM. Light grey bars and asterisks signify statistically significant differences between DMSO conditions. Black asterisks and hashes indicate statistically significant differences between DMSO vs AKT inhibitor conditions and DMSO vs MEK inhibitor conditions, respectively. Data representative of three experiments. n = 85–135. */# p<0.05, **/## p<0.01, ***/### p<0.001.
Fig 8
Fig 8. Relative quantitation (RQ) values representing gene expression fold change of Egr1, Arc and Ngfib in StHdh Q7/7 and StHdh Q111/111 cells following inhibition with either 500nM AKT inhibitor VIII, 1μM MEK 1/2 inhibitor or the equivalent volume of DMSO, followed by 0 or 2 hours of 100ng/ml EGF stimulation.
Statistical analysis was conducted on ΔCt values. Error bars = ± SEM. Asterisks denote a significant difference from 0 + DMSO, hashes indicate a significant difference from EGF + DMSO. Data representative of two experiments. N = 6.*/# p<0.05, **/## p<0.01, ***/### p<0.001.
Fig 9
Fig 9. Simplified cartoon of the hypothesised relationship between EGF-stimulated kinase activation, huntingtin localisation and transcriptional regulation.
Upon binding to the EGFR, EGF elicits the phosphorylation of MEK and AKT. In the presence of mutant huntingtin, aberrant interactions with GRB2 and suppressed PHLPP1 expression serve to alter the phosphorylation response. In turn, active MEK and AKT regulate the subcellular localisation of huntingtin, possibly by post-translational modification; however this regulation is impaired due to mutant huntingtin-associated aberrant kinase phosphorylation. Regulation of huntingtin nuclear localisation may then influence transcriptional control via multiple mechanisms. As such, altered nuclear localisation of mutant huntingtin could disrupt the control of these mechanisms and would result in altered transcriptional regulation.

References

    1. Buckley NJ, Johnson R, Zuccato C, Bithell A, Cattaneo E. The role of REST in transcriptional and epigenetic dysregulation in Huntington’s disease. Neurobiol Dis. Elsevier Inc.; 2010;39: 28–39. 10.1016/j.nbd.2010.02.003 - DOI - PubMed
    1. Novak MJU, Tabrizi SJ. Huntington’s disease. BMJ. 2010;341: 34–40. 10.1136/bmj.c3109 - DOI - PubMed
    1. Wexler NS. Huntington’s disease: advocacy driving science. Annu Rev Med. 2012;63: 1–22. 10.1146/annurev-med-050710-134457 - DOI - PubMed
    1. Vonsattel JPG, DiFiglia M. Huntington disease. J Neuropathol Exp Neurol. 1998;57: 369–384. - PubMed
    1. Rosas HD, Salat DH, Lee SY, Zaleta AK, Pappu V, Fischl B, et al. Cerebral cortex and the clinical expression of Huntington’s disease: complexity and heterogeneity. Brain. 2008;131: 1057–1068. 10.1093/brain/awn025 - DOI - PMC - PubMed

Publication types

MeSH terms