Review
. 2016 Feb;36(2):302-25.
doi: 10.1177/0271678X15606723. Epub 2015 Oct 14.

Cerebral small vessel disease: Capillary pathways to stroke and cognitive decline

Affiliations
Review

Cerebral small vessel disease: Capillary pathways to stroke and cognitive decline

Leif Østergaard et al. J Cereb Blood Flow Metab. 2016 Feb.

Abstract

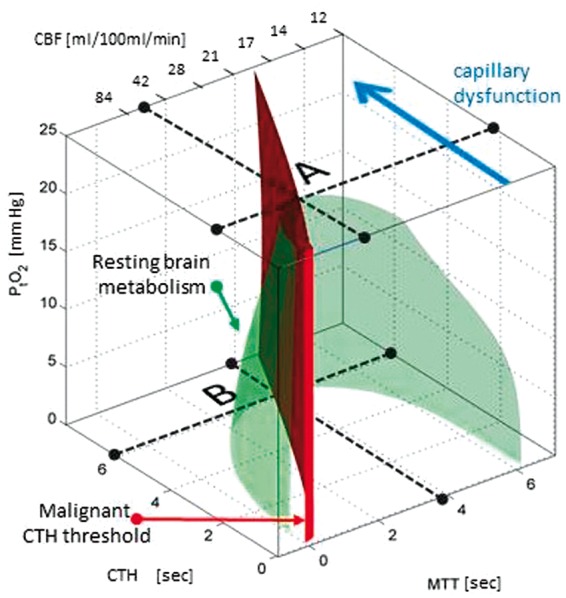
Cerebral small vessel disease (SVD) gives rise to one in five strokes worldwide and constitutes a major source of cognitive decline in the elderly. SVD is known to occur in relation to hypertension, diabetes, smoking, radiation therapy and in a range of inherited and genetic disorders, autoimmune disorders, connective tissue disorders, and infections. Until recently, changes in capillary patency and blood viscosity have received little attention in the aetiopathogenesis of SVD and the high risk of subsequent stroke and cognitive decline. Capillary flow patterns were, however, recently shown to limit the extraction efficacy of oxygen in tissue and capillary dysfunction therefore proposed as a source of stroke-like symptoms and neurodegeneration, even in the absence of physical flow-limiting vascular pathology. In this review, we examine whether capillary flow disturbances may be a shared feature of conditions that represent risk factors for SVD. We then discuss aspects of capillary dysfunction that could be prevented or alleviated and therefore might be of general benefit to patients at risk of SVD, stroke or cognitive decline.

Keywords: Cerebral small vessel disease; capillary dysfunction; dementia; oxygenation; stroke.


Figures

Figure 1.
Figure 1.
The green isocontour surface corresponds to all combinations of CBF, CTH, and PtO2 for which brain oxygenation – according to our model – matches the metabolic rate of oxygen in resting brain. Transitions to combinations of CBF, CTH and PtO2 that correspond to points located outside the resulting, bell-shaped surface are therefore predicted to result in immediate neurological symptoms, and tissue damage if they persist. The red plane marks the boundary, left of which vasodilation reduces tissue oxygen availability (dubbed malignant CTH). The maximum value that CTH can attain at a PtO2 of 25 mmHg, if oxygen availability is to support the metabolic needs of resting brain tissue, is indicated by the label A. As CTH increases further (progressive capillary dysfunction), CBF must be attenuated in order to reduce the level of ‘physiological shunting’. Importantly, continued tissue oxygen metabolism reduces tissue oxygen tension, and thereby improves blood-tissue concentration gradients and net extraction. As a result, the bell-shaped surface widens towards its base, reflecting that higher levels of CTH (more severe capillary dysfunction) can be accommodated by attenuating CBF and CBF responses. A critical limit is reached, however, as PtO2 approaches zero – label B. At this point, the metabolic needs of tissue are met by ‘delaying’ mean transit time (MTT) to a threshold of approximately 4 s, corresponding to CBF = 21 ml/100ml/min. As a result, slight increases in CTH (e.g. caused by an infection or dehydration) or a slight change in CBF (small flow reductions as well as flow increases) can trigger a critical reduction in tissue oxygen availability, and thereby stroke-like symptoms. The blue arrow indicates progressive capillary flow disturbances, which cause CTH to increase and tissue oxygen availability to approach the metabolic requirements of resting brain tissue (the green iso-contour). Note that the traditional notion of ischemia (which disregards capillary flow patterns) considers only a reduction in CBF (increase in MTT), that is, a transition along the x-axis in the three-dimensional plot. Source: Reproduced and modified from the literature. CBF: cerebral blood flow; CTH: capillary transit time heterogeneity; PtO2: tissue oxygen tension.
Figure 2.
Figure 2.
Panel (a) illustrates the organization of endothelial cells, basement membrane and pericytes in the vessel wall. Capillaries are ensheathed by astrocytic endfeet, and neuronal terminals are closely apposed to capillaries and pericytes. Source: Reproduced from Hamilton et al. according to the Creative Commons terms. Panel (b) shows a cross section of normal capillary with a thin basement membrane (arrow) and normal appearing endothelial cell (e). In ageing (Panel (c)), thickened basement membranes (arrows), pericapillary fibrosis and pericyte loss are often found. Source: Panels (b) and (c) are reproduced from Farkas et al. Panel (d) shows a capillary cross section from the skin of a patient with Fabry’s disease. Note the lamellar sphingolipid inclusions in the capillary endothelium (arrow). These inclusions disappear upon enzyme replacement therapy. Source: Reproduced from Eng et al. Panel (e) shows typical cerebral capillary wall pathology in human AD. The arrow indicates pericyte degeneration. The symbols denote lumen (l), endothelial cell (e), basement membrane (*) and pericyte (p). Source: Reproduced from Farkas et al. Panel (f) shows a cross section of a muscle capillary from a patient with MELAS. Note the thickened basement membrane and increased number and size of mitochondria in the pericyte. Source: Reproduced from Sakuta and Nonaka. Panel (g) shows a cross section of a cerebral capillary from the motor cortex of a MELAS patient with accumulation of mitochondria in the endothelial cell. Source: Reproduced from Ohama et al. with permission from the publisher. AD: Alzheimer’s disease; MELAS: mitochondrial encephalopathy with lactic acidosis and stroke-like episodes.
Figure 3.
Figure 3.
The two leftmost columns in Figure 3 show acute FLAIR and ADC at four identical slice-positions in an 84-year-old patient who presented with acute stroke symptoms three hours earlier. Acute ischemic changes are visible as areas of low ADC (red circles), consistent with reduced extracellular water diffusion and often ascribed to anoxic depolarizations. The FLAIR images show discrete (purple ellipses) and confluent (brown circles) white matter hyperintensities. The rightmost column show FLAIR images in the same slice positions 30 days later. The green overlays on bright tissue lesions (within the red circles) indicate tissue that infarcted in relation to the stroke episode. Note that areas of elevated CTH and MTT are observed in relation to the area of low ADC. The COV is relatively independent of CBF in normal microvascular network, and this map therefore helps visualize areas where CTH are higher or lower than expected. Note that COV is elevated in the tissue areas with elevated ADC, indicating that microvascular flow patterns are disturbed beyond what would be expected based on reduced CBF alone. It should be kept in mind that PWI is sensitive to the tracer retention in a large tissue volume, in which small arteries/arterioles, capillaries and venules/small veins each take up roughly one-third of the blood volume. The gradient-echo pulse sequence used in this study is equally sensitive to tracer in these vessels, irrespective of their size, while PWI by spin-echo MRI is weighted towards capillary-size vessels. Our preliminary experience shows that disease may alter COV, as determined by gradient- and spin-echo PWI, respectively, in opposing directions (results not shown). We speculate that areas of reduced COV in this patient may reflect that flow through small arteries and arterioles become more uniform as their walls undergo morphological changes in chronic SVD. The OEF as determined by our biophysical model is also shown. Widespread areas of elevated white matter OEF are noted, especially in the hemisphere affected by the stroke. Detailed studies of well-characterized SVD patients are clearly needed to understand how changes in capillary morphology and local tissue oedema (elevated ADC) affect CTH values determined by PWI methods. ADC: apparent diffusion coefficient; CBF: cerebral blood flow; MTT: Mean Transit Time; COV: CTH/MTT ratio; CTH: capillary transit-time heterogeneity; FLAIR: fluid attenuated inversion recovery; MRI: magnetic resonance imaging; OEF: oxygen extraction fraction; PWI: perfusion weighted imaging; SVD: small vessel disease.

Similar articles

Cited by

References

    1. Pantoni L. Cerebral small vessel disease: from pathogenesis and clinical characteristics to therapeutic challenges. Lancet Neurol 2010; 9: 689–701. - PubMed
    1. Wardlaw JM, Smith EE, Biessels GJ, et al. Neuroimaging standards for research into small vessel disease and its contribution to ageing and neurodegeneration. Lancet Neurol 2013; 12: 822–838. - PMC - PubMed
    1. Wardlaw JM, Doubal FN, Valdes-Hernandez M, et al. Blood–brain barrier permeability and long-term clinical and imaging outcomes in cerebral small vessel disease. Stroke 2013; 44: 525–527. - PMC - PubMed
    1. Wardlaw JM, Smith C, Dichgans M. Mechanisms of sporadic cerebral small vessel disease: insights from neuroimaging. Lancet Neurol 2013; 12: 483–497. - PMC - PubMed
    1. Jespersen SN, Østergaard L. The roles of cerebral blood flow, capillary transit time heterogeneity and oxygen tension in brain oxygenation and metabolism. J Cereb Blood Flow Metab 2012; 32: 264–277. - PMC - PubMed

Publication types

MeSH terms