

Genetic ablation of soluble tumor necrosis factor with preservation of membrane tumor necrosis factor is associated with neuroprotection after focal cerebral ischemia
- PMID: 26661199
- PMCID: PMC5012516
- DOI: 10.1177/0271678X15610339
Genetic ablation of soluble tumor necrosis factor with preservation of membrane tumor necrosis factor is associated with neuroprotection after focal cerebral ischemia
Abstract
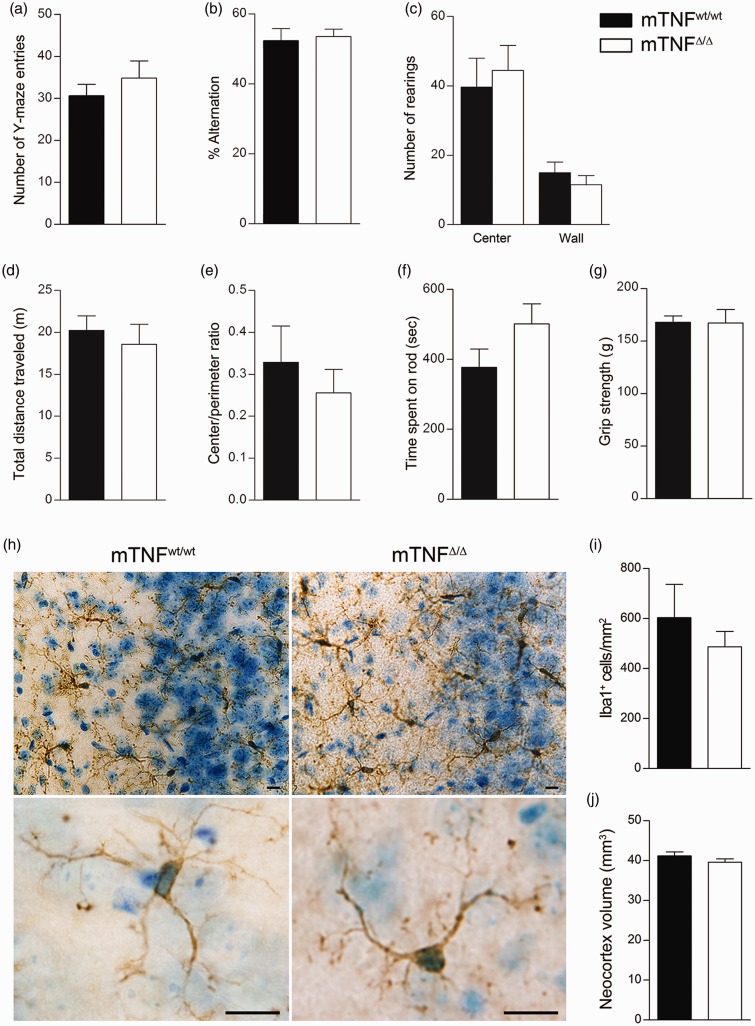
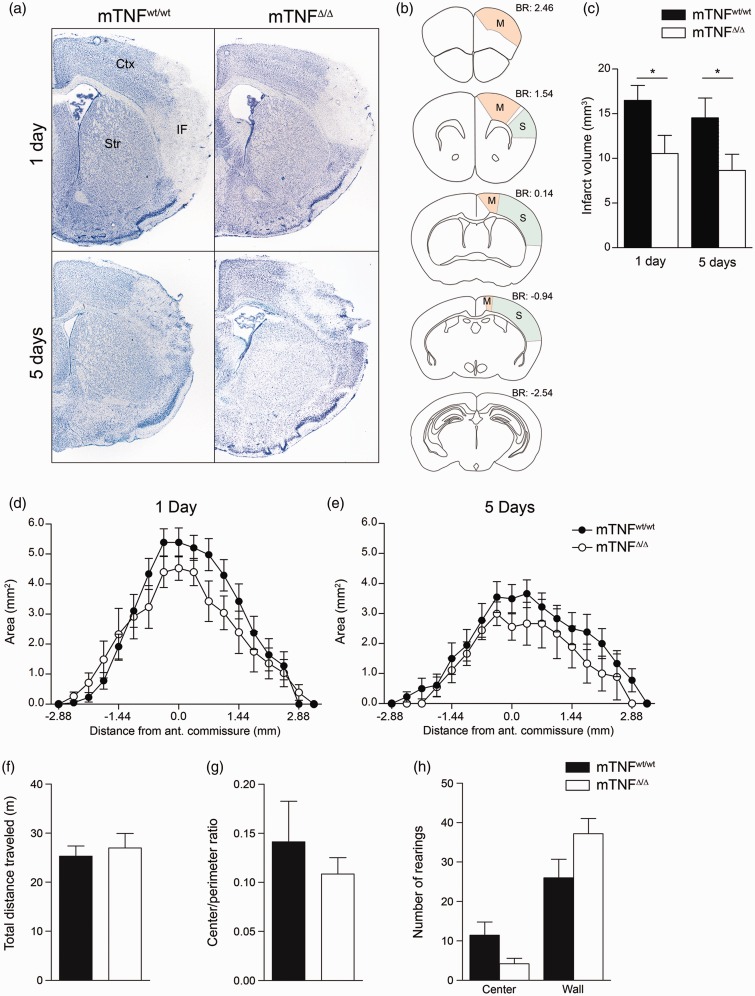
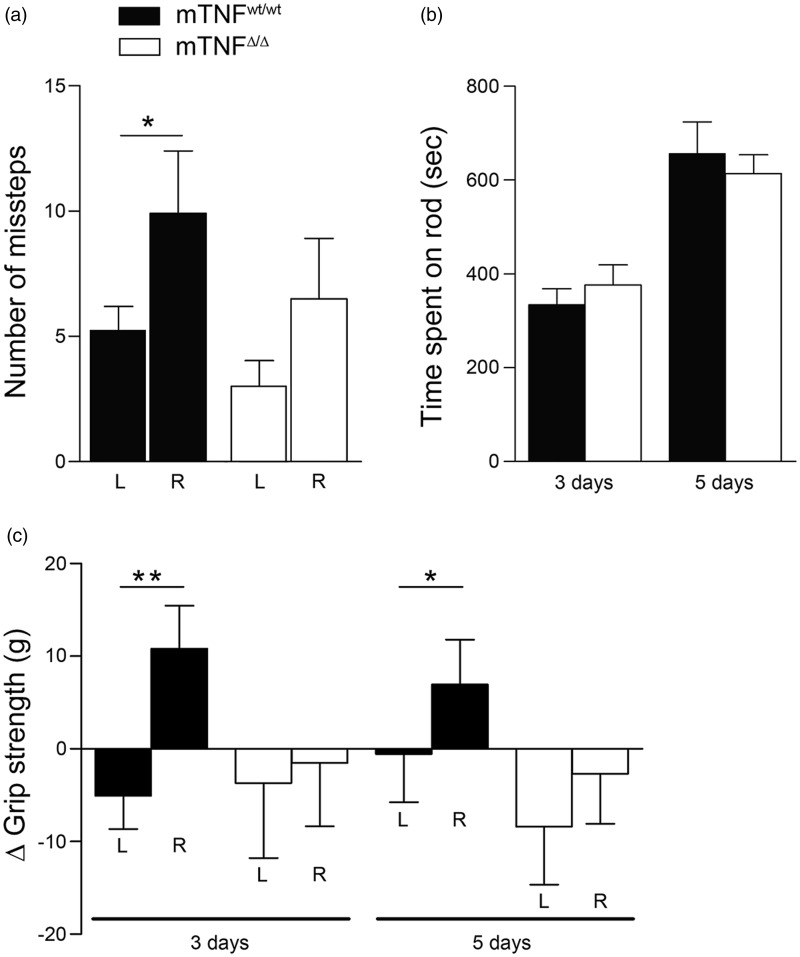
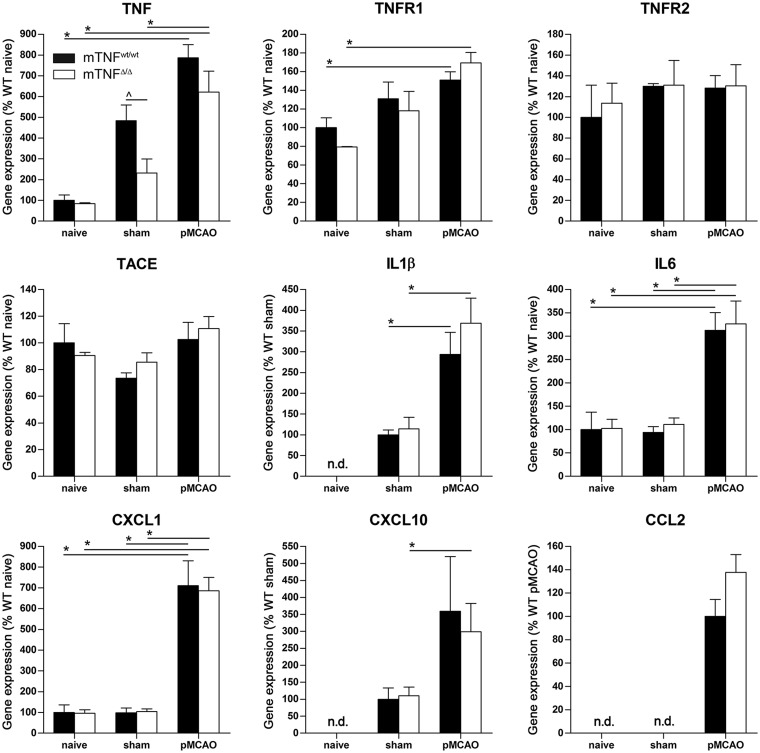
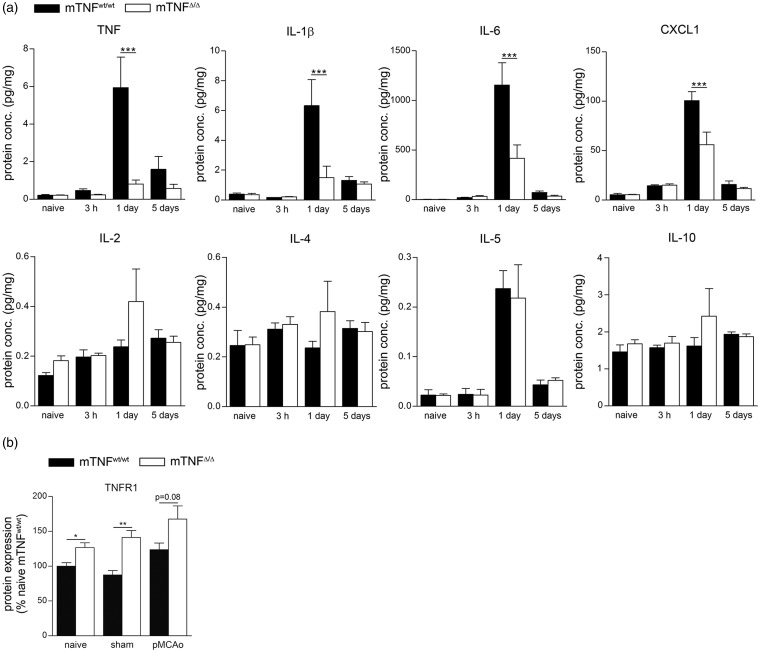
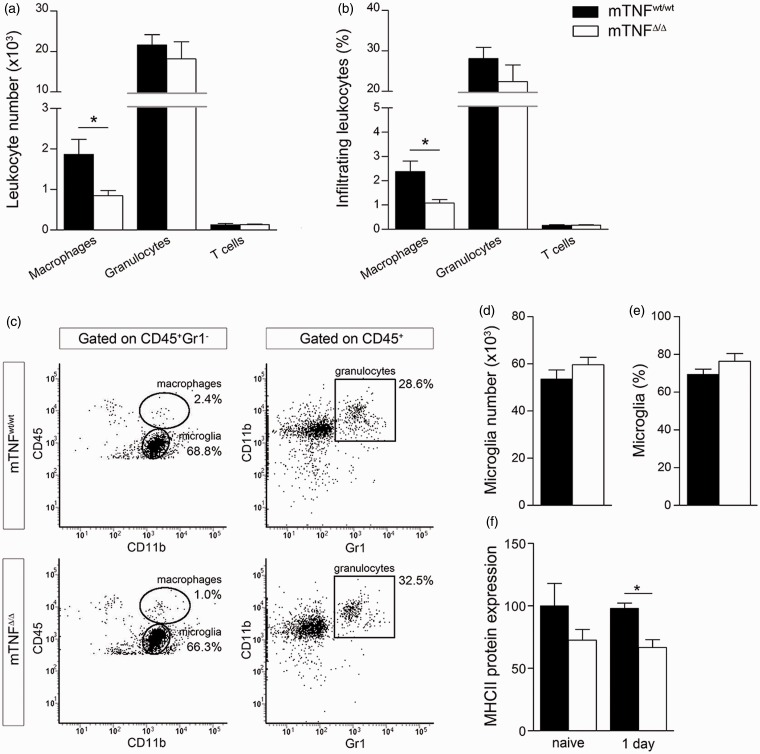
Microglia respond to focal cerebral ischemia by increasing their production of the neuromodulatory cytokine tumor necrosis factor, which exists both as membrane-anchored tumor necrosis factor and as cleaved soluble tumor necrosis factor forms. We previously demonstrated that tumor necrosis factor knockout mice display increased lesion volume after focal cerebral ischemia, suggesting that tumor necrosis factor is neuroprotective in experimental stroke. Here, we extend our studies to show that mice with intact membrane-anchored tumor necrosis factor, but no soluble tumor necrosis factor, display reduced infarct volumes at one and five days after stroke. This was associated with improved functional outcome after experimental stroke. No changes were found in the mRNA levels of tumor necrosis factor and tumor necrosis factor-related genes (TNFR1, TNFR2, TACE), pro-inflammatory cytokines (IL-1β, IL-6) or chemokines (CXCL1, CXCL10, CCL2); however, protein expression of TNF, IL-1β, IL-6 and CXCL1 was reduced in membrane-anchored tumor necrosis factor(Δ/Δ) compared to membrane-anchored tumor necrosis factor(wt/wt) mice one day after experimental stroke. This was paralleled by reduced MHCII expression and a reduction in macrophage infiltration in the ipsilateral cortex of membrane-anchored tumor necrosis factor(Δ/Δ) mice. Collectively, these findings indicate that membrane-anchored tumor necrosis factor mediates the protective effects of tumor necrosis factor signaling in experimental stroke, and therapeutic strategies specifically targeting soluble tumor necrosis factor could be beneficial in clinical stroke therapy.
Keywords: Tumor necrosis factor; behavior; chemokines; cytokines; macrophages; microglia; neuroprotection.
© The Author(s) 2015.
Figures
Similar articles
-
Genetic Ablation of Soluble TNF Does Not Affect Lesion Size and Functional Recovery after Moderate Spinal Cord Injury in Mice.Mediators Inflamm. 2016;2016:2684098. doi: 10.1155/2016/2684098. Epub 2016 Dec 14. Mediators Inflamm. 2016. PMID: 28070141 Free PMC article.
-
Conditional ablation of myeloid TNF increases lesion volume after experimental stroke in mice, possibly via altered ERK1/2 signaling.Sci Rep. 2016 Jul 7;6:29291. doi: 10.1038/srep29291. Sci Rep. 2016. PMID: 27384243 Free PMC article.
-
A novel mechanism of FK506-mediated neuroprotection: downregulation of cytokine expression in glial cells.Glia. 2005 Jan 1;49(1):36-51. doi: 10.1002/glia.20092. Glia. 2005. PMID: 15390105
-
Inflammatory cytokines in experimental and human stroke.J Cereb Blood Flow Metab. 2012 Sep;32(9):1677-98. doi: 10.1038/jcbfm.2012.88. Epub 2012 Jun 27. J Cereb Blood Flow Metab. 2012. PMID: 22739623 Free PMC article. Review.
-
Post-stroke inflammation-target or tool for therapy?Acta Neuropathol. 2019 May;137(5):693-714. doi: 10.1007/s00401-018-1930-z. Epub 2018 Nov 27. Acta Neuropathol. 2019. PMID: 30483945 Free PMC article. Review.
Cited by
-
Cerebral ischemia-induced angiogenesis is dependent on tumor necrosis factor receptor 1-mediated upregulation of α5β1 and αVβ3 integrins.J Neuroinflammation. 2016 Sep 1;13(1):227. doi: 10.1186/s12974-016-0697-1. J Neuroinflammation. 2016. PMID: 27586239 Free PMC article.
-
Cytokines as therapeutic targets for cardio- and cerebrovascular diseases.Basic Res Cardiol. 2021 Mar 26;116(1):23. doi: 10.1007/s00395-021-00863-x. Basic Res Cardiol. 2021. PMID: 33770265 Free PMC article. Review.
-
Electroacupuncture Attenuates Cerebral Ischemia and Reperfusion Injury in Middle Cerebral Artery Occlusion of Rat via Modulation of Apoptosis, Inflammation, Oxidative Stress, and Excitotoxicity.Evid Based Complement Alternat Med. 2016;2016:9438650. doi: 10.1155/2016/9438650. Epub 2016 Mar 31. Evid Based Complement Alternat Med. 2016. PMID: 27123035 Free PMC article.
-
Bibliometric analysis of tumor necrosis factor in post-stroke neuroinflammation from 2003 to 2021.Front Immunol. 2022 Oct 27;13:1040686. doi: 10.3389/fimmu.2022.1040686. eCollection 2022. Front Immunol. 2022. PMID: 36389810 Free PMC article.
-
Receptor-interacting protein kinase 3-mediated programmed cell necrosis in rats subjected to focal cerebral ischemia-reperfusion injury.Mol Med Rep. 2016 Jul;14(1):728-36. doi: 10.3892/mmr.2016.5311. Epub 2016 May 19. Mol Med Rep. 2016. PMID: 27220678 Free PMC article.
References
-
- Probert L. TNF and its receptors in the CNS: the essential, the desirable and the deleterious effects. Neuroscience 2015; 302: 2–22. - PubMed
-
- Black RA, Rauch CT, Kozlosky CJ, et al. A metalloproteinase disintegrin that releases tumour-necrosis factor-alpha from cells. Nature 1997; 385: 729–733. - PubMed
-
- Grell M, Douni E, Wajant H, et al. The transmembrane form of tumor necrosis factor is the prime activating ligand of the 80 kDa tumor necrosis factor receptor. Cell 1995; 83: 793–802. - PubMed
Publication types
MeSH terms
Substances
Grants and funding
LinkOut - more resources
Full Text Sources
Other Literature Sources
Medical
Miscellaneous
