. 2016 Oct;36(10):1790-1803.
doi: 10.1177/0271678X15611913. Epub 2015 Oct 23.

Neuronal NCX1 overexpression induces stroke resistance while knockout induces vulnerability via Akt

Affiliations

Neuronal NCX1 overexpression induces stroke resistance while knockout induces vulnerability via Akt

Pasquale Molinaro et al. J Cereb Blood Flow Metab. 2016 Oct.

Abstract

Three different Na+/Ca2+ exchanger (NCX) isoforms, NCX1, NCX2, and NCX3, are expressed in brain where they play a relevant role in maintaining Na+ and Ca2+ homeostasis. Although the neuroprotective roles of NCX2 and NCX3 in stroke have been elucidated, the relevance of NCX1 is still unknown because of embryonic lethality of its knocking-out, heart dysfunctions when it is overexpressed, and the lack of selectivity in currently available drugs. To overcome these limitations we generated two conditional genetically modified mice that upon tamoxifen administration showed a selective decrease or increase of NCX1 in cortical and hippocampal neurons. Interestingly, in cortex and hippocampus NCX1 overexpression increased, where NCX1 knock-out reduced, both exchanger activity and Akt1 phosphorylation, a neuronal survival signaling. More important, mice overexpressing NCX1 showed a reduced ischemic volume and an amelioration of focal and general deficits when subjected to transient middle cerebral artery occlusion. Conversely, NCX1-knock-out mice displayed a worsening of brain damage, focal and neurological deficits with a decrease in Akt phosphorylation. These results support the idea that NCX1 overexpression/activation may represent a feasible therapeutic opportunity in stroke intervention.

Keywords: Akt; Cre-LoxP; NCX1; Na+-Ca2+ exchanger; stroke.


Figures

Figure 1.
Figure 1.
Gene targeting of NCX1.4 construct in ROSA26 locus and of exon 11 of the endogenous ncx1 gene. (a) Cartoon representing the structure of wild-type (wt) and targeted (tg) alleles for ncx1.4over mice in ROSA26 locus located on the E3 region of chromosome 6. The Xba I restriction site was the insertion site for flox-conditioned ncx1.4 DNA construct. Neomycin resistance cassette (neoR) (shaded box), flox sequences (black filled triangles), the probe used in Southern blot analysis (black bars), as well as the DNA fragments generated after digestion with EcoR I are represented. E, EcoR I; V, EcoR V. (b) Southern blot analysis of EcoR I digested genomic DNA isolated from ESCs clones with depicted DNA probe. Non-recombinant ESCs show a single band at 15 kb, whereas the ESCs heterozygous for NCX1.4 construct integration show a band at 15 kb for wild-type allele and a band at 6 kb for the targeted allele. (c) Cartoon representing the structure of exon 11 in wild-type (wt) and targeted (tg) ncx1 gene for ncx1neuko mouse strain on the E3 region of chromosome 17. Exon 11 (shaded box) with its neighboring genomic region (grey line), flox sequences (grey filled triangles), as well as the map of restriction sites are represented. H, Hind III; V, EcoR V; Ba, BamH I; Bg, Bgl II. (d) Topological model of NCX1 resulting after the excision of the amino acid region 722-813. The 10 cylinders represent transmembrane segments; the light grey represents the region that is not translated into protein after the recombination of exon 11 by CreERt recombinase. (e) Screening by PCR of ESCs by Flp enzyme for the recombination of neoR cassette. (f) Screening by PCR of mice carrying the NCX1.4 construct. (g) Screening by PCR of mice with a homozygous floxed exon 11.
Figure 2.
Figure 2.
Effect of tamoxifen on genomic recombination in ncx1.4over and ncx1neuko mice. (a) Representation of the localization of the primers used for real-time PCR analysis in ncx1.4over mice. W, amplicon of non-recombined NCX1.4 DNA; C, amplicon of internal control for normalization; R, amplicon of recombined NCX1.4 DNA. (b) Percentage of recombined NCX1.4 locus in ncx1.4over mouse subjected to tamoxifen injection expressed as PCR signal of recombined NCX1.4 “R” normalized for internal control “C”. Values represent means ± SEM (n = 6 of two independent sessions). Statistical analysis was performed with two-way ANOVA, followed by Newman–Keuls test. *p < 0.05 versus vehicle treated control group, **p < 0.05 versus vehicle-treated mice and three days of tamoxifen treatment groups. (c) Representative gel electrophoresis of real-time PCR product obtained from genomic DNA of ncx1.4over mice. No nonspecific band was observed. (d) Representation of primers used for real-time PCR analysis in ncx1neuko mice. W, amplicon of non-recombinant exon 11 of endogenous ncx1 gene; C, amplicon of internal control for normalization on the exon 2 of endogenous ncx1 gene; R, amplicon of the recombinant exon 11. (e) Percentage of the recombinant exon 11 of endogenous ncx1 gene in ncx1neuko mouse subjected to tamoxifen injection expressed as the PCR signal of the recombinant exon 11 “R” normalized for internal control “C”. Values represent means ± SEM (n = 6 of two independent sessions). Statistical analysis was performed with two-way ANOVA, followed by Newman–Keuls test. *p < 0.05 versus vehicle treated control group, **p < 0.05 versus vehicle-treated mice and three days of tamoxifen treatment groups. (f) Representative gel electrophoresis of real-time PCR product obtained from genomic DNA of ncx1neuko mice. No nonspecific band was observed.
Figure 3.
Figure 3.
Expression of NCX1 transcript and protein in control or ncx1.4over mice following tamoxifen injection. (a) and (b) ncx1.4over mice treated for three or five days with tamoxifen show an increased expression levels of NCX1 mRNA (A) and protein (B) in cortex and hippocampus. Data were normalized on the basis of HGPRT for mRNA or of β-actin for protein signal and expressed as percentage of the vehicle control group taken as 100%. Values represent means ± SEM (n = 6 of three independent sessions). Statistical analysis was performed with two-way ANOVA, followed by Newman–Keuls test. *p < 0.05 versus control group, **p < 0.05 versus control and three days of tamoxifen treatment groups. (c) Distribution of NCX1 immunoreactivity in the somatosensory cortex of congenic ncx1+/+ (a, c) and ncx1.4over (b, d) mice treated for five days with tamoxifen. Distribution of NCX1 immunoreactivity in the hippocampal formation of congenic ncx1+/+ (e) and ncx1.4over (f) mice treated for five days with tamoxifen.
Figure 5.
Figure 5.
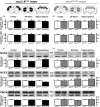
Quantification of NCX2 and NCX3 mRNA, and NCX2, NCX3, and PMCA protein levels in ncx1.4over and ncx1neuko mice treated with tamoxifen. (a) and (b) quantification of NCX2 and NCX3 mRNA in cortex, striatum, and hippocampus of (A) ncx1.4over, in white and black on the left, and of (B) ncx1neuko, in white and grey on the right, treated with tamoxifen for five days. Data are normalized for HGPRT and expressed as percentage of congenic wild-type (ncx1+/+) treated for five days with tamoxifen taken as 100%. Values represent means ± SEM. (n = 4 of two independent sessions). Statistical analysis was performed with unpaired t-test. At the top, a schematic representation of the cerebral areas used for the evaluation of mRNA levels. (c) and (d) Quantification of NCX2, NCX3, and PMCA protein levels in (c) ncx1.4over mice, in white and black on the left, and in (d) ncx1neuko mice, in white and grey on the right, subjected to five days of tamoxifen treatment. Data are normalized for β-actin and expressed as percentage of congenic wild-type (ncx1+/+) control subjected to five days of tamoxifen treatment. Values represent means ± SEM. (n = 4 of two independent sessions). Statistical analysis was performed with unpaired t-test.
Figure 4.
Figure 4.
Expression of NCX1 transcripts and protein in ncx1neuko mice following tamoxifen injection. (a) and (b) levels of expression of full-length mRNA and protein of NCX1 in cortex, striatum, and hippocampus of ncx1.4neuko and congenic wild-type (ncx1+/+) mice after a five-day treatment with tamoxifen. Data were normalized on the basis of HGPRT for mRNA or of β-actin for protein signal and expressed as percentage of congenic wild-type (ncx1+/+) group taken as 100%. Values represent means ± SEM (n = 6 of two independent sessions). Statistical analysis was performed with unpaired t-test. *p < 0.05 versus congenic wild-type (ncx1+/+) group. (c) Distribution of NCX1 immunoreactivity in the somatosensory cortex of congenic wild-type (ncx1+/+) (a) and ncx1neuko (b) mice after a five-day treatment with tamoxifen. A schematic representation of the examined cortical area of the brain is shown in (c). Distribution of NCX1 immunoreactivity in the hippocampal formation of congenic wild-type (ncx1+/+) (e) and ncx1neuko (f) mice after a five-day treatment with tamoxifen. Distribution of CreERt immunoreactivity in the somatosensory cortex and hippocampal formation of ncx1neuko (d and h, respectively) mice. A schematic representation of the examined hippocampal area of the brain is shown in (g).
Figure 6.
Figure 6.
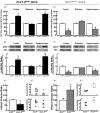
Effect of NCX1.4 overexpression and of NCX1 knock-out on NCX activity, Akt1 phosphorylation, ischemic volume, and neurological deficit scores. (a) and (e) quantification of NCX activity measured in the reverse mode of operation in synaptosomes from cortex, striatum, and hippocampus of adult (a) ncx1.4over and (e) ncx1neuko mice treated for five days with tamoxifen as measured by Na+-free induced [Ca2+]i increase. Each column represents means ± SEM of 30–60 synaptosomes prepared from four or five mice. Data are reported as percentage of NCX reverse mode in fresh preparation from respective congenic wild-type (ncx1+/+) mice. *p < 0.05 versus each respective wild-type (ncx1+/+) control. (b) and (f) Representative Western blots and relative quantification of Akt1 phosphorylation in the cortex, striatum, and hippocampus of (b) ncx1.4over and (f) ncx1neuko mice and their respective congenic wild-type (ncx1+/+) controls (n = 3 of two independent sessions). Statistical analysis was performed with unpaired t-test. Values represent means ± SEM. *p < 0.05 versus congenic wild-type (ncx1+/+) group. (c) and (g) Quantification of the infarct volume in (C) ncx1.4over and (G) ncx1neuko mice treated for five days with tamoxifen. The ischemic volume was normalized for the volume of the ipsilateral brain hemisphere and expressed as percentage of congenic control wild-type (ncx1+/+) mice treated for five days with tamoxifen taken as 100% (n = 7 of three independent sessions). Statistical analysis was performed with unpaired t-test. Values represent means ± SEM. *p < 0.05 versus congenic wild-type (ncx1+/+) group. (d) and (h) Quantification of the general (top) and focal neurological (bottom) deficits in (d) ncx1.4over and (h) ncx1neuko mice and their respective congenic wild-type (ncx1+/+) after tMCAO. Data were analyzed using the nonparametric Kruskal–Wallis test. *p < 0.05 versus congenic wild-type (ncx1+/+) group.

Similar articles

Cited by

References

    1. Nicoll DA, Longoni S, Philipson KD. Molecular cloning and functional expression of the cardiac sarcolemmal Na(+)-Ca2+ exchanger. Science 1990; 250(4980): 562–565. - PubMed
    1. Li Z, Matsuoka S, Hryshko LV, et al. Cloning of the NCX2 isoform of the plasma membrane Na(+)-Ca2+ exchanger. J Biol Chem 1994; 269(26): 17434–17439. - PubMed
    1. Nicoll DA, Quednau BD, Qui Z, et al. Cloning of a third mammalian Na+-Ca2+ exchanger, NCX3. J Biol Chem 1996; 271(40): 24914–24921. - PubMed
    1. Jeon D, Yang YM, Jeong MJ, et al. Enhanced learning and memory in mice lacking Na+/Ca2+ exchanger 2. Neuron 2003; 38(6): 965–976. - PubMed
    1. Molinaro P, Viggiano D, Nistico R, et al. Na+ -Ca2+ exchanger (NCX3) knock-out mice display an impairment in hippocampal long-term potentiation and spatial learning and memory. J Neurosci 2011; 31(20): 7312–7321. - PMC - PubMed

Publication types

MeSH terms