. 2015 Dec 14;10(12):e0145068.
doi: 10.1371/journal.pone.0145068. eCollection 2015.

Collagen Promotes Higher Adhesion, Survival and Proliferation of Mesenchymal Stem Cells

Affiliations

Collagen Promotes Higher Adhesion, Survival and Proliferation of Mesenchymal Stem Cells

Chinnapaka Somaiah et al. PLoS One. .

Abstract

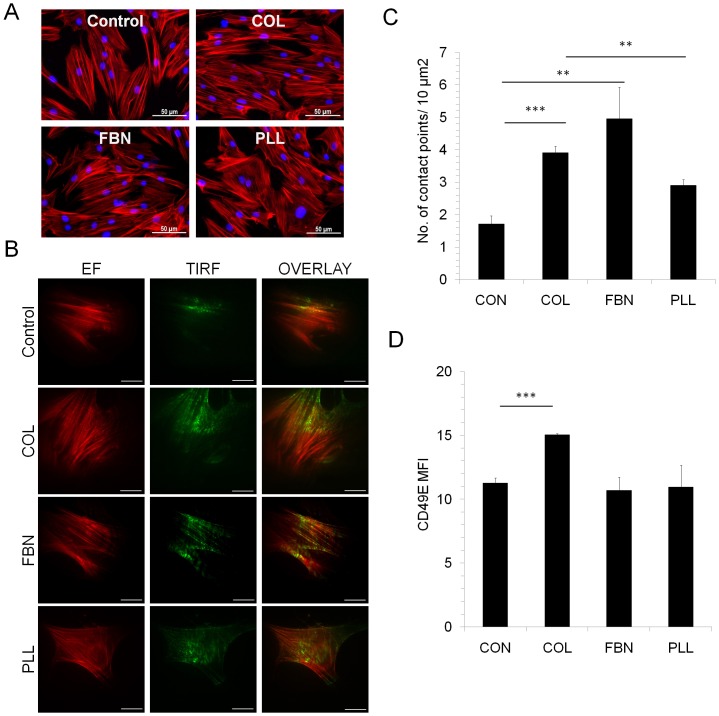
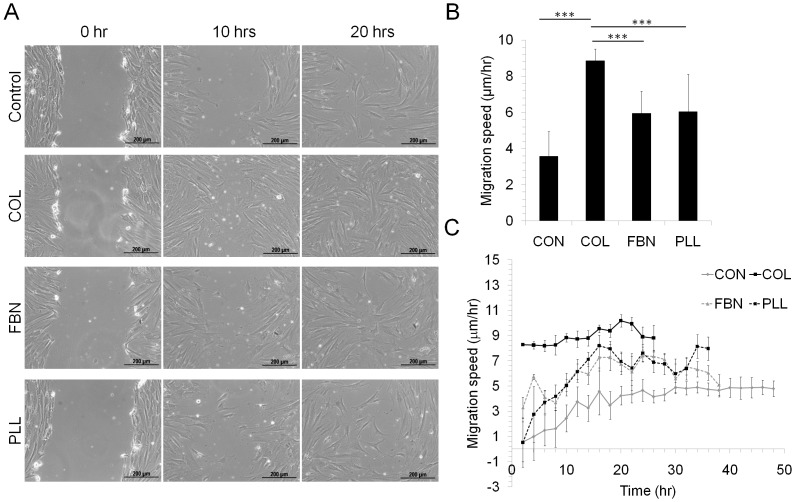
Mesenchymal stem cells (MSC) can differentiate into several cell types and are desirable candidates for cell therapy and tissue engineering. However, due to poor cell survival, proliferation and differentiation in the patient, the therapy outcomes have not been satisfactory. Although several studies have been done to understand the conditions that promote proliferation, differentiation and migration of MSC in vitro and in vivo, still there is no clear understanding on the effect of non-cellular bio molecules. Of the many factors that influence the cell behavior, the immediate cell microenvironment plays a major role. In this context, we studied the effect of extracellular matrix (ECM) proteins in controlling cell survival, proliferation, migration and directed MSC differentiation. We found that collagen promoted cell proliferation, cell survival under stress and promoted high cell adhesion to the cell culture surface. Increased osteogenic differentiation accompanied by high active RHOA (Ras homology gene family member A) levels was exhibited by MSC cultured on collagen. In conclusion, our study shows that collagen will be a suitable matrix for large scale production of MSC with high survival rate and to obtain high osteogenic differentiation for therapy.


Conflict of interest statement

Competing Interests: The authors have declared that no competing interests exist.

Figures

Fig 1
Fig 1. Proliferation and cell survival.
MSC were seeded in equal numbers (1000 cells/cm2) on tissue culture dishes which were left uncoated (CON) or coated with collagen (COL, 2ug/cm2), fibronectin (FBN (100ng/cm2) or Poly-l-lysine (PLL, 100ng/cm2) for 48–72 hours. (A) Doubling time was calculated by cell counting of MSC grown on different matrices. (B) Cell proliferation on different matrices were analysed by MTT assay. *p<0.05 represents cell proliferation significantly higher in cells grown on COL compared to CON, FBN and PLL surfaces. (C) MSC cultured on COL, FBN and PLL and TC surface (CON) was collected by trypsinization and stained with propidium iodide and the cell cycle profile was analysed flow cytometrically. Values are Mean±SD, n = 5–7 samples. (D) Equal numbers of MSC were seeded on TC (CON), COL, FBN and PLL surfaces and non-adherent cells were removed after 2hr or 12hr and the adherent cells were counted. Five different high power fields were counted microscopically for each sample. Values are Mean±SD, n = 3 samples (E) MSC were treated with H2O2 (400μm) for 2–3 hours under low serum conditions (0.1% FBS) and the percentage of cell death was analysed by counting the live and dead cells in each condition. *p<0.05 represents that cell death in cells grown on COL was significantly lower compared to other conditions. (F, G) MSC grown on different matrices were serum starved for 48 hours and mitosox superoxide indicator was added to cells for 30 minutes and mitosox red fluorescence was analysed by flow cytometry and the percentage positive cells were determined. (G) Representative flow cytometric plot showing mitosox fluorescence analysis and gating in control (i), COL (ii), FBN (iii), PLL(iv). Values are Mean±SD, n = 3 independent experiments. (H) Total RNA was extracted from 5 samples cultured on uncoated TC (CON), COL, FBN and PLL coated tissue culture dishes. Semi-quantitative real-time PCR was done to analyse the mRNA expression levels of IL6 and the values were normalized to GAPDH expression levels in the respective samples. *p<0.05 represents that IL6 levels were significantly higher in control (CON) compared to other conditions. Values are Mean±SD, n = 5 samples. *p<0.05, **p<0.005, ***p<0.0005
Fig 2
Fig 2. Actin cytoskeleton and cell-surface contact points of MSC.
(A) MSC seeded on uncoated surface (Control), COL, FBN and PLL matrices were stained with TRITC conjugated phalloidin to visualize F-actin (red) and nucleus was stained with DAPI (blue). (B, C) The cell-contact points of MSC with different substrates was analysed by total internal reflection fluorescence microscopy (TIRF) in cells stained with phalloidin-TRITC cultured on glass coverslips. Representative images are shown; the scale bars represent 20μm. EF- Epi fluorescence. (D) The expression levels of CD49e in MSC cultured on TC surface (CON), COL, FBN and PLL surfaces were analysed by flow cytometry. The mean fluorescence intensity (MFI) for each sample was calculated based on their respective isotype control. Values are Mean±SD, n = 5 samples. **p<0.005, ***p<0.0005.
Fig 3
Fig 3. Cell migration analysis.
MSC were seeded on different matrices (Control, COL, FBN, PLL) and cultured until confluence. The cells were serum starved for 24 hours to inhibit cell proliferation and a scratch was made in the confluent layer. (A) The cell migration was documented microscopically at regular time intervals (~2 hours) and the distance covered by the cells on each matrix was calculated and the average migration speed determined. (B) Average migration speed was calculated from three independent experiments and values are plotted. Values are Mean±SD, n = 3. (C) MSC migration on different matrices was determined by wound healing assay. MSC were seeded on control TC treated surface (CON), COL, FBN or PLL coated surface and the migration speed was analysed every 2 hours until the wound closed. Values are Mean+SEM, n = 3 independent experiments. ***p<0.0005.
Fig 4
Fig 4. Adipogenic and osteogenic differentiation.
(A) Total RNA was isolated from three MSC samples cultured on TC surface (CON) or COL, FBN or PLL coated surfaces and reverse transcribed. The mRNA expression levels of OCN and PPARG were analysed by real-time PCR and normalized to their respective GAPDH levels. Values are Mean±SE, n = 3 samples. MSC were isolated on uncoated TC surface and differentiated into either (B, C) adipocytes or (D, E) osteocytes on different matrices (Control, COL, FBN and PLL) for 21–35 days. (B, C) To detect adipogenic differentiation, the cells were stained with oil-red O and the positive cells were counted microscopically. (D, E) Osteogenic differentiation was determined by staining the cells with Alizarin Red and quantified by absorbance measurement at 562nm. Values are Mean±SD, n = 6–12. (F) Osteogenic differentiation during switching of cell culture surface. MSC were cultured for one week prior to induction of osteogenic differentiation on control TC treated surface (CON), COL, FBN or PLL. These cells were transferred to and differentiated into osteocytes either on COL, FBN or PLL surfaces and osteogenic differentiation was determined alizarin red staining. For example, COL-FBN means that the cells were cultured on COL and switched to FBN for osteogenic differentiation. Values are Mean+SD, n = 3 independent experiments.*p<0.05, **p<0.005, ***p<0.0005.
Fig 5
Fig 5. Active RHOA analysis and mitochondria distribution.
(A) The RHOA mRNA levels in MSC cultured on TC surface (CON) or COL, FBN, PLL surfaces were determined by real-time PCR analysis. RHOA expression levels were normalised to GAPDH expression levels. (B) Active GTP bound RHOA levels in cells cultured on TC surface (CON), COL, FBN and PLL matrix was determined by RHOA G-LISA activation assay. Values are Mean±SD, n = 3 samples. (C, D) MSC grown on uncoated (Control, CON), COL, FBN and PLL coated surfaces were stained with TMRE to visualize the distribution of active mitochondria in the cells. (C) The percentage of cells showing cytoplasmic or peri-nuclear distribution was calculated in each condition. (D) Representative microscopic images are shown, blue arrow points to peri-nuclear staining and white arrow points to cytoplasmic staining in each condition. Values are Mean±SD, n = 6–15 (3 samples). *p<0.05, **p<0.005, ***p<0.0005.

Similar articles

Cited by

References

    1. Caplan AI. Adult mesenchymal stem cells for tissue engineering versus regenerative medicine. J Cell Physiol. 2007;213(2):341–7. Epub 2007/07/11. 10.1002/jcp.21200 . - DOI - PubMed
    1. Reyes M, Dudek A, Jahagirdar B, Koodie L, Marker PH, Verfaillie CM. Origin of endothelial progenitors in human postnatal bone marrow. J Clin Invest. 2002;109(3):337–46. Epub 2002/02/06. 10.1172/JCI14327 - DOI - PMC - PubMed
    1. Sanchez-Ramos J, Song S, Cardozo-Pelaez F, Hazzi C, Stedeford T, Willing A, et al. Adult bone marrow stromal cells differentiate into neural cells in vitro. Exp Neurol. 2000;164(2):247–56. Epub 2000/08/01. 10.1006/exnr.2000.7389 S0014-4886(00)97389-8 [pii]. . - DOI - PubMed
    1. Toma C, Pittenger MF, Cahill KS, Byrne BJ, Kessler PD. Human mesenchymal stem cells differentiate to a cardiomyocyte phenotype in the adult murine heart. Circulation. 2002;105(1):93–8. Epub 2002/01/05. . - PubMed
    1. Badylak SF, Freytes DO, Gilbert TW. Extracellular matrix as a biological scaffold material: Structure and function. Acta Biomaterialia. 2009;5(1):1–13. 10.1016/j.actbio.2008.09.013 ISI:000261922400001. - DOI - PubMed

Publication types

MeSH terms