. 2016 Mar;63(3):799-812.
doi: 10.1002/hep.28389. Epub 2016 Jan 21.

NKp46(+) natural killer cells attenuate metabolism-induced hepatic fibrosis by regulating macrophage activation in mice

Affiliations

NKp46(+) natural killer cells attenuate metabolism-induced hepatic fibrosis by regulating macrophage activation in mice

Annie-Carole Tosello-Trampont et al. Hepatology. 2016 Mar.

Abstract

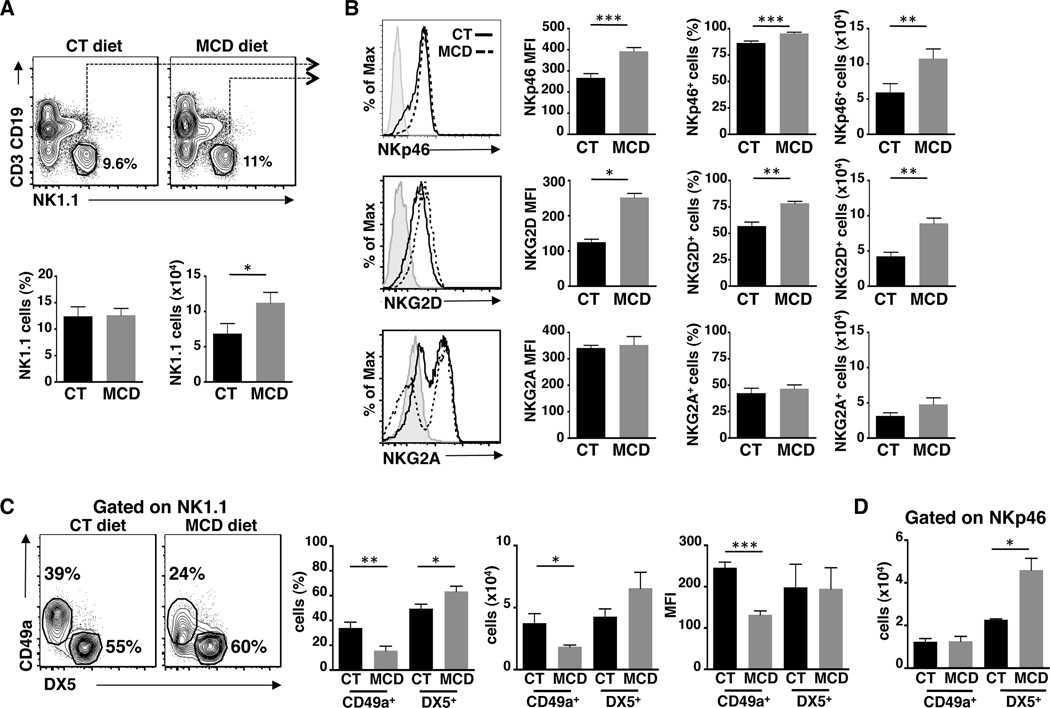
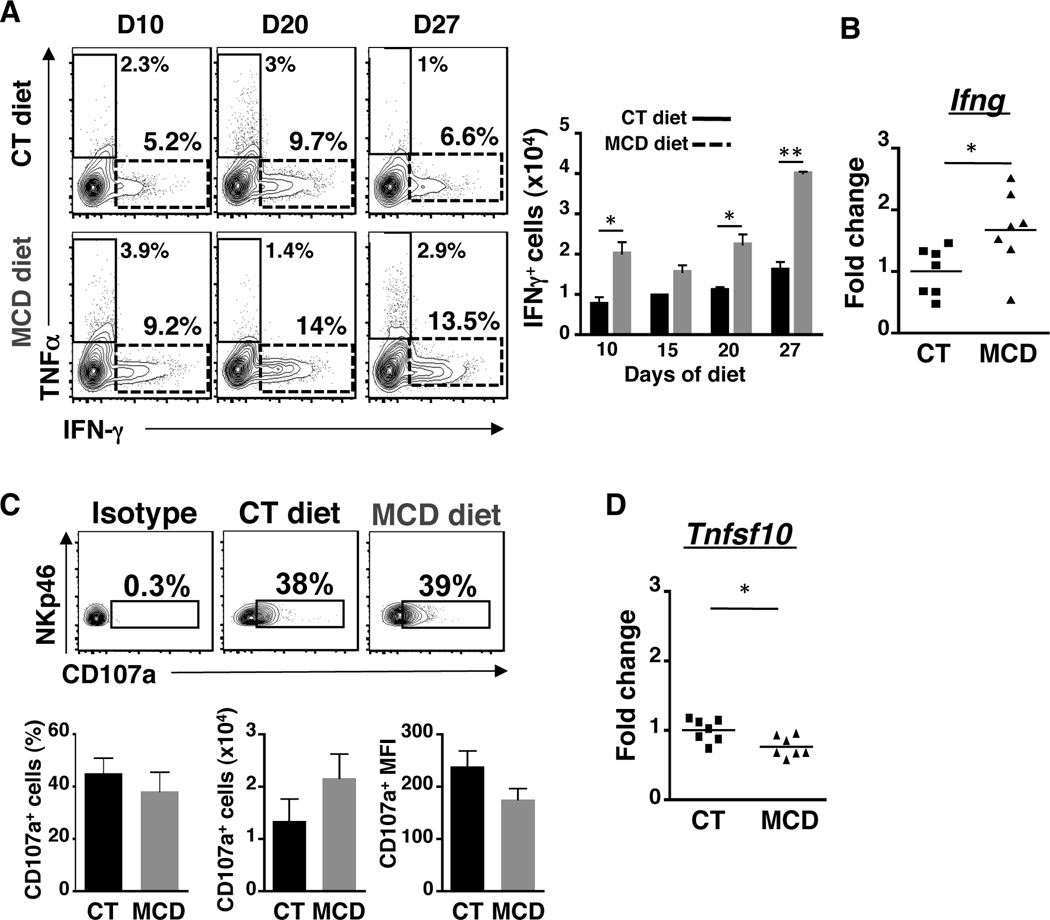
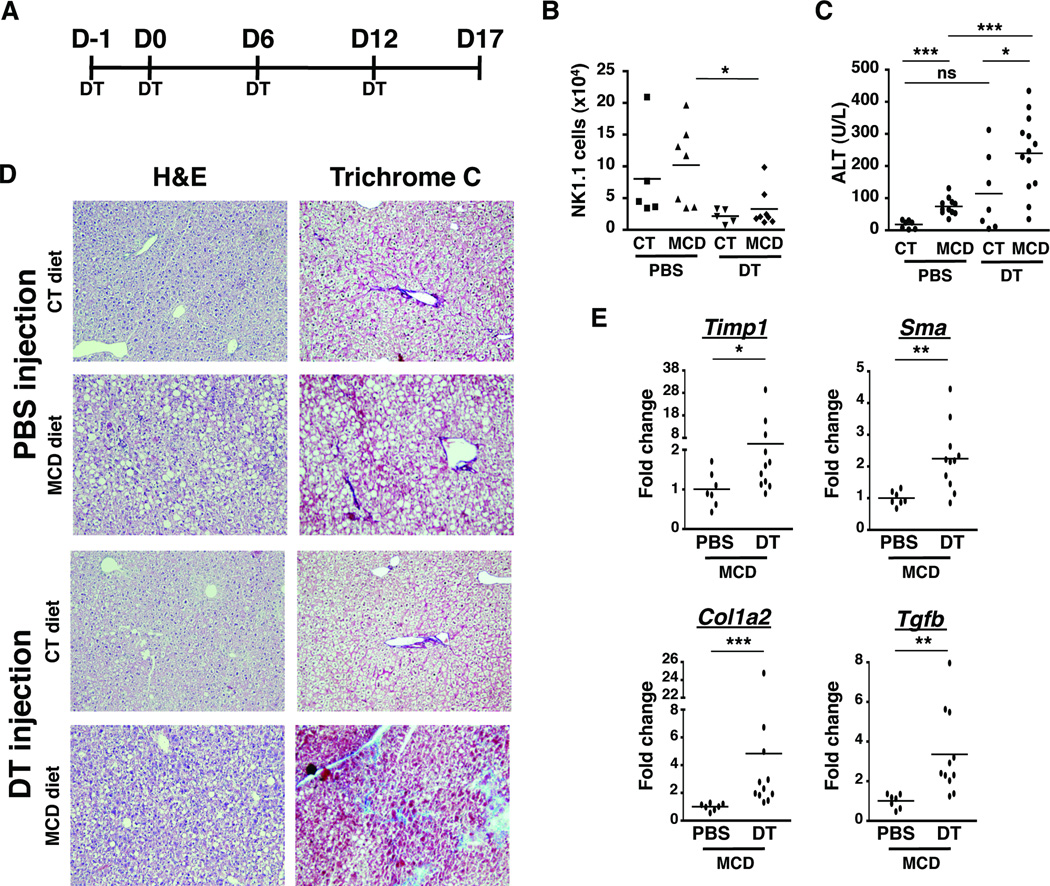
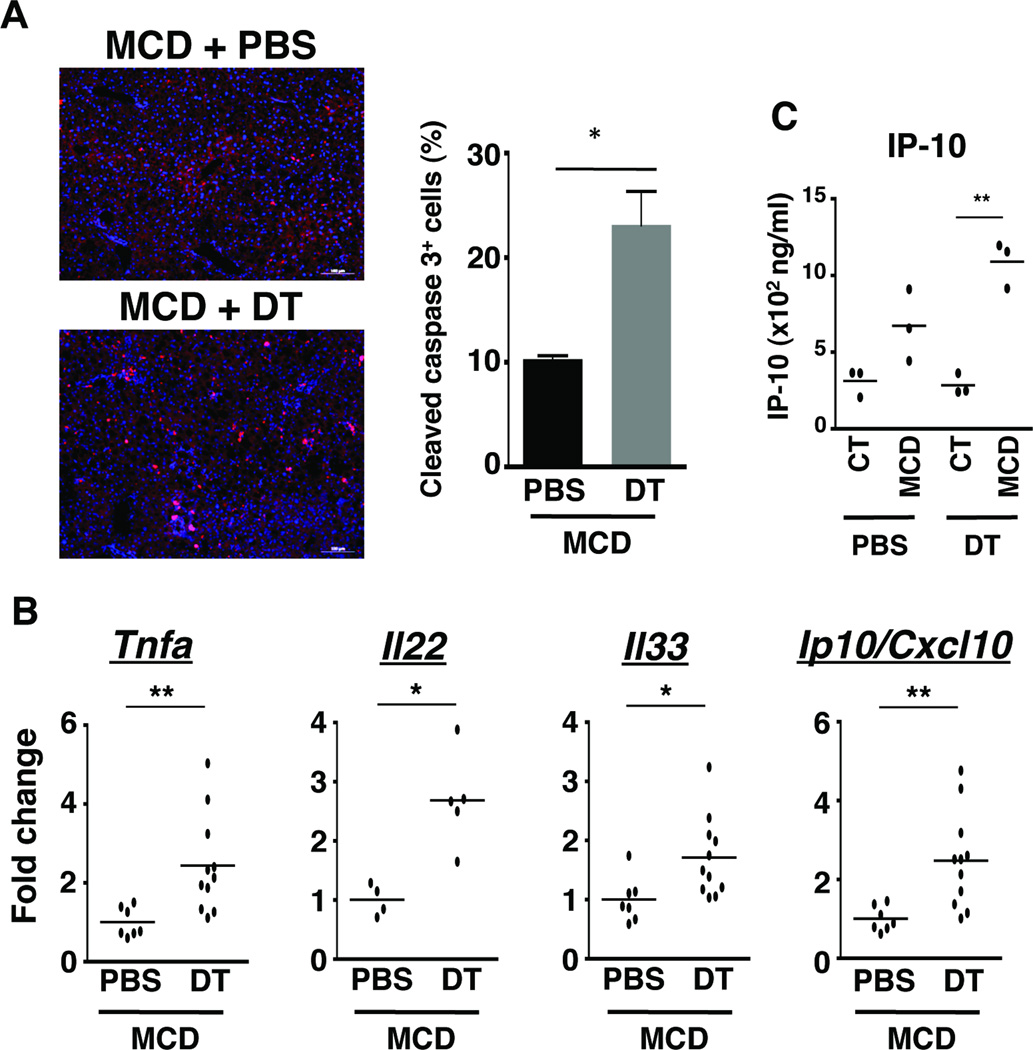
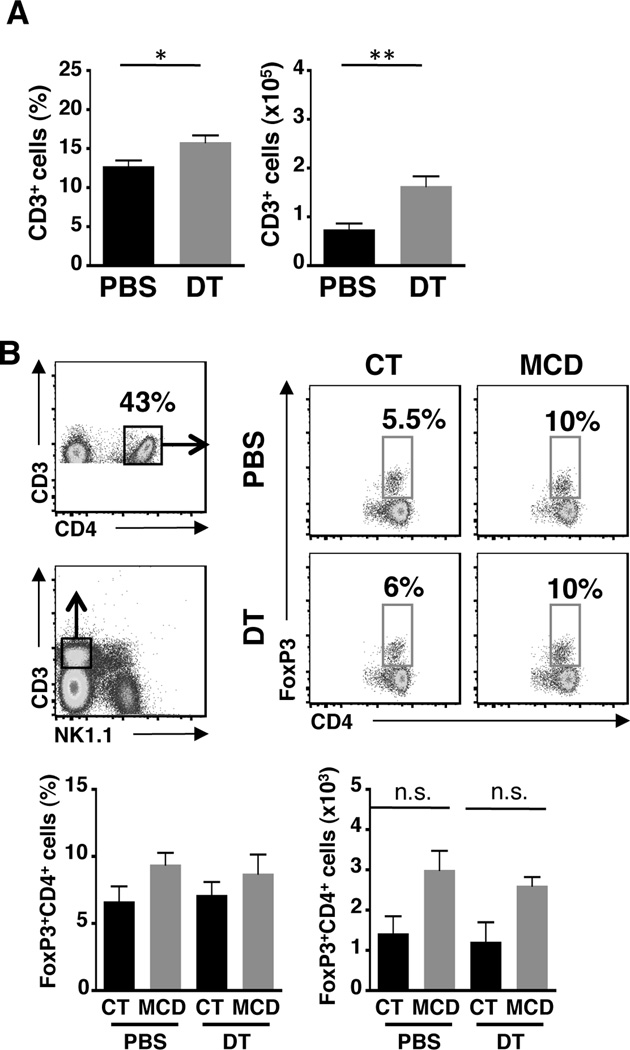
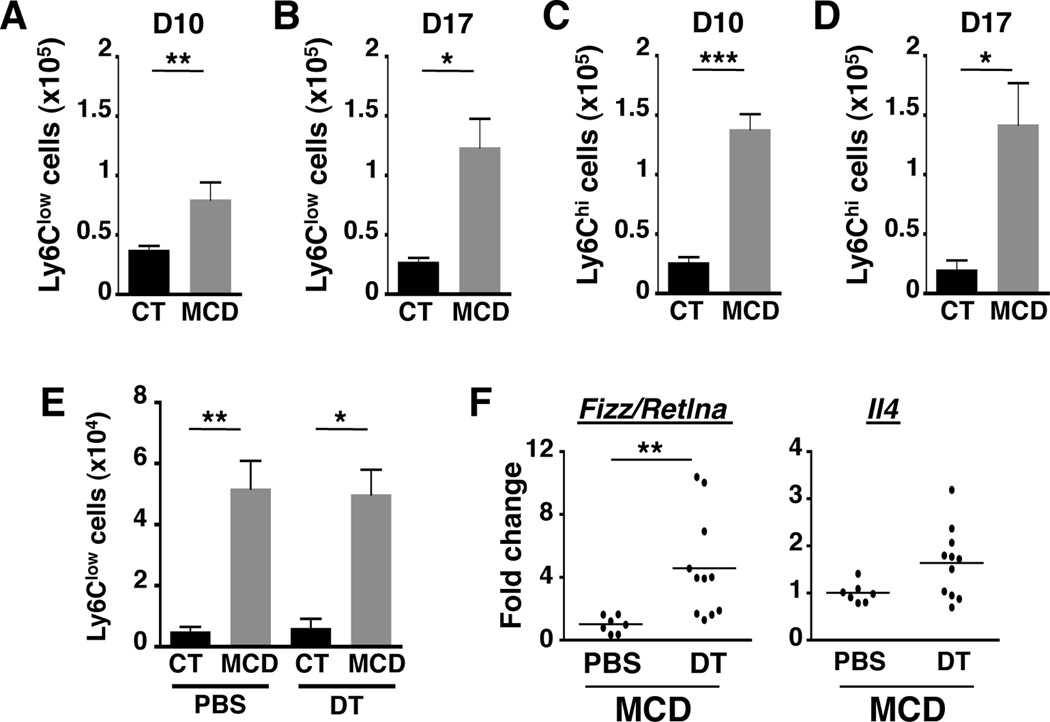
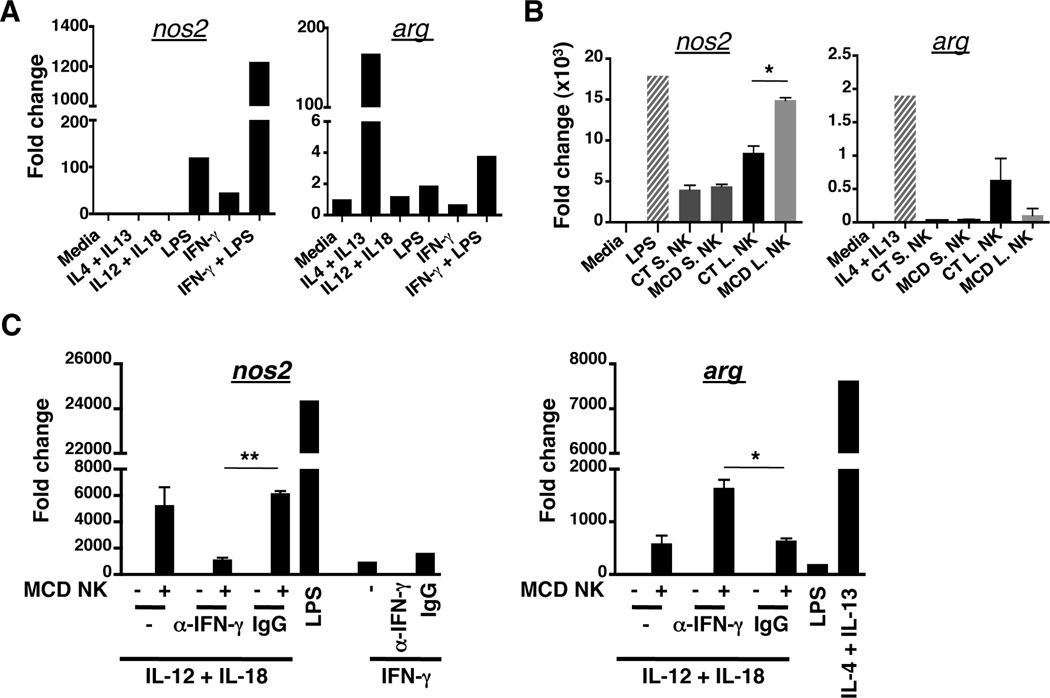
Nonalcoholic steatohepatitis (NASH) affects 3%-5% of the U.S. population, having severe clinical complications to the development of fibrosis and end-stage liver diseases, such as cirrhosis and hepatocellular carcinoma. A critical cause of NASH is chronic systemic inflammation promoted by innate immune cells, such as liver macrophages (Mϕ) and natural killer (NK) cells. However, little is known about how the crosstalk between Mϕ and NK cells contributes to regulate NASH progression to fibrosis. In this report, we demonstrate that NKp46(+) cells play an important role in preventing NASH progression to fibrosis by regulating M1/M2 polarization of liver Mϕ. Using a murine model of NASH, we demonstrate that DX5(+)NKp46(+) NK cells are increased during disease and play a role in polarizing Mϕ toward M1-like phenotypes. This NK's immunoregulatory function depends on the production of interferon-gamma (IFN-γ), but not by granzyme-mediated cytolytic activity. Notably, depletion of NKp46(+) cells promotes the development of fibrosis with increased expression of profibrogenic genes as well as skewed M2 Mϕ phenotypes in hepatic tissues.

Conclusions: NK cell-derived IFN-γ may be essential for maintaining a balanced inflammatory environment that promotes tissue integrity and limiting NASH progression to fibrosis.


Figures

Figure 1
Figure 1. Increased activation of NK1.1 cells during NASH development
(A) FACS plots, frequency and numbers of NK1.1+ cells within CD45+CD3CD19 liver leukocytes isolated from C57BL/6 mice fed for 17 days of control (CT) or methionine and choline deficient (MCD) diet (total of n=4–5 mice per diet). (B) The intensity of expression (MFI), frequency and cells numbers of NK cells expressing of NK activating receptors (NKp46 and NKG2D) and NK inhibitory receptor (NKG2A/CD94) within NK1.1+CD3CD19CD45+ liver leukocytes (total of n=4–8 mice per diet). (C) FACS plots, frequency and numbers of liver tissue resident/ILC1 (CD49a+), and conventional (DX5+) NK cells within CD3CD19NK1.1+ cells. (D) Expression of DX5 within NKp46+CD19CD3CD45+ liver leukocytes. Black bars, CT diet; gray bars, MCD diet. *p<0.05, **p<0.01 and ***p<0.001 as determined by two-tailed t-test.
Figure 2
Figure 2. Increased IFN-γ production by NKp46+ NK cells in NASH
(A) FACS plots of NKp46+ NK cells expressing TNF-α or IFN-γ within CD45+CD3CD19 liver leukocytes isolated from mice fed for 10, 20 and 27 days of CT or MCD diet (total of n=4–5 mice per diet). Histogram showed the number of NKp46+ cells expressing IFN-γ from 0 to 27 days. (B) Gene expression of Ifng (IFN-γ) in DX5+ cells from mice fed with CT or MCD diet for 17 days. (C) FACS plots, frequency and number of NKp46+ cells expressing CD107a/LAMP-1 (D) Gene expression of Tnfsf10 (Trail) in DX5+ cells from mice fed with CT or MCD diet for 17 days. Black bars, CT diet; gray bars, MCD diet. *p<0.05, **p<0.01 and ***p<0.001 as determined by two-tailed t-test.
Figure 3
Figure 3. Depletion of NKp46+ cells exacerbates NASH to hepatic fibrosis progression
(A) NDE transgenic mice fed with CT or MCD diet for 17 days were treated either with 4 injections of PBS or Diphtheria Toxin (DT). (B) The depletion of NK1.1 cells was assessed by flow cytometry and the number of hepatic NK cells from CT or MCD diet fed-mice treated with PBS or DT was quantified. (C) Serum alanine aminotransferase (ALT) was measured. *p<0.05, **p<0.01 and ***p<0.001 as determined by two-tailed t-test. (D) H&E-stained and Trichrome C-stained tissue sections were examined under bright field microscope at 200X magnification. (E) Expression of fibrotic markers (Timp-1, Sma, Col1a2, and Tgf-b) was determined by real-time PCR in whole liver samples from MCD diet-fed mice injected with PBS or DT. The RNA level is expressed as fold induction compared to PBS-treated mice. *p<0.05, **p<0.01 and ***p<0.001 as determined by Mann Whitney test.
Figure 4
Figure 4. The loss of NKp46+ cells exacerbates cell death and inflammation in NASH
(A) Liver sections from mice treated with PBS or DT and fed with MCD diet for 17 days were stained with DAPI (nucleus, blue) and with antibody against cleaved caspase 3 (red). Graph shows the percentage of cleaved caspase 3-positive cells (apoptotic cells). *p<0.05 as determined by two-tailed t-test. (B) Hepatic expression of transcripts of Tnfa, Il22, IL33 and Ip10/Cxcl10 were determined by real time PCR from liver samples of MCD diet-fed mice treated with PBS or DT. The RNA level is expressed as fold increase compared with control diet. *p<0.05, and **p<0.01 as determined by Mann Whitney test. (C) IP-10/CXCL10 from whole liver cell lysates of CT diet- and MCD diet-fed mice treated with PBS or DT. *p<0.05 as determined by two-tailed t-test.
Figure 5
Figure 5. Tregs are unaffected by the loss of NKp46+ NK cells
(A) Frequency and cell number of T cells in the liver of PBS or DT-treated mice fed with MCD diet for 17 days. (B) FACS plots show the gating strategy to identify Tregs (CD3+CD4+FoxP3+ cells). Graphs indicate frequency and cell number of hepatic Tregs from CT or MCD diet-fed mice treated with PBS or DT. *p<0.05 and ***p<0.001 as determined by two-tailed t-test.
Figure 6
Figure 6. Increase in CD11b+F4/80lowLy6Clow
(A, B) Cell number of Ly6ClowCD11b+ and (C, D) Ly6ChiCD11b+ Mϕ in the liver of CT or MCD-fed mice for 10 and 17 days. (E) Number of Ly6ClowCD11b+F4/80low liver Mϕ from mice fed with CT and MCD diet for 17 days and treated with PBS or DT. *p<0.05 and **p<0.01 as determined by two-tailed t-test. (F) Transcripts of M2 Mϕ markers (retnla, IL-4) were quantified by qPCR from whole liver samples. RNA level is presented as fold-induction compared to PBS-treated mice fed with MCD diet for 17 days. **p<0.01 as determined by Mann Whitney test.
Figure 7
Figure 7. NASH-conditioned NK cells polarize Mϕ toward an M1 phenotype
(A) RAW264 Mϕ were cultured in the presence of various cytokines including IFN-γ alone or IFN-γ/LPS for 2hrs. nos2 (M1 marker) and arg (M2 marker) gene expression were analyzed by qPCR. (B) NK cells from liver (L) and spleen (S) of D17 MCD and CT diet-fed mice were co-cultured with RAW264 cells at a 1 to 1 ratio for 18hrs. After removing NK cells from the culture, nos2 and arg gene expression were analyzed in macrophages by qPCR. (C) Liver NK cells from MCD fed- mice were co-cultured with RAW264 cells at a 1 to 1 ratio for 18hrs in presence or absence of IFN-γ blocking antibody and IgG control antibody. After removing NK cells from culture, nos2 and arg gene expression were analyzed in macrophages by qPCR. *p<0.05, and **p<0.01 as determined by two-tailed t-test.

References

    1. Wree A, Broderick L, Canbay A, et al. From NAFLD to NASH to cirrhosis-new insights into disease mechanisms. Nat Rev Gastroenterol Hepatol. 2013;10:627–636. - PubMed
    1. Caldwell S, Hoehn KL, Hahn YS. The strange and critical intersection of hepatitis C and lipoprotein metabolism: "C-zing" the oil. Hepatology. 2013;57:1684–1687. - PMC - PubMed
    1. De Minicis S, Day C, Svegliati-Baroni G. From NAFLD to NASH and HCC: pathogenetic mechanisms and therapeutic insights. Curr Pharm Des. 2013;19:5239–5249. - PubMed
    1. Meli R, Mattace Raso G, Calignano A. Role of innate immune response in non-alcoholic Fatty liver disease: metabolic complications and therapeutic tools. Front Immunol. 2014;5:177. - PMC - PubMed
    1. Tosello-Trampont AC, Landes SG, Nguyen V, et al. Kuppfer cells trigger nonalcoholic steatohepatitis development in diet-induced mouse model through tumor necrosis factor-alpha production. J Biol Chem. 2012;287:40161–40172. - PMC - PubMed

Publication types

MeSH terms