. 2016 Jun;26(6):763-78.
doi: 10.1002/hipo.22557. Epub 2016 Feb 8.

Activation of local inhibitory circuits in the dentate gyrus by adult-born neurons

Affiliations

Activation of local inhibitory circuits in the dentate gyrus by adult-born neurons

Liam J Drew et al. Hippocampus. 2016 Jun.

Abstract

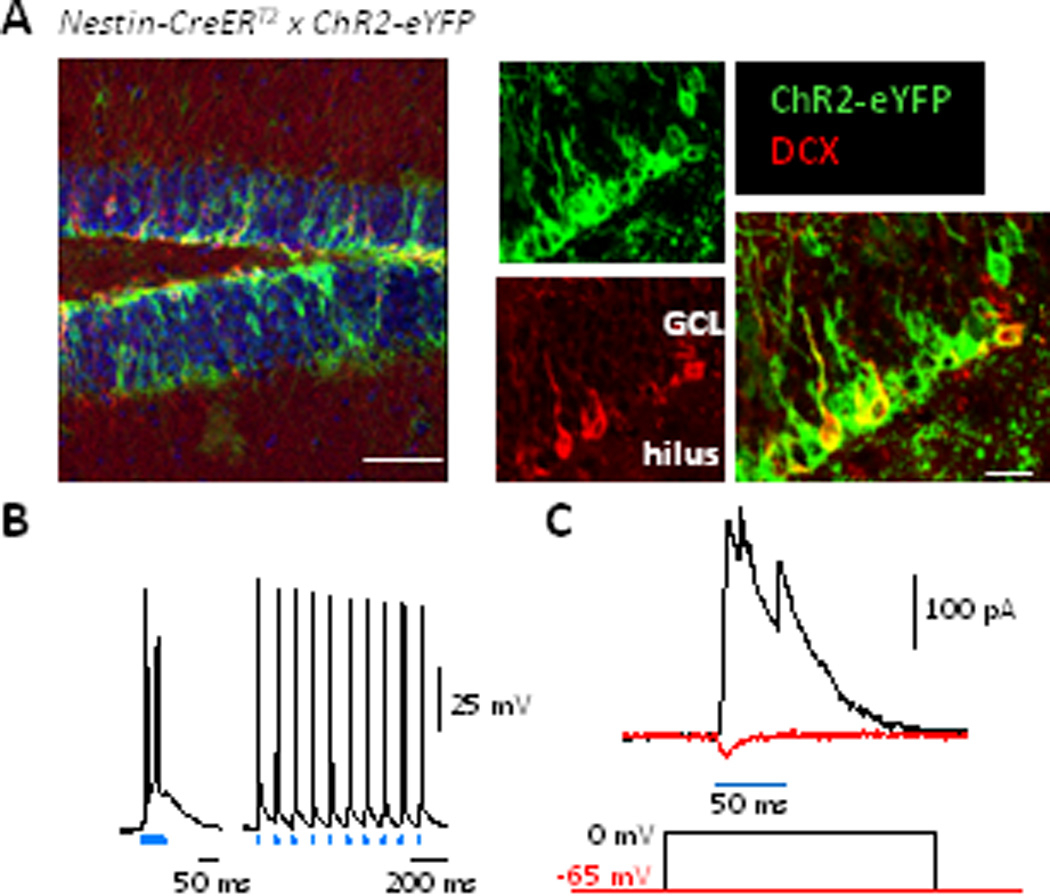
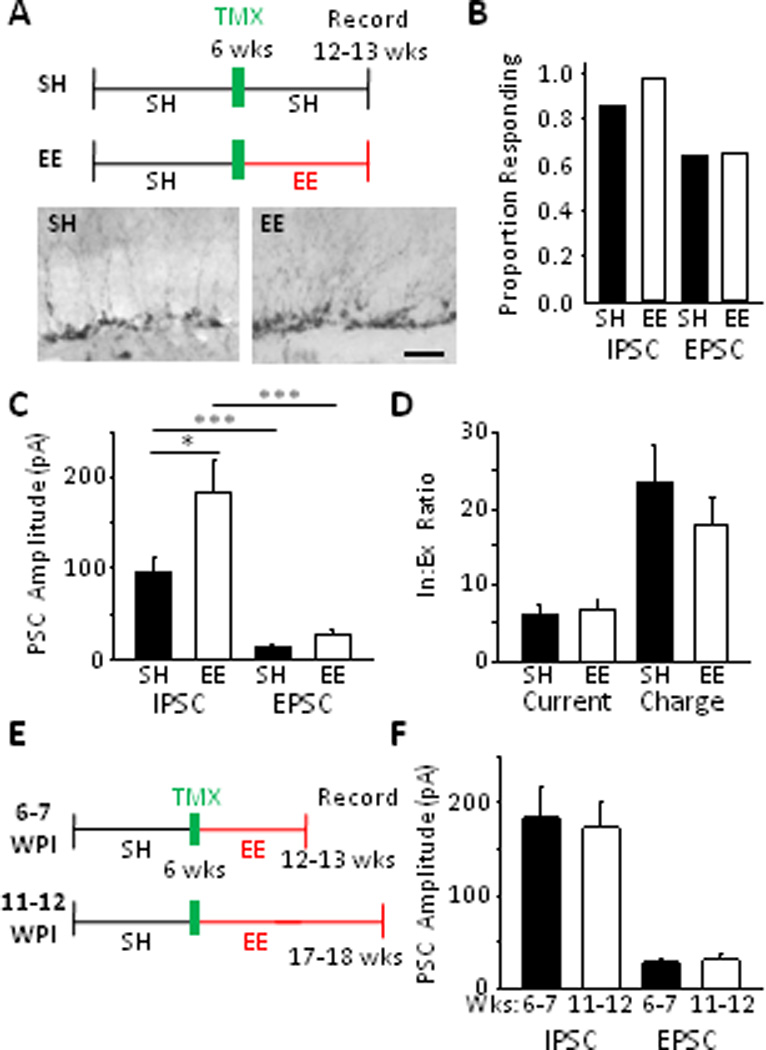
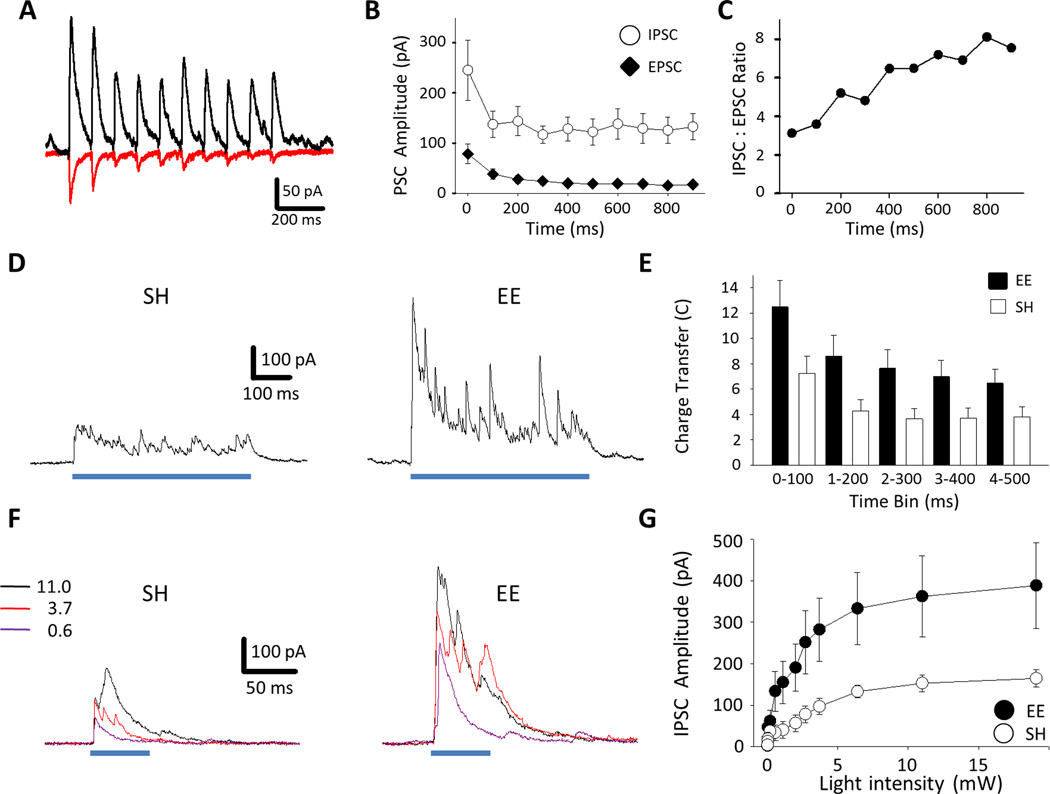
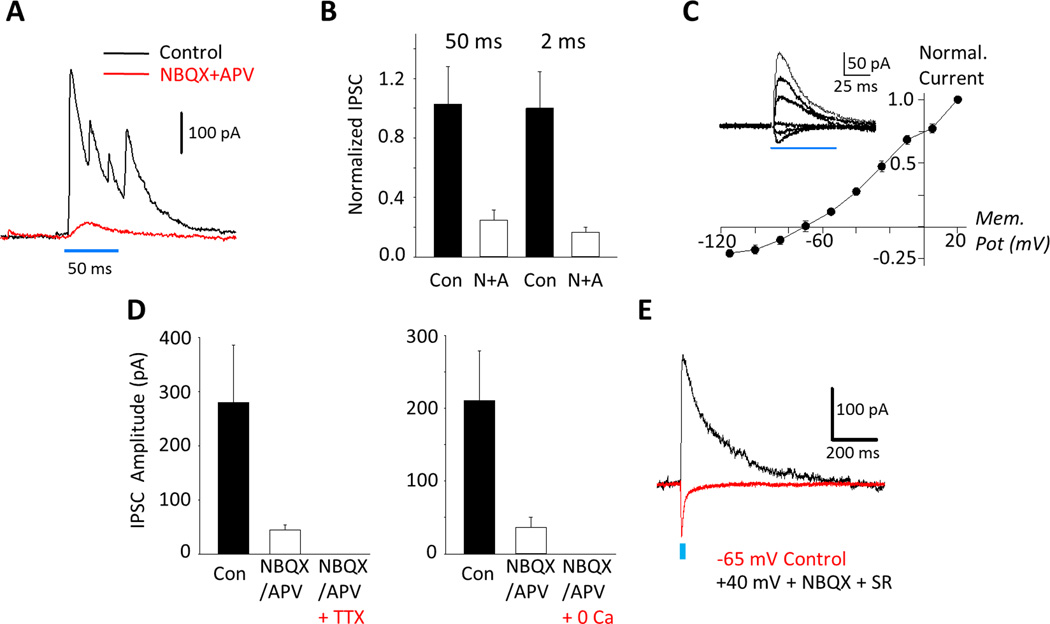
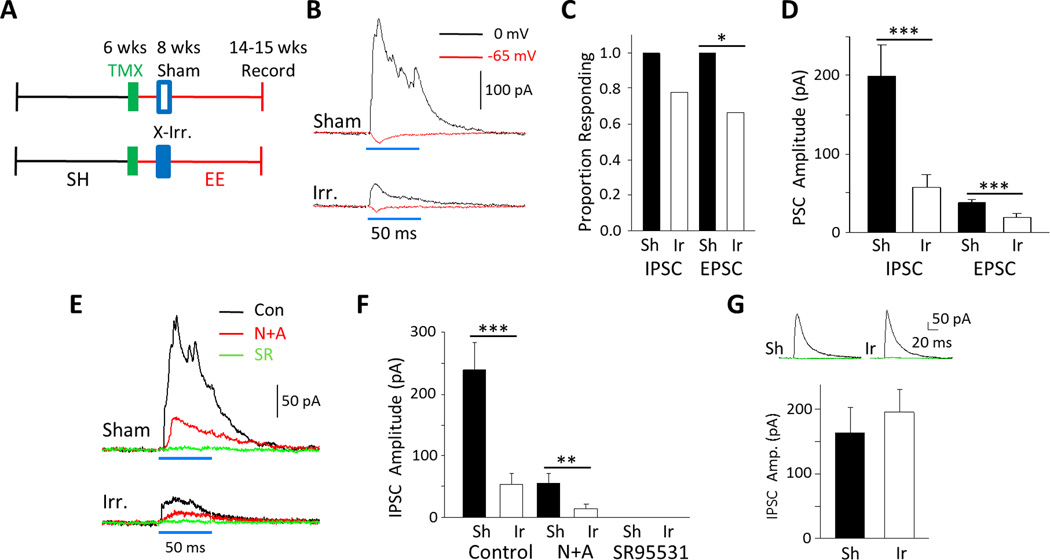
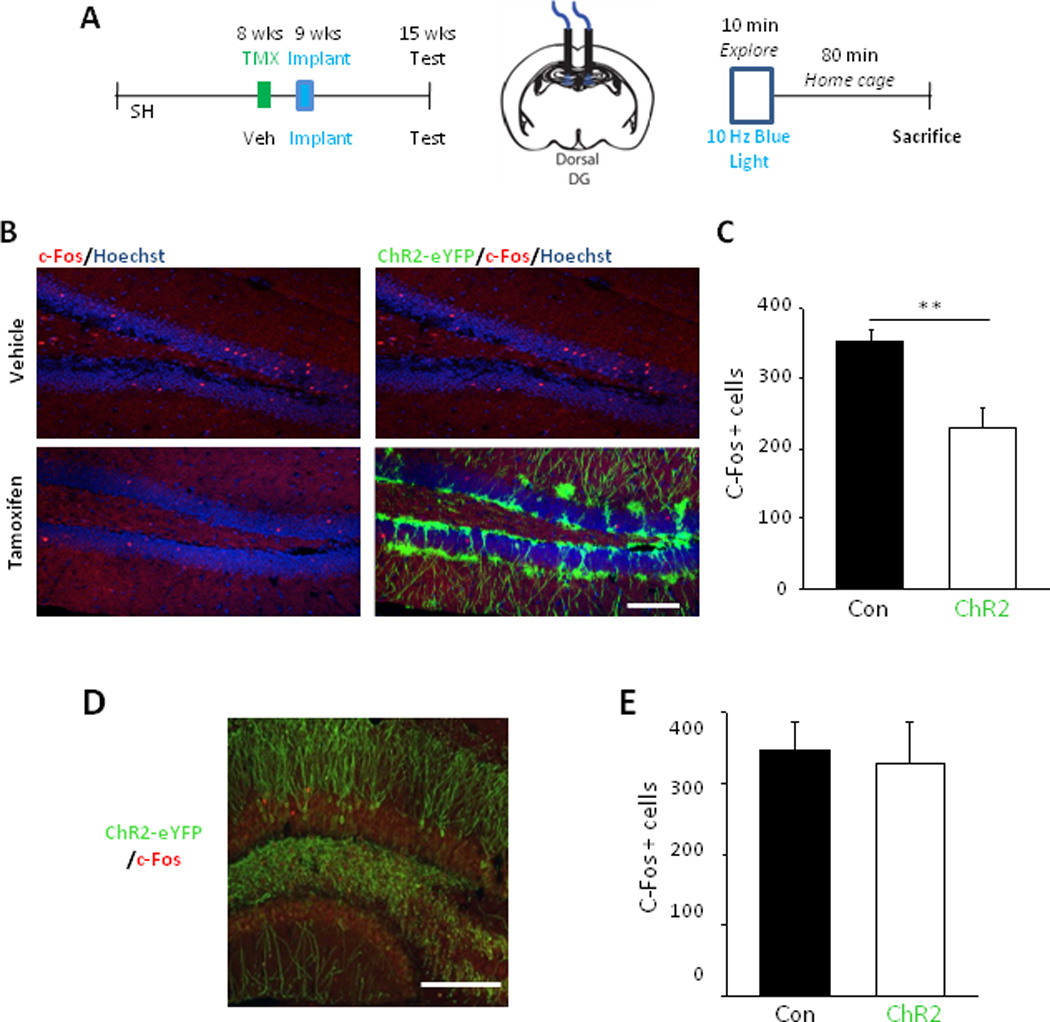
Robust incorporation of new principal cells into pre-existing circuitry in the adult mammalian brain is unique to the hippocampal dentate gyrus (DG). We asked if adult-born granule cells (GCs) might act to regulate processing within the DG by modulating the substantially more abundant mature GCs. Optogenetic stimulation of a cohort of young adult-born GCs (0 to 7 weeks post-mitosis) revealed that these cells activate local GABAergic interneurons to evoke strong inhibitory input to mature GCs. Natural manipulation of neurogenesis by aging-to decrease it-and housing in an enriched environment-to increase it-strongly affected the levels of inhibition. We also demonstrated that elevating activity in adult-born GCs in awake behaving animals reduced the overall number of mature GCs activated by exploration. These data suggest that inhibitory modulation of mature GCs may be an important function of adult-born hippocampal neurons. © 2015 Wiley Periodicals, Inc.

Keywords: adult neurogenesis; dentate gyrus; granule cells; hippocampus; inhibition; interneurons; optogenetics.


Figures

Figure 1
Figure 1
ChR2 expression in adult-born GCs and optically evoked synaptic input to mature GCs. A: Left, Image of the DG showing expression of ChR2-eYFP (green) and DCX (red) in a mouse 7 weeks after TMX-induced recombination. Scale bar: 100 µm. Middle, eYFP and DCX immunoreactivity at higher magnification. Right, co-expression of these proteins in young neurons. DCX expression terminates ≈3 weeks post-mitosis so older abGCs show only as green. Scale bar: 15 µm. B: Left, firing in a ChR2-eYFP-expressing neuron in response to a 50 ms light pulse. Right, Response to 2 ms pulses at 10 Hz. C: Bottom, voltage-clamp protocol for isolating GABAergic and glutamatergic currents each recorded at the reversal potential of the other. Top, example IPSC (black) and EPSC (red).
Figure 2
Figure 2
Activation of adult-born GCs evoked strong synaptic input to mature GCs that is augmented by environmental enrichment and is saturated by 6-7 weeks post-mitosis. A: Top, Experimental timeline. Bottom, typical images of DG DCX immunoreactivity in mice from SH (left) and EE (right). Scale bar: 50 µm. B: Similar proportions of neurons from SH and EE mice displayed IPSCs (P = 0.15) and EPSCs (P = 1.0, Fisher’s exact test). C: Mature GCs from EE mice had larger IPSCs than those from SH (EE: 184.4 ± 33.0 pA vs. SH: 94.9 ± 15.8 pA; Mann-Whitney Ranked Sum, P = 0.036). There was a trend for larger EPSCs in EE animals (EE: 27.7 ± 4.7 pA vs SH: 13.6 ± 2.3 pA; Mann-Whitney Ranked Sum, P = 0.068). D: EE did not impact the dominance of inhibition. I:E ratios for peak current (EE: 6.7 ± 1.2 vs SH: 6.2 ± 1.0; t-test, P = 0.74) and for charge transfer (EE: 17.7 ± 3.6 vs SH: 23.3 ± 4.9; t-test, P = 0.81). E: Experimental timeline; optically evoked synaptic input was recorded either 6-7 or 11-12 weeks post-induction (WPI). F: There was no significant difference in the amplitudes of either IPSCs or EPSCs recorded at the respective time points. (IPSCs: 6-7 wks (n =40): 184.4 ± 33.0 pA vs 11-12 wks (n = 15): 172.9 ± 27.1 pA; Mann-Whitney Ranked Sum, P = 0.58. EPSCs: 6-7 wks (n = 40): 27.7 ± 4.7 pA vs 11-12 wks (n = 11): 30.3 ± 6.7 pA; Mann-Whitney Ranked Sum, P = 0.47.)
Figure 3
Figure 3
Dynamic properties of optically evoked synaptic currents. A: Example traces of IPSCs (black) and EPSCs (red) evoked by 10 Hz trains of 2 ms light pulses. B: During 10 Hz trains both IPSCs and EPSCs depressed with repeated stimulation; the ratio of the EPSCs elicited by the 10th and 1st stimuli was 0.22, showing greater depression than IPSCs (mean 10th:1st: 0.54, n = 10). C: The ratio of the mean IPSC:EPSC amplitude progressively increased during 10 Hz stimulation. D: Example traces of optically evoked IPSCs at different light intensities (in mW, as indicated.) Left, SH mouse; Right, EE animal. E: IPSCs increase with light intensity in both EE (n = 5) and SH (n = 6; 2-way, RM ANOVA: Effect of light: F(11, 99) = 21.05, P < 0.001; effect of housing: F(1, 9) = 16.43, P = 0.032; interaction: F(11, 99) = 4.05, P < 0.001). F: Example traces of IPSCs evoked by 500 ms light pulses from an SH mouse (left) and an EE mouse (right). G: Time course of synaptic input over sustained illumination in EE and SH neurons. There was a significant effect of time but housing alone did not reach significance (2-way, RM ANOVA: effect of time interval, F(4, 84) = 6.48, P < 0.001; effect of housing, F(1, 21) = 2.25, P = 0.15; interaction, F(4, 84) = 5.13, P < 0.001).
Figure 4
Figure 4
Evidence for direct neurotransmission from adult-born GCs to mature GCs. A: Example traces of optically evoked IPSCs, before (black) and after (red) application of glutamate antagonists (10 µM NBQX, 100 µM DL-APV). B: NBQX/APV reduced IPSC amplitudes evoked by 50 ms stimuli by 75.1 ± 6.6 % (Control: 199.6 ± 48.8 pA, NBQX/APV: 38.2 ± 13.0 pA, n = 14; Paired t-test, P < 0.001) and by 2 ms stimuli (in a distinct cohort of cells) by 76.0 ± 6.4% (Control mean: 245.3 ± 60.2 pA, residual mean: 40.7 ± 8.2 pA, n = 10; Wilcoxon Signed Rank Test, P = 0.002). C: Current-voltage relationship for residual currents (after NBQX+APV application, n = 8, currents normalized to peak amplitude at +20mV). Inset, IPSCs evoked at −115, −85, −55, −25, +5 and +20 mV holding-potentials. D: Residual IPSCs were abolished by 1 µM TTX (left, n = 5) and by nominal 0 mM extracellular calcium (right, n =5). E: Representative trace of a an NMDA receptor-mediated current recorded at +40 mV (black) following blockade of AMPA and GABAA receptors, 5/5 cells tested showed such currents (mean amplitude: 190.3 ± 28.1 pA). For comparison, an AMPA receptor-mediated current at −65 mV in control conditions is shown. The 2 forms of glutamatergic input did not correlate in amplitude (Spearman Rank Correlation, r2 = 0.6, P = 0.35, n = 5).
Figure 5
Figure 5
Effect of hippocampal X-irradiation on optically evoked responses. A: Experimental timeline. B: Example traces of an IPSC (black) and an EPSC (red) from a sham-treated mouse (top) and an irradiated mouse (bottom). C: Fewer mature GCs displayed synaptic currents following irradiation and this was statistically significant for EPSCs (Sham: 1.0 (16/16) vs X-ray: 0.67 (12/18, Fisher’s Exact Test, P = 0.020) but not IPSCs (Sham: 1.0 (16/16) vs X-ray: 0.78 (14/18, P = 0.11). D: The average synaptic current for both inhibition and excitation was significantly reduced by irradiation: IPSCs by 71.3% (Sham: 198.7 ± 39.7 pA, n = 16, vs X-ray: 57.0 ± 16.7 pA, n = 18; Mann-Whitney Ranked Sum, P < 0.001) and EPSCs by 53.3% (Sham: 37.5 ± 4.8 pA, n = 16, vs X-ray: 17.5 ± 6.0 pA, n = 18; Mann-Whitney Ranked Sum, P < 0.001). E: Example traces of IPSCs in control ACSF (black), plus NBQX/APV (red) and NBQX/APV/SR 95531 (green) from a sham (top) and an X-irradiated mouse (bottom). F: IPSCs in control conditions were larger in sham than in X-irradiated animals (Sham: 227.3 ± 43.0, n = 11, vs X-ray: 53.0 ± 18.6 pA, n = 17; Mann-Whitney Ranked Sum, P < 0.001). Residual IPSCs evoked in APV/NBQX are 75.9% smaller in irradiated animals than in shams (Sham: 60.6 ± 15.8, n = 11, vs X-ray: 14.6 ± 6.2 pA, n = 17; Mann-Whitney Ranked Sum, P < 0.001). All currents were abolished by SR 95531. G: Electrically evoked IPSCs did not significantly differ between groups (Sham: 163.0 ± 40.6 pA, n = 14, vs X-ray 195.0 ± 36.1 pA, n = 17; Mann-Whitney Ranked Sum, P = 0.46). Inset, example traces in ACSF (black) and in 10 µm SR 95531 (green).
Figure 6
Figure 6
Stimulation of adult-born GCs in vivo reduces the number of mature GCs activated during a novel experience. A: Overall timeline of experiment (left), diagram showing fiber optics positioning (center) and timeline of final exploration session (right). B: Example images of c-Fos expression in the DG just ventral to the fiber optic implantation site from, top, a vehicle-treated animal and, bottom, a TMX-treated animal. Images on the right indicate presence or absence of ChR2-eYFP expression. Scale bar = 100 µm. C: ChR2-induction reduced the number of GCs immunopositive for c-Fos (number = total of 12 sections spanning the entire dorsoventral axis in one hemisphere). Control: 352.4 ± 17.6, n = 7, ChR2: 229.0 ± 28.9, n = 5; t-test, P = 0.003. D: Example image of ChR2-eYFP expression (green) in an Arc-ChR2 mouse with immunohistochemical labeling of c-Fos (red). E. Quantification of the total number c-Fos expressing cells per hemisphere showed that activation of ChR2 expressing neurons in Arc-ChR2 mice did not significantly change total number of active DG neurons. (Control: 347.8 ± 38.5 neurons, n = 6 mice, ChR2: 328.4 ± 57.0, n = 4; t-test, P = 0.78)

References

    1. Bartos M, Vida I, Jonas P. Synaptic mechanisms of synchronized gamma oscillations in inhibitory interneuron networks. Nat Rev Neurosci. 2007;8:45–56. - PubMed
    1. Beltrán JQ, Gutiérrez R. Co-release of glutamate and GABA from single, identified mossy fiber giant boutons. J Physiol. 2012;590:4789–4800. - PMC - PubMed
    1. Bruel-Jungerman E, Laroche S, Rampon C. New neurons in the dentate gyrus are involved in the expression of enhanced long-term memory following environmental enrichment. Eur J Neurosci. 2005;21:513–521. - PubMed
    1. Buhl EH, Szilágyi T, Halasy K, Somogyi P. Physiological properties of anatomically identified basket and bistratified cells in the CA1 area of the rat hippocampus in vitro. Hippocampus. 1996;6:294–305. - PubMed
    1. Burghardt NS, Park EH, Hen R, Fenton AA. Adult-born hippocampal neurons promote cognitive flexibility in mice. Hippocampus. 2012;22:1795–1808. - PMC - PubMed

Publication types

MeSH terms

Substances