. 2016 Feb 12;291(7):3658-67.
doi: 10.1074/jbc.M115.706523. Epub 2015 Dec 9.

Phosphatidylethanolamine Is a Key Regulator of Membrane Fluidity in Eukaryotic Cells

Affiliations

Phosphatidylethanolamine Is a Key Regulator of Membrane Fluidity in Eukaryotic Cells

Rosie Dawaliby et al. J Biol Chem. .

Abstract

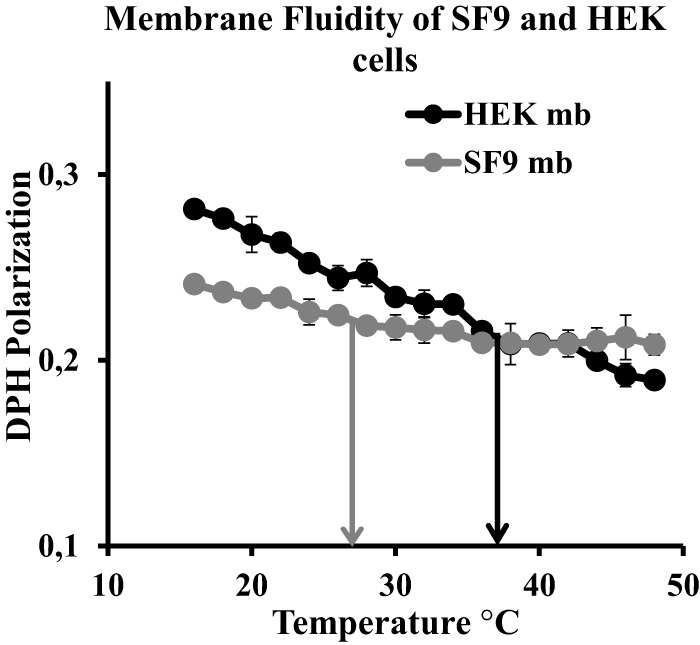
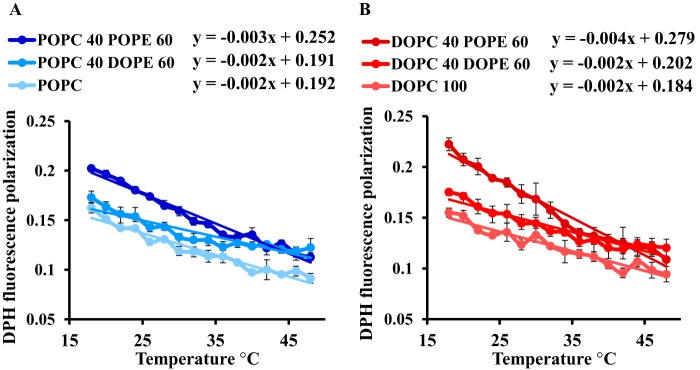
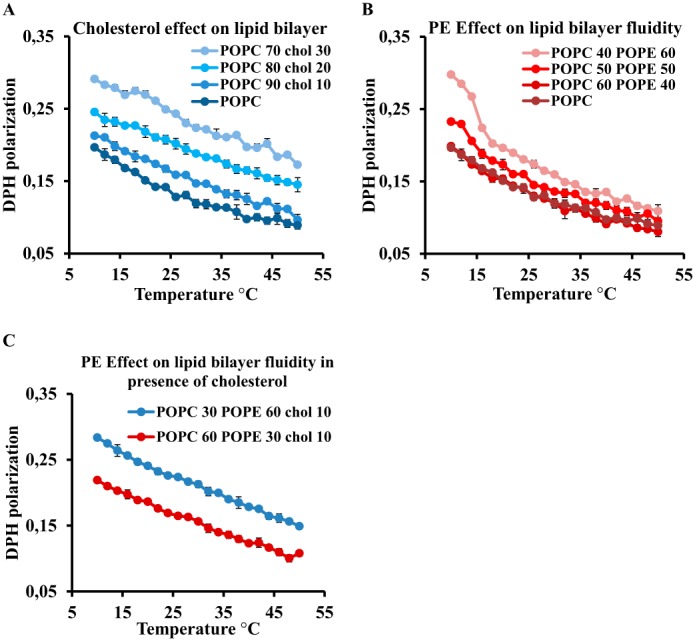
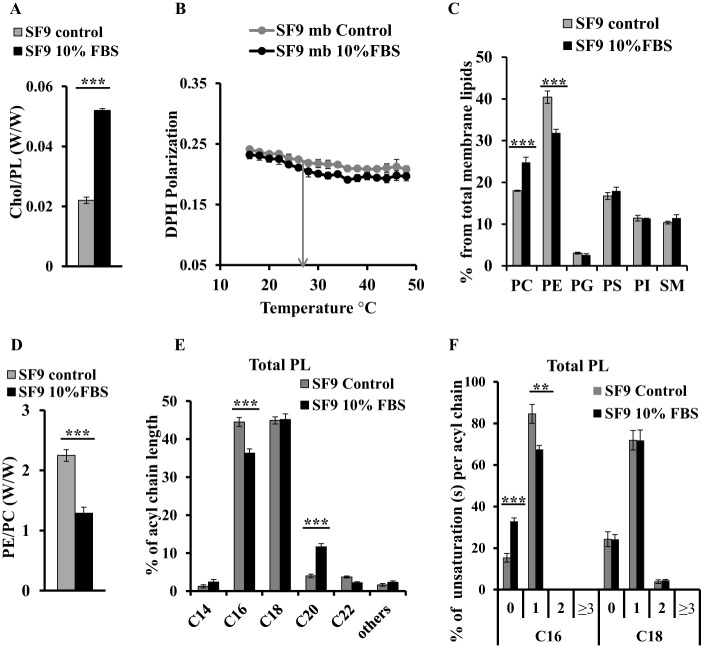
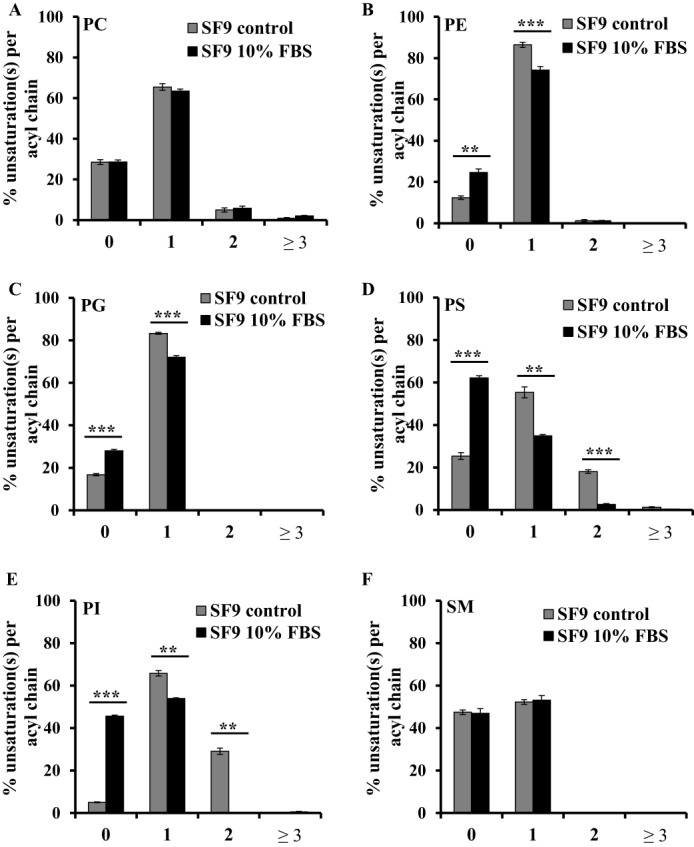
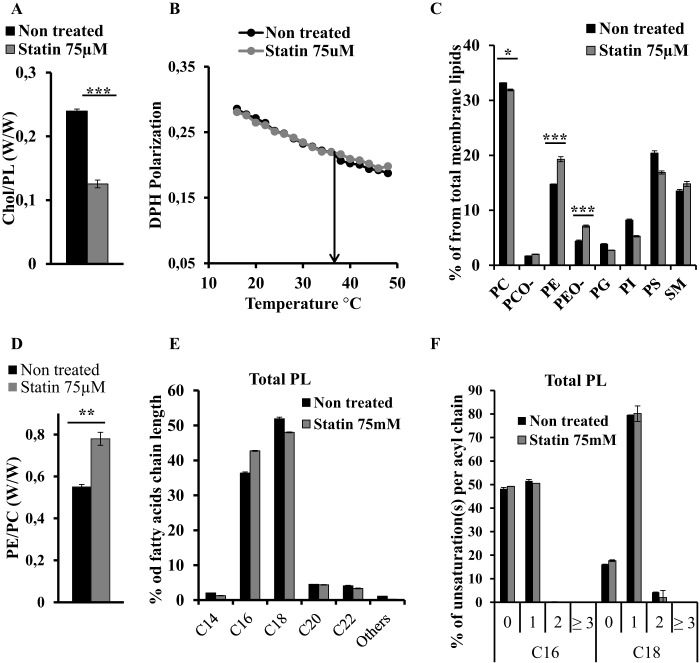
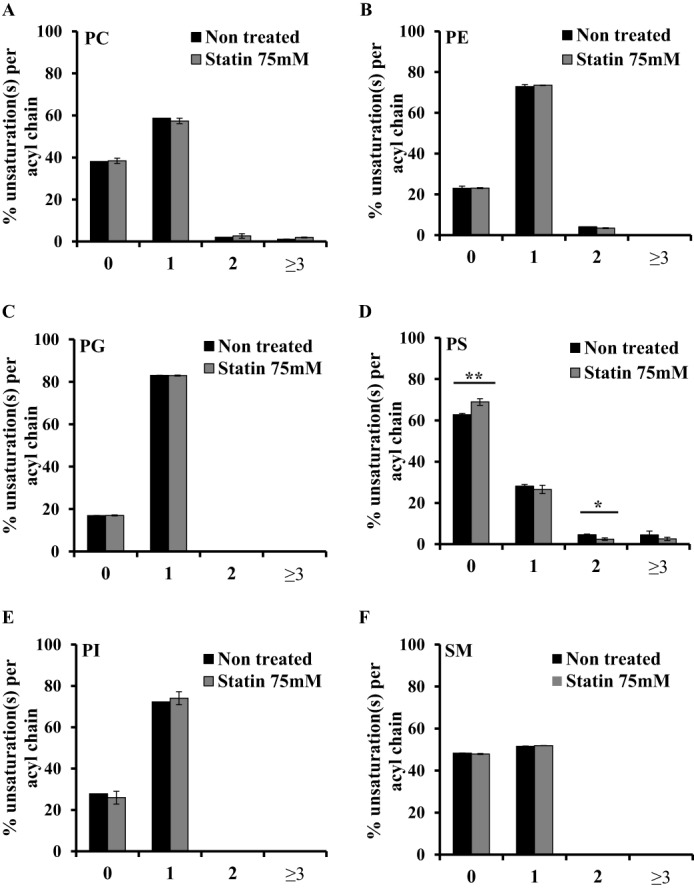
Adequate membrane fluidity is required for a variety of key cellular processes and in particular for proper function of membrane proteins. In most eukaryotic cells, membrane fluidity is known to be regulated by fatty acid desaturation and cholesterol, although some cells, such as insect cells, are almost devoid of sterol synthesis. We show here that insect and mammalian cells present similar microviscosity at their respective physiological temperature. To investigate how both sterols and phospholipids control fluidity homeostasis, we quantified the lipidic composition of insect SF9 and mammalian HEK 293T cells under normal or sterol-modified condition. As expected, insect cells show minimal sterols compared with mammalian cells. A major difference is also observed in phospholipid content as the ratio of phosphatidylethanolamine (PE) to phosphatidylcholine (PC) is inverted (4 times higher in SF9 cells). In vitro studies in liposomes confirm that both cholesterol and PE can increase rigidity of the bilayer, suggesting that both can be used by cells to maintain membrane fluidity. We then show that exogenously increasing the cholesterol amount in SF9 membranes leads to a significant decrease in PE:PC ratio whereas decreasing cholesterol in HEK 293T cells using statin treatment leads to an increase in the PE:PC ratio. In all cases, the membrane fluidity is maintained, indicating that both cell types combine regulation by sterols and phospholipids to control proper membrane fluidity.

Keywords: cholesterol; homeostasis; membrane bilayer; membrane lipid; phosphatidylethanolamine.


Figures

FIGURE 1.
FIGURE 1.
SF9 and HEK 293T membrane fluidity. DPH fluorescence polarization in a temperature range from 15 to 50 °C on membranes (mb) prepared from SF9 (gray) and HEK 293T (black) cells is shown. Error bars indicates S.D. (n = 3). Arrows indicate growth temperature for SF9 (gray; 27 °C) and HEK 293T (black; 37 °C).
FIGURE 2.
FIGURE 2.
Phospholipid and cholesterol distribution in SF9 and HEK 293T membranes. A–E, lipids extracted from SF9 (gray) and HEK 293T (black) membranes were analyzed on a rapid resolution LC system coupled to an ESI-QTOF mass spectrometer. Species were identified by Mass Hunter Qualitative Analysis software of auto-MS/MS data with an accepted maximal error of 5 ppm for detected m/z and quantification made by automatic integration of peaks from extracted ion chromatograms. Bars represent values normalized to 100% (w/w). A, phospholipid distribution; B, cholesterol to phospholipid ratio; C, PE (including PEO-) to PC (including PCO-) ratio; D, fatty acid chain length distribution; E, unsaturation(s) per acyl chain in main fatty acid chains. Error bars indicate S.D. (n = 3). p values were estimated by Student's t test (n = 3): ***, p < 0.001; **, p < 0.005.
FIGURE 3.
FIGURE 3.
Effect of unsaturation on temperature dependence of membrane fluidity. Membrane fluidity curves were measured by DPH fluorescence polarization in a temperature range from 16 to 48 °C on synthetic liposomes with POPC and POPC with 60% (w/w) DOPE or POPE (A) and synthetic liposomes with DOPC and DOPC with 60% (w/w) DOPE or POPE (B). Error bars indicate S.D. (n = 3).
FIGURE 4.
FIGURE 4.
Effect of cholesterol and PE on lipid bilayer viscosity. Membrane fluidity curves were measured by DPH fluorescence polarization in a temperature range from 10 to 50 °C on synthetic liposomes with 0, 10, 20, and 30% (w/w) cholesterol (A) and synthetic liposomes with POPC and POPC with 40, 50, and 60% (w/w) POPE (B) and POPC with 30% (w/w) POPE and 10% (w/w) cholesterol (blue) and POPC with 60% (w/w) POPE and 10% (w/w) cholesterol (red) (C). Error bars indicate S.D. (n = 3).
FIGURE 5.
FIGURE 5.
Membrane fluidity maintained by cholesterol and PE in SF9 membranes upon FBS addition. Lipid distribution and membrane fluidity of membranes (mb) of SF9 control (gray) and SF9 cultured with 10% FBS (black) are shown. A, cholesterol to phospholipid ratio; B, DPH fluorescence polarization; C, phospholipid distribution; D, PE to PC ratio; E, fatty acid chain length distribution; F, unsaturation(s) per acyl chain in main fatty acid chains. Bars represent values normalized to 100% (w/w). Error bars indicate S.D. (n = 3). p values were estimated by Student's t test (n = 3): ***, p < 0.001; **, p < 0.005.
FIGURE 6.
FIGURE 6.
Unsaturation distribution per acyl chain of different PL species in SF9 control and cultured in 10% FBS. Unsaturation(s) per acyl chain distribution in different PL species from SF9 control (gray) and SF9 cultured with 10% FBS (black) is shown. A, PC; B, PE; C, PG; D, PS; E, PI; F, SM. Bars represent values normalized to 100% (w/w). Error bars indicate S.D. (n = 3). p values were estimated by Student's t test (n = 3): ***, p < 0.001; **, p < 0.005.
FIGURE 7.
FIGURE 7.
Membrane fluidity maintained by cholesterol and PE in HEK 293T membranes upon statin treatment. Lipid distribution and membrane fluidity of membranes of HEK 293T control (black) and HEK 293T treated with 75 μm simvastatin for 50 h (gray). A, cholesterol (Chol) to phospholipid ratio; B, DPH fluorescence polarization; C, phospholipid distribution; D, PE (including PEO-) to PC (including PCO-) ratio; E, fatty acid chain length distribution; F, unsaturation(s) per acyl chain in main fatty acid chains. Bars represent values normalized to 100% (w/w). Error bars indicate S.D. (n = 3). p values were estimated by Student's t test (n = 3): ***, p < 0.001; **, p < 0.005; *, p < 0.01.
FIGURE 8.
FIGURE 8.
Unsaturation distribution in acyl chains of different PL species in HEK 293T control and statin-treated cells. Unsaturation(s) per acyl chain distribution in different PL species from HEK 293T control (black) and HEK 293T treated with 75 μm simvastatin for 50 h (gray) is shown. A, PC; B, PE; C, PG; D, PS; E, PI; F, SM. Bars represent values normalized to 100% (w/w). Error bars indicate S.D. (n = 3). p values were estimated by Student's t test (n = 3): ***, p < 0.001; **, p < 0.005; *, p < 0.01.

References

    1. Nicolson G. L. (2014) The fluid-mosaic model of membrane structure: still relevant to understanding the structure, function and dynamics of biological membranes after more than 40 years. Biochim. Biophys. Acta 1838, 1451–1466 - PubMed
    1. Lipowsky R. (2014) Remodeling of membrane compartments: some consequences of membrane fluidity. Biol. Chem. 395, 253–274 - PubMed
    1. Cybulski L. E., del Solar G., Craig P. O., Espinosa M., and de Mendoza D. (2004) Bacillus subtilis DesR functions as a phosphorylation-activated switch to control membrane lipid fluidity. J. Biol. Chem. 279, 39340–39347 - PubMed
    1. Mansilla M. C., Cybulski L. E., Albanesi D., and de Mendoza D. (2004) Control of membrane lipid fluidity by molecular thermosensors. J. Bacteriol. 186, 6681–6688 - PMC - PubMed
    1. Holthuis J. C., and Menon A. K. (2014) Lipid landscapes and pipelines in membrane homeostasis. Nature 510, 48–57 - PubMed

Publication types

MeSH terms