. 2016 May;68(5):1197-1209.
doi: 10.1002/art.39548.

Identification of a Systemic Lupus Erythematosus Risk Locus Spanning ATG16L2, FCHSD2, and P2RY2 in Koreans

Affiliations

Identification of a Systemic Lupus Erythematosus Risk Locus Spanning ATG16L2, FCHSD2, and P2RY2 in Koreans

Christopher J Lessard et al. Arthritis Rheumatol. 2016 May.

Abstract

Objective: Systemic lupus erythematosus (SLE) is a chronic autoimmune disorder whose etiology is incompletely understood, but likely involves environmental triggers in genetically susceptible individuals. Using an unbiased genome-wide association (GWA) scan and replication analysis, we sought to identify the genetic loci associated with SLE in a Korean population.

Methods: A total of 1,174 SLE cases and 4,246 population controls from Korea were genotyped and analyzed with a GWA scan to identify single-nucleotide polymorphisms (SNPs) significantly associated with SLE, after strict quality control measures were applied. For select variants, replication of SLE risk loci was tested in an independent data set of 1,416 SLE cases and 1,145 population controls from Korea and China.

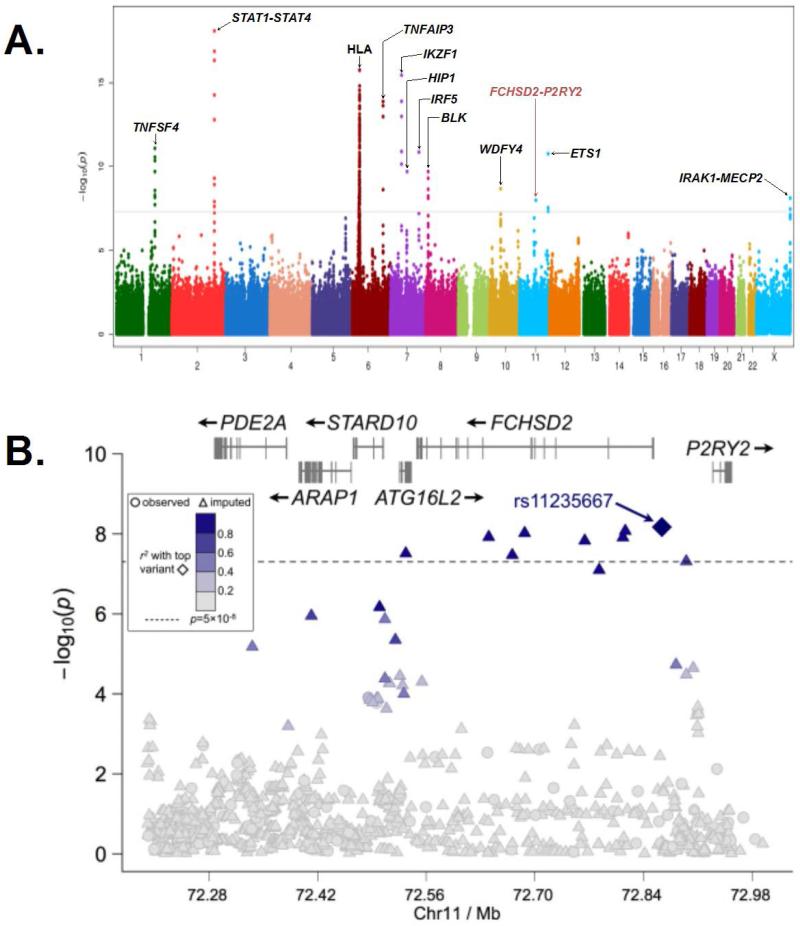
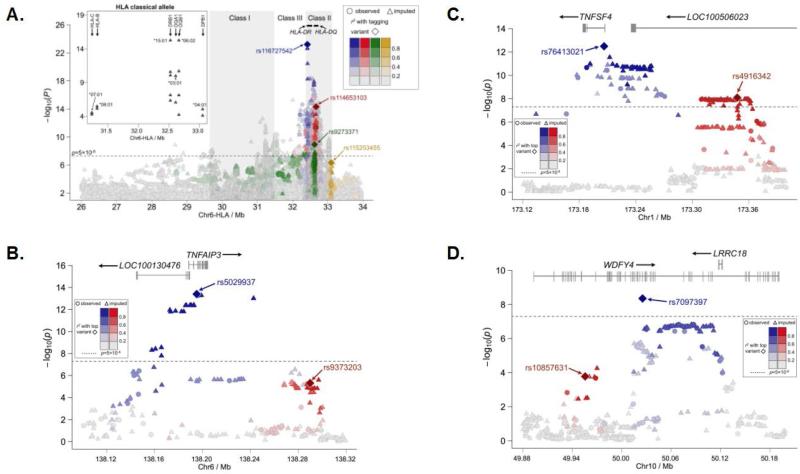
Results: Eleven regions outside the HLA exceeded the genome-wide significance level (P = 5 × 10(-8) ). A novel SNP-SLE association was identified between FCHSD2 and P2RY2, peaking at rs11235667 (P = 1.03 × 10(-8) , odds ratio [OR] 0.59) on a 33-kb haplotype upstream of ATG16L2. In the independent replication data set, the SNP rs11235667 continued to show a significant association with SLE (replication meta-analysis P = 0.001, overall meta-analysis P = 6.67 × 10(-11) ; OR 0.63). Within the HLA region, the SNP-SLE association peaked in the class II region at rs116727542, with multiple independent effects observed in this region. Classic HLA allele imputation analysis identified HLA-DRB1*1501 and HLA-DQB1*0602, each highly correlated with one another, as most strongly associated with SLE. Ten previously established SLE risk loci were replicated: STAT1-STAT4, TNFSF4, TNFAIP3, IKZF1, HIP1, IRF5, BLK, WDFY4, ETS1, and IRAK1-MECP2. Of these loci, previously unreported, independent second risk effects of SNPs in TNFAIP3 and TNFSF4, as well as differences in the association with a putative causal variant in the WDFY4 region, were identified.

Conclusion: Further studies are needed to identify true SLE risk effects in other loci suggestive of a significant association, and to identify the causal variants in the regions of ATG16L2, FCHSD2, and P2RY2.


Figures

Figure 1
Figure 1. Summary of the genome-wide association results for 1174 SLE cases and 3698 controls of Korean ancestry and zoomed plot of the region associated with SLE at 11q14
(A) The -log10(P-value) for each genotyped variant is plotted along the Y-axis with the chromosome and chromosomal position along the X-axis. The gray line indicates the genome-wide significance threshold of P = 5×10⁻⁸. (B) The −log10(P-value) is plotted for each genotyped (shown as circles) and imputed (shown as triangles) variants, and with the peak association, rs11235667, is plotted as a diamond. The linkage disequilibrium with rs11235667 is given by the scale on the figure. The genome-wide significance threshold is displayed as a dashed line at P = 5 ×10⁻⁸. Association exceeding this threshold was found extending from ATG16L2 through FCHSD2 to the shared promoter region with P2RY2.
Figure 2
Figure 2. Expanded view of the association between SLE and the HLA, TNFAIP3, TNFSF4, and WDFY4 regions
The –log10(P-value) is plotted for each observed (shown as circles) and imputed (shown as triangles) variant in the MHC region according to base-pair position from 26Mb to 34Mb on chromosome 6 (A). Linkage disequilibrium with the first four variants included in the stepwise logistic regression analysis is shown with rs116727542 (blue diamond), rs114653103 (red diamond), rs9273371 (green diamond), and rs115253455 (gold diamond) all located within the HLA Class II region. The insert on the left shows the –log10(P-value) of the imputed classical alleles plotted according to base-pair position from 31Mb to 33.5Mb. The additional plots show results for Chromosome 6 in the region of TNFAIP3 (B), Chromosome 1 for the TNFSF4 (C) effects, and Chromosome 10 for WDFY4 (D). For each independent effect, the peak associations are represented by a diamond (blue for the first effect and red for the second, if applicable), and the correlation of variants accounted for by each effect is given in their respective color according the legends present in each plot. The genome-wide significance threshold is displayed as a dashed line on each plot at P = 5 ×10⁻⁸.

References

    1. Tsokos GC. Systemic lupus erythematosus. N Engl J Med. 2011;365(22):2110–21. - PubMed
    1. Arbuckle MR, McClain MT, Rubertone MV, Scofield RH, Dennis GJ, James JA, et al. Development of autoantibodies before the clinical onset of systemic lupus erythematosus. N Engl J Med. 2003;349(16):1526–33. - PubMed
    1. Moser KL, Kelly JA, Lessard CJ, Harley JB. Recent insights into the genetic basis of systemic lupus erythematosus. Genes and immunity. 2009;10(5):373–9. - PMC - PubMed
    1. Deng Y, Tsao BP. Advances in lupus genetics and epigenetics. Curr Opin Rheumatol. 2014;26(5):482–92. - PMC - PubMed
    1. Dai C, Deng Y, Quinlan A, Gaskin F, Tsao BP, Fu SM. Genetics of systemic lupus erythematosus: immune responses and end organ resistance to damage. Curr Opin Immunol. 2014;31C:87–96. - PMC - PubMed

MeSH terms