

Induction of neural differentiation in rat C6 glioma cells with taxol
- PMID: 26665000
- PMCID: PMC4667627
- DOI: 10.1002/brb3.414
Induction of neural differentiation in rat C6 glioma cells with taxol
Abstract
Background: Glioblastoma is a common and aggressive type of primary brain tumor. Several anticancer drugs affect GBM (glioblastoma multiforme) cells on cell growth and morphology. Taxol is one of the widely used antineoplastic drugs against many types of solid tumors, such as breast, ovarian, and prostate cancers. However, the effect of taxol on GBM cells remains unclear and requires further investigation.
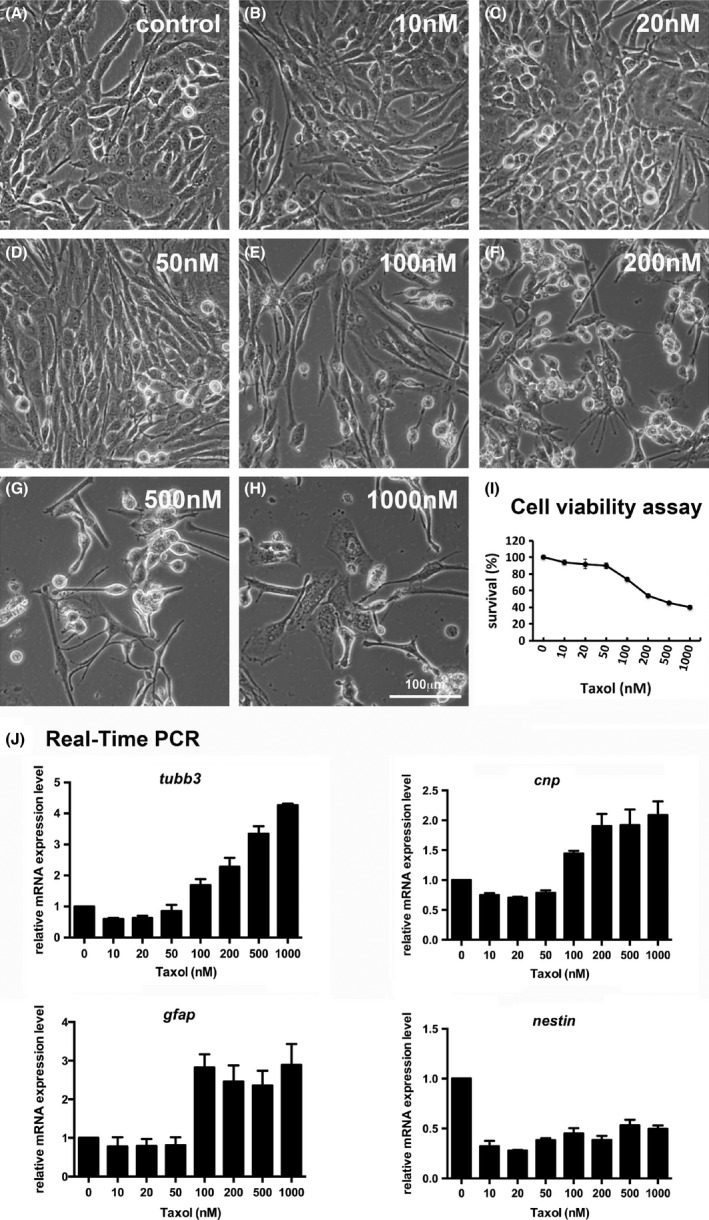
Methods: Survival rate of C6 glioma cells under different taxol concentrations was quantified. To clarify the differentiation patterns of rat C6 glioma cells under taxol challenge, survived glioma cells were characterized by immunocytochemical, molecular biological, and cell biological approaches.
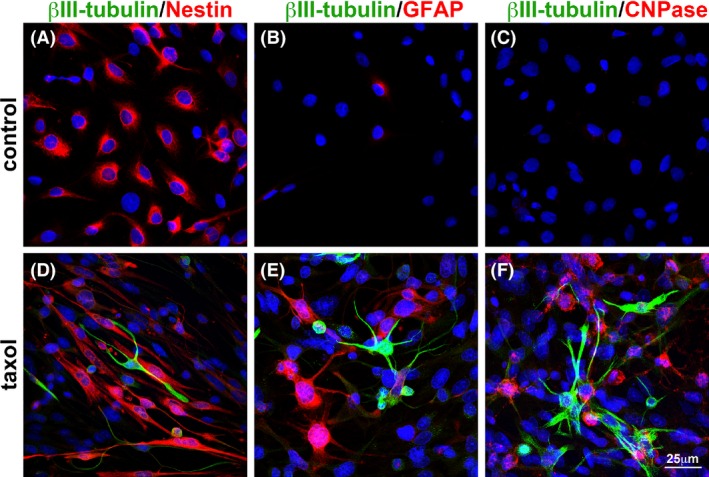
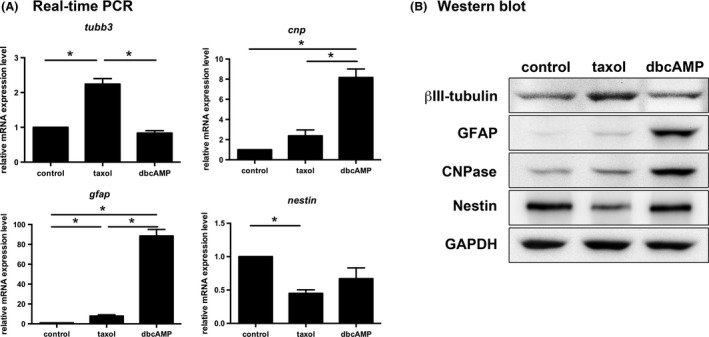
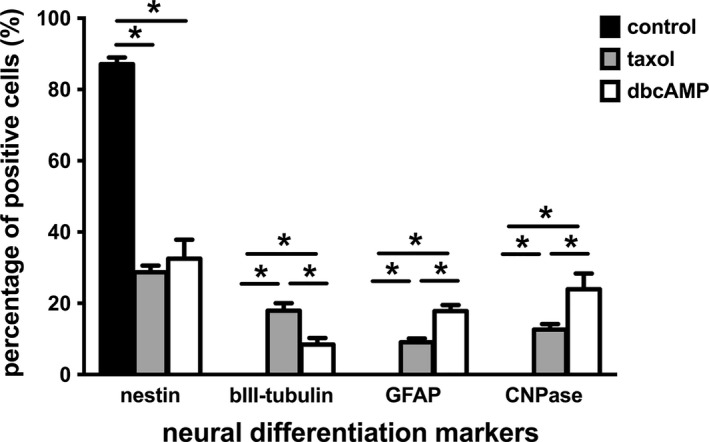
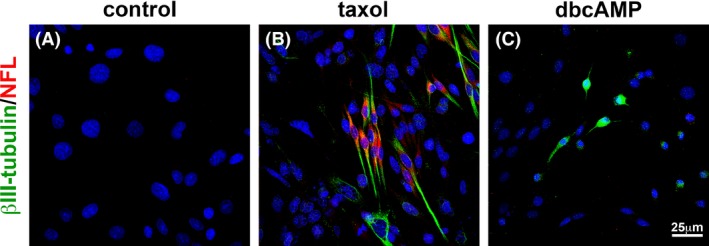
Results: After taxol treatment, not only cell death but also morphological changes, including cell elongation, cellular processes thinning, irregular shapes, and fragmented nucleation or micronuclei, occurred in the survived C6 cells. Neural differentiation markers NFL (for neurons), β III-tubulin (for neurons), GFAP (for astrocytes), and CNPase (for oligodendrocytes) were detected in the taxol-treated C6 cells. Quantitative analysis suggested a significant increase in the percentage of neural differentiated cells. The results exhibited that taxol may trigger neural differentiation in C6 glioma cells. Increased expression of neural differentiation markers in C6 cells after taxol treatment suggest that some anticancer drugs could be applied to elimination of the malignant cancer cells as well as changing proliferation and differentiation status of tumor cells.
Keywords: Glioma; neural differentiation; taxol.
Figures
Similar articles
-
Induction of cell cycle arrest at G1 and S phases and cAMP-dependent differentiation in C6 glioma by low concentration of cycloheximide.BMC Cancer. 2010 Dec 15;10:684. doi: 10.1186/1471-2407-10-684. BMC Cancer. 2010. PMID: 21159181 Free PMC article.
-
[Effects of gamma-secretase inhibitor N-(3, 5-difluorophenacetyl-L-alanyl)-S-phenylglycine t-butyl ester on proliferation and differentiation of neural stem cells].Zhonghua Yi Xue Za Zhi. 2008 Feb 19;88(7):480-3. Zhonghua Yi Xue Za Zhi. 2008. PMID: 18642791 Chinese.
-
Growth inhibition and induction of apoptosis and differentiation of tanshinone IIA in human glioma cells.J Neurooncol. 2007 Mar;82(1):11-21. doi: 10.1007/s11060-006-9242-x. Epub 2006 Sep 6. J Neurooncol. 2007. PMID: 16955220
-
The effects of tibolone on the human primary glioblastoma multiforme cell culture and the rat C6 glioma model.Neurol Res. 2009 Nov;31(9):923-7. doi: 10.1179/174313209X383268. Epub 2009 Jun 15. Neurol Res. 2009. PMID: 19531283
-
Effects of taxol on the polymerization and posttranslational modification of class III beta-tubulin in P19 embryonal carcinoma cells.Biochem Cell Biol. 1995 Sep-Oct;73(9-10):687-94. doi: 10.1139/o95-076. Biochem Cell Biol. 1995. PMID: 8714689 Review.
Cited by
-
Nicotinic acid inhibits glioma invasion by facilitating Snail1 degradation.Sci Rep. 2017 Mar 3;7:43173. doi: 10.1038/srep43173. Sci Rep. 2017. PMID: 28256591 Free PMC article.
-
Methylmalonic Acid Impairs Cell Respiration and Glutamate Uptake in C6 Rat Glioma Cells: Implications for Methylmalonic Acidemia.Cell Mol Neurobiol. 2023 Apr;43(3):1163-1180. doi: 10.1007/s10571-022-01236-1. Epub 2022 Jun 8. Cell Mol Neurobiol. 2023. PMID: 35674974 Free PMC article.
-
The Cytoskeleton-A Complex Interacting Meshwork.Cells. 2019 Apr 18;8(4):362. doi: 10.3390/cells8040362. Cells. 2019. PMID: 31003495 Free PMC article. Review.
-
Small Heat Shock Protein αB-Crystallin Controls Shape and Adhesion of Glioma and Myoblast Cells in the Absence of Stress.PLoS One. 2016 Dec 15;11(12):e0168136. doi: 10.1371/journal.pone.0168136. eCollection 2016. PLoS One. 2016. PMID: 27977738 Free PMC article.
-
Influence of the properties of different graphene-based nanomaterials dispersed in polycaprolactone membranes on astrocytic differentiation.Sci Rep. 2022 Aug 4;12(1):13408. doi: 10.1038/s41598-022-17697-9. Sci Rep. 2022. PMID: 35927565 Free PMC article.
References
-
- Abramovitch, R. , Meir G., and Neeman M.. 1995. Neovascularization induced growth of implanted C6 glioma multicellular spheroids: magnetic resonance microimaging. Cancer Res. 55:1956–1962. - PubMed
-
- Auer, R. N. , Del Maestro R. F., and Anderson R.. 1981. A simple and reproducible experimental in vivo glioma model. Can. J. Neurol. Sci. 8:325–331. - PubMed
-
- Benda, P. , Lightbody J., Sato G., Levine L., and Sweet W.. 1968. Differentiated rat glial cell strain in tissue culture. Science 161:370–371. - PubMed
-
- Bernstein, J. J. , Goldberg W. J., Laws E. R. Jr, Conger D., Morreale V., and Wood L. R.. 1990. C6 glioma cell invasion and migration of rat brain after neural homografting: ultrastructure. Neurosurgery 26:622–628. - PubMed
-
- Bernstein, J. J. , Laws E. R. Jr, Levine K. V., Wood L. R., Tadvalkar G., and Goldberg W. J.. 1991. C6 glioma‐astrocytoma cell and fetal astrocyte migration into artificial basement membrane: a permissive substrate for neural tumors but not fetal astrocytes. Neurosurgery 28:652–658. - PubMed
Publication types
MeSH terms
Substances
LinkOut - more resources
Full Text Sources
Other Literature Sources
Medical
Miscellaneous
