. 2015 Dec 15:6:10145.
doi: 10.1038/ncomms10145.

Sepsis induces long-term metabolic and mitochondrial muscle stem cell dysfunction amenable by mesenchymal stem cell therapy

Affiliations

Sepsis induces long-term metabolic and mitochondrial muscle stem cell dysfunction amenable by mesenchymal stem cell therapy

P Rocheteau et al. Nat Commun. .

Abstract

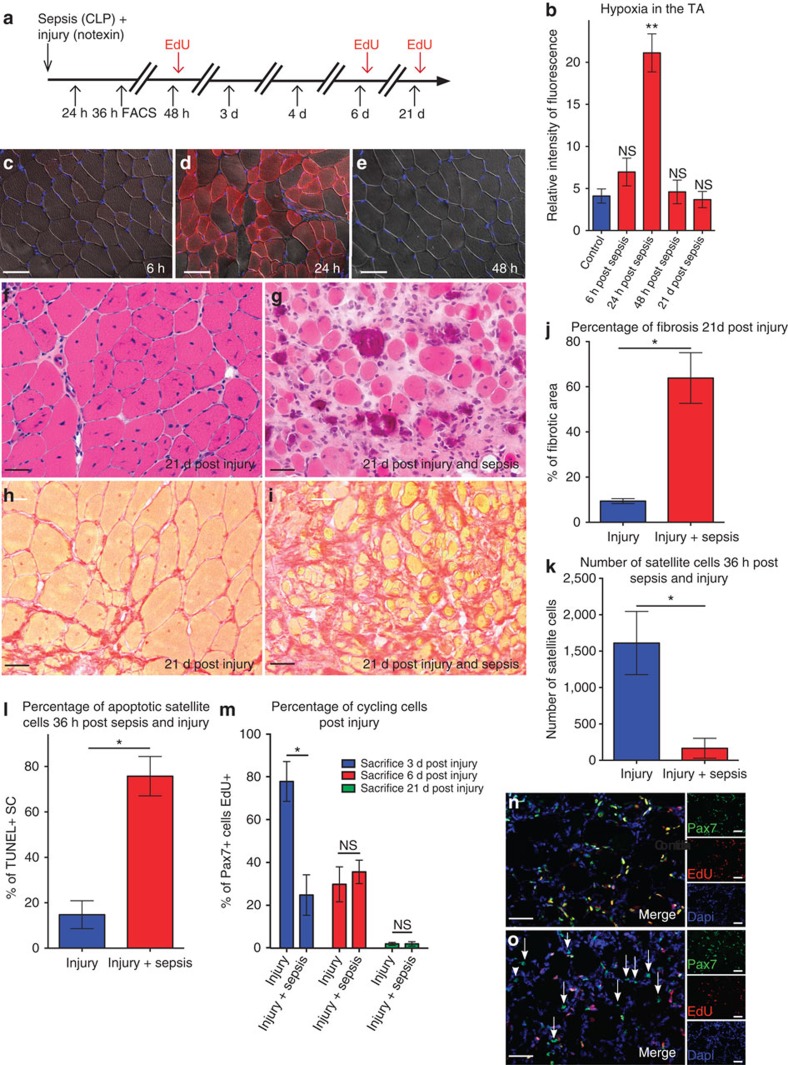
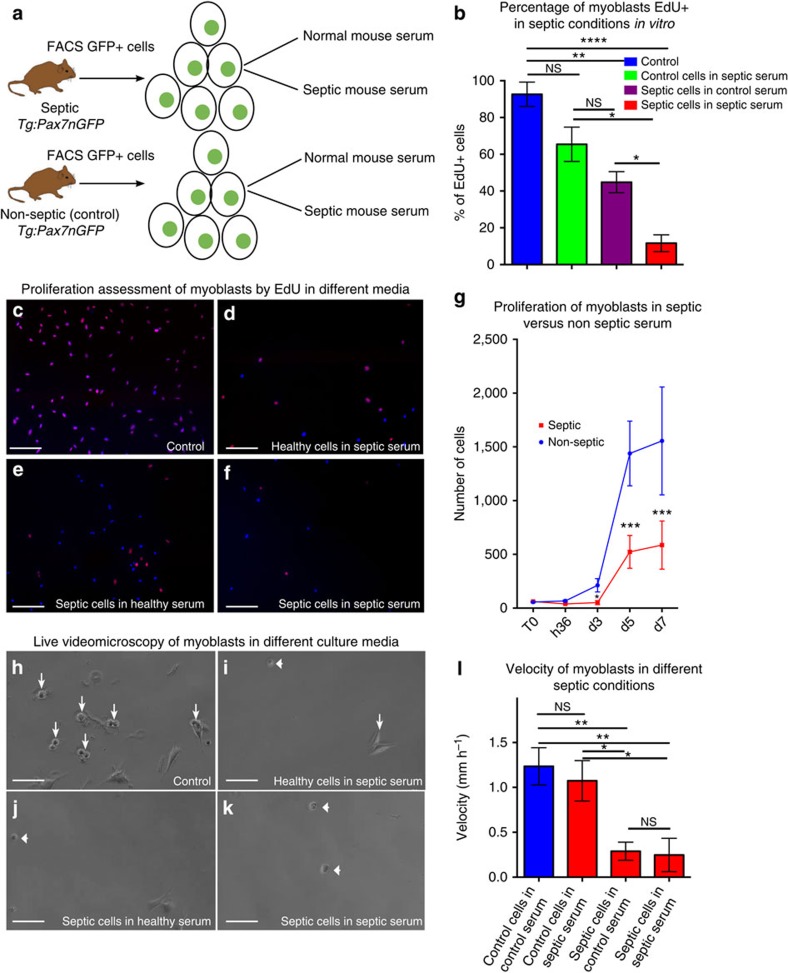
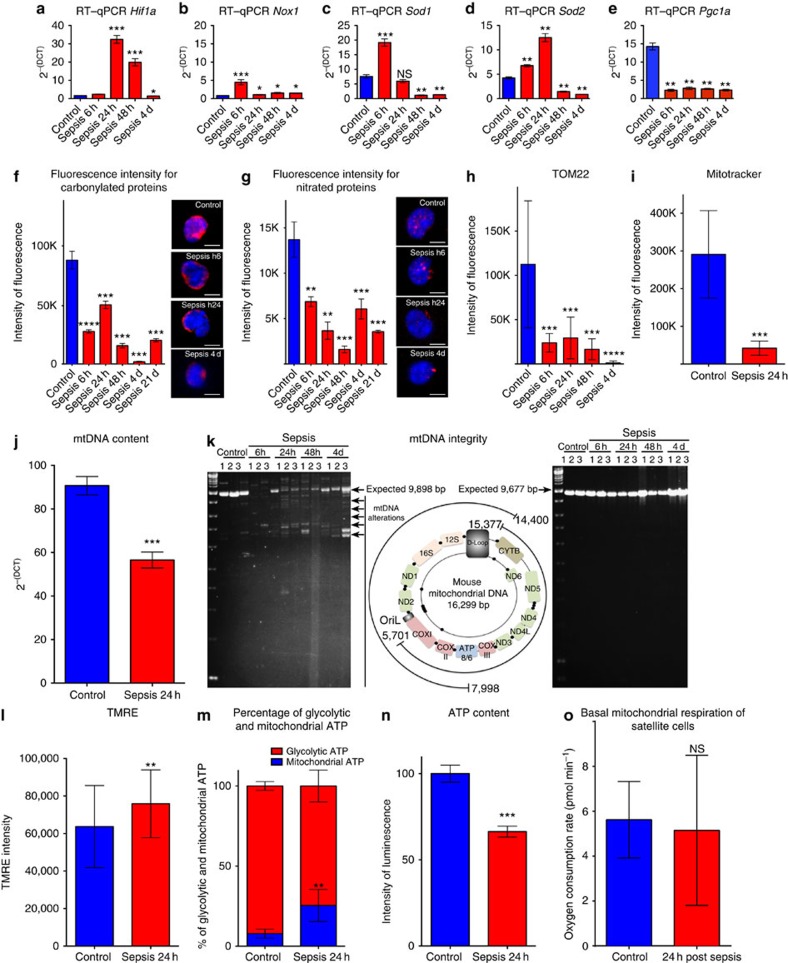
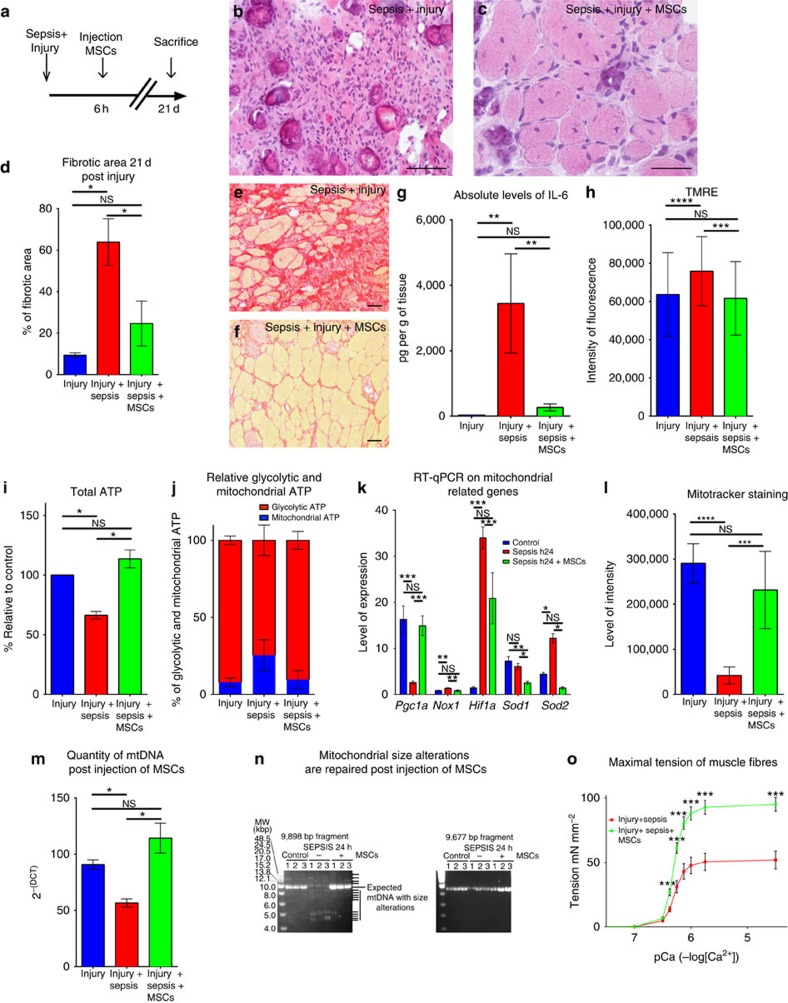
Sepsis, or systemic inflammatory response syndrome, is the major cause of critical illness resulting in admission to intensive care units. Sepsis is caused by severe infection and is associated with mortality in 60% of cases. Morbidity due to sepsis is complicated by neuromyopathy, and patients face long-term disability due to muscle weakness, energetic dysfunction, proteolysis and muscle wasting. These processes are triggered by pro-inflammatory cytokines and metabolic imbalances and are aggravated by malnutrition and drugs. Skeletal muscle regeneration depends on stem (satellite) cells. Herein we show that mitochondrial and metabolic alterations underlie the sepsis-induced long-term impairment of satellite cells and lead to inefficient muscle regeneration. Engrafting mesenchymal stem cells improves the septic status by decreasing cytokine levels, restoring mitochondrial and metabolic function in satellite cells, and improving muscle strength. These findings indicate that sepsis affects quiescent muscle stem cells and that mesenchymal stem cells might act as a preventive therapeutic approach for sepsis-related morbidity.


Figures

Figure 1
Figure 1. Muscle regeneration is impaired during sepsis.
(a) Schematic representation of sacrifice post CLP and injury. (b) Intensity of fluorescence measured by microscopy and quantified using ImageJ of hypoxyprobe at different time points post CLP. (ce) Hypoxyprobe immunostaining of cryosectioned TA muscle at 6, 24 and 48 h post induction of sepsis, respectively. Scale bar, 200 μm. Haematoxylin and eosin staining of a TA 21 days (d) post injury (f) and 21 days post injury and CLP (g) in 8-week-old mice. Scale bar, 100 μm. Sirius Red staining of TA muscle 21 days post injury (h) or 21 days post sepsis and injury (i). Scale bar, 100 μm. (j) Percentage of fibrotic area measured using the threshold method with ImageJ in septic injured mice versus healthy injured mice. (k) Absolute number of satellite cells (counted by FACS) isolated 36 h post injury in the TA muscle of septic (CLP) Tg:Pax7nGFP transgenic mice (n=5). (l) Percentage of TUNEL-positive cells 36 h post CLP and injury, n=5 TgPax7nGFP mice killed and satellite cells FACS cell sorted per condition. (mo) Percentage of cycling SC at different time points post injury and sepsis. (m) Percentage of EdU-positive SC in injured (controls), and injured and septic animals at different time points post injury. (n) Representative image of double Pax7/EdU staining 3 days post injury (regeneration in control mice). (o) Representative picture of double Pax7/EdU staining 3 days post injury and sepsis (arrows point single-labelled satellite cells, that is, non-cycling SC). On the right (lower magnification) individual staining is shown. For all time points mice were between 8 and 12 weeks old, and n=8 animals were analysed. Data are represented as mean±s.d. *P<0.05; **P<0.01 (Mann–Whitney test). NS, not significant.
Figure 2
Figure 2. Muscle satellite cell division is impaired in the presence of septic serum.
(a) Schematic representation of the experimental approach for the in vitro test of septic conditions. (bf) Percentage of cycling cells in different septic conditions in vitro. (b) Percentage of EdU+ myoblasts (cycling satellite cells) cultured in regular conditions (control healthy Tg:Pax7nGFP mice, control serum) or extracted from septic Tg:Pax7nGFP in normal serum (septic animal in control serum) or extracted from healthy Tg:Pax7nGFP in septic serum (control animal in septic serum) or extracted from septic Tg:Pax7nGFP in septic serum. (cf) Representative picture of FACS cell-sorted satellite cells from Tg:Pax7nGFP mice and plated in the different conditions described above, labelled with EdU and fixed/labelled 3 days post plating. (c) Non-septic Tg:Pax7nGFP in non-septic mouse serum. (d) Healthy Tg:Pax7nGFP in septic serum. (e) Septic Tg:Pax7nGFP in non-septic serum. (f) Septic Tg:Pax7nGFP in septic serum. (g) Cells from healthy (non-septic) and septic Tg:Pax7nGFP mice were FACS cell sorted and plated at 100 cells per well density. Clonal analysis of the proliferation through time (from T0 to 7 days post plating) was performed using Opera system (automatic clonal cell count). (hl) Live video microscopy of all conditions previously mentioned (see a). (h) Control (that is, healthy cells in non-septic mouse serum), (i) healthy cells in septic serum, (j) septic cells in non-septic serum and (k) septic cells in septic serum. (l) Velocity of cells measured in μm h−1 in all four conditions. Tg:Pax7nGFP mice were between 8 and 12 weeks old, n=4. Data are represented as mean±s.d. *P<0.05; **P<0.01; ***P<0.001; ****P<0.0001 (Mann–Whitney test). GFP, green fluorescent protein; NS, not significant.
Figure 3
Figure 3. On sepsis satellite cells display altered but hyperactive mitochondria.
(ae) Quantification by RT–qPCR of nuclear genes in the time course of sepsis in the control (no injury no CLP) at 6 h, 24 h, 48 h and 4 days (d) post induction of sepsis; n=6 per time point; (a) expression of hypoxia-inducible factor1 (Hif1a); (b) NADPH oxidase 1 (Nox1); (c,d) expression of antioxidant enzymes Sod1 and Sod2; (e) peroxisome proliferator-activated receptor coactivator 1 (PGC1a). (f,g) Quantification of immunofluorescence intensity by confocal microscopy image acquisition and ImageJ analysis. The levels of carbonylated (antibody anti-dinitrophenyl) and nitrated (antibody anti-nitrotyrosine) proteins (resulting essentially from reactive oxidative and nitrosative species, respectively) were measured in controls, 6 h, 24 h, 48 h and 4 days post induction of sepsis. Representative immunostaining (three-dimensional-reconstructed cells) are displayed. Scale bar, 5 μm. (h) Confocal microscopy immunofluorescence intensity quantification of TOM22 (mitochondrial outer membrane protein) and (i) confocal microscopy intensity of MitoTracker Deep Red staining probe in control (healthy) and septic mice. Once acquired by confocal microscopy the images were analysed using the mean grey value ImageJ plugin. (j) Mitochondrial DNA content (mtDNA) in control and septic SC. (k) Agarose gel electrophoresis of long PCR amplifications on sorted SC mtDNA in controls and septic Tg:Pax7nGFP 6 h, 24 h, 48 h and 4 days post sepsis showing mtDNA size alterations. Left panel, amplification of a fragment of expected size (9,898 bp) from positions 7,998–16,299/1 (conventional end/origin of circular mtDNA) and 1–14,400 of the mtDNA; the image on this panel is intentionally highly contrasted to underscore multiple bands, and also the low intensity of the expected band (9,898 bp) in sepsis samples compared with controls; centre panel, schematic representation of genes and regulatory regions in the human mtDNA, with the coordinates of PCR-amplified regions; right panel, amplification of a fragment of expected size 9,677 bp from positions 15,377 to 5,701 of the mtDNA. Note that size alterations in cells from septic mice are present in one (left panel) but not the other PCR-amplified fragment. (l) Tetramethylrhodamine ethylamine (TMRE; mitochondrial membrane potential) levels. (m) Relative percentage of glycolytic and mitochondrial (OXPHOS) ATP in controls (no injury no CLP) and 24 h post sepsis. (n) Percentage of ATP relative to control in controls (n=6) and septic Tg:Pax7nGFP at 24 h (n=6). (o) Basal mitochondrial respiration of SC in non-septic (control) and 24 h post sepsis evaluated with Seahorse XFe96 analyser. Unless specified data are represented as mean±s.d. *P<0.05; **P<0.01; ***P<0.001; ****P<0.0001; NS, not significant, compared with the respective control (Mann–Whitney test).
Figure 4
Figure 4. Mesenchymal stem cells improve muscle regeneration by decreasing septic state and restoring affected mitochondrial parameters in satellite cells.
(a) Schematic representation of timing of sacrifice, post-caecal ligature puncture and injury (with notexin) plus MSCs grafting. (b) Haematoxylin and eosin staining of the TA 21 days (d) post sepsis and injury (n=16). Scale bar, 100 μm. (c) Haematoxylin and eosin of TA 21 days post sepsis and injury with injection 6 h post injury of mesenchymal stem cells (n=16). Scale bar, 100 μm. (df) Fractions of fibrotic area. (d) Fibrotic area of the muscle tissue after regeneration (21 days post injury) in control, septic and septic injected with MSC conditions. (e) Sirius Red staining of muscle tissue of septic mice 21 days post injury (n=16) Scale bar, 100 μm. (f) Sirius Red staining of muscle tissue 21 days post injury of septic mice treated with MSC injection (n=16). Scale bar, 100 μm. (g) Example of Luminex on interleukin-6 (IL-6) representing the level of protein expression in pg g−1 of muscle tissue. Control are non-injured mice (n=4), septic Tg:Pax7nGFP at 24 h (n=4) and septic Tg:Pax7nGFP injected with MSCs (n=4). (h) TMRE label in injured (n=3); injured, septic TgPax7nGFP (n=3); and injured, septic, MSC-injected TgPax7nGFP (n=3) at 24 h. (i) ATP content relative to control (n=6), septic TgPax7nGFP (n=6) and septic TgPax7nGFP injected with MSCs (n=6) at 24 h. (j) Relative glycolytic and mitochondrial ATP content in controls (no injury no CLP), 24 h post sepsis, and septic Tg:Pax7nGFP injected with MSCs. (k) Quantification by RT–qPCR of PGC1a, Nox1, Hif1a, Sod1 and Sod2 expression. (l) Relative level of intensity of MitoTracker Deep Red in controls, septic Tg:Pax7nGFP and septic Tg:Pax7nGFP injected with MSCs at 24 h (n=6). (m) Quantification of mtDNA in FACS cell-sorted satellite cells in injured, injured and septic, and injured, septic and MSC-injected Tg:Pax7nGFP mice. (n) Agarose gel electrophoresis of long PCR amplification of mtDNA in SCs from controls, septic and septic mice injected with MSCs showing mtDNA alterations only in septic mice (left panel). The coordinates of the amplified fragments are shown in Fig. 3k. MSCs rescue normal mitochondrial genome size after sepsis. (o) Maximal tension of muscle fibres of septic and injured (n=6) compared with septic, injured and MSC-injected C57Bl/6 mice (n=7) according to the Ca2+ concentration. Data are represented as mean±s.d. *P<0.05; **P<0.01; ***P<0.001; ****P<0.0001; not significant, compared with the respective control (Mann–Whitney test).

Similar articles

Cited by

References

    1. Cohen J. The immunopathogenesis of sepsis. Nature 420, 885–891 (2002). - PubMed
    1. Gamrin L. et al. Longitudinal changes of biochemical parameters in muscle during critical illness. Metabolism 46, 756–762 (1997). - PubMed
    1. Mittendorfer B., Gore D. C., Herndon D. N. & Wolfe R. R. Accelerated glutamine synthesis in critically ill patients cannot maintain normal intramuscular free glutamine concentration. JPEN J. Parenter. Enteral Nutr. 23, 243–250 discussion 250–242 (1999). - PubMed
    1. Rennie M. J. et al. Glutamine metabolism and transport in skeletal muscle and heart and their clinical relevance. J. Nutr. 126, 1142S–1149S (1996). - PubMed
    1. Windmueller H. G. & Spaeth A. E. Respiratory fuels and nitrogen metabolism in vivo in small intestine of fed rats. Quantitative importance of glutamine, glutamate, and aspartate. J. Biol. Chem. 255, 107–112 (1980). - PubMed

Publication types