. 2015 Dec 15:5:18217.
doi: 10.1038/srep18217.

The significance of G-CSF expression and myeloid-derived suppressor cells in the chemoresistance of uterine cervical cancer

Affiliations

The significance of G-CSF expression and myeloid-derived suppressor cells in the chemoresistance of uterine cervical cancer

Mahiru Kawano et al. Sci Rep. .

Abstract

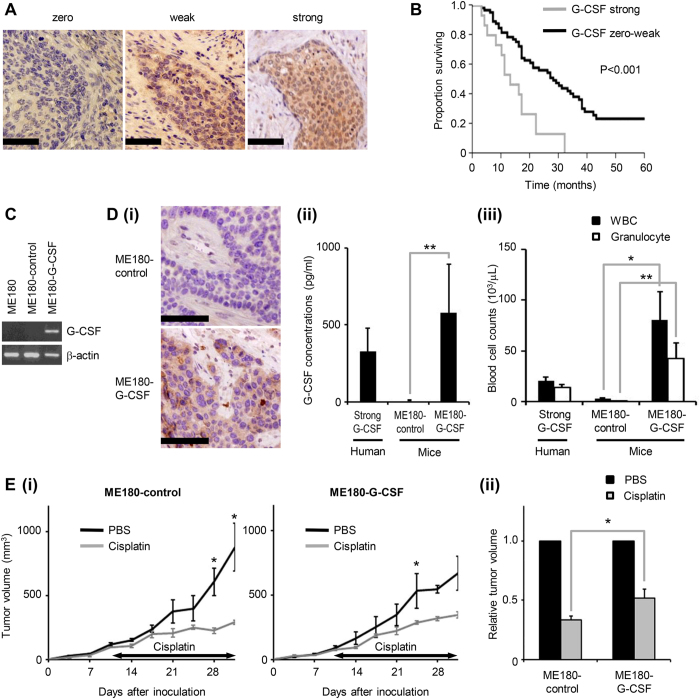
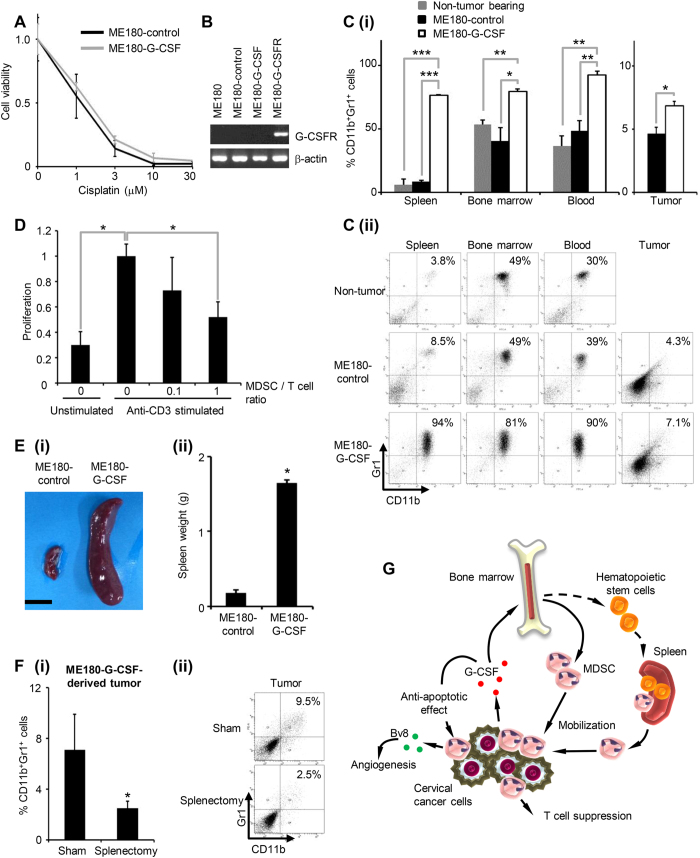
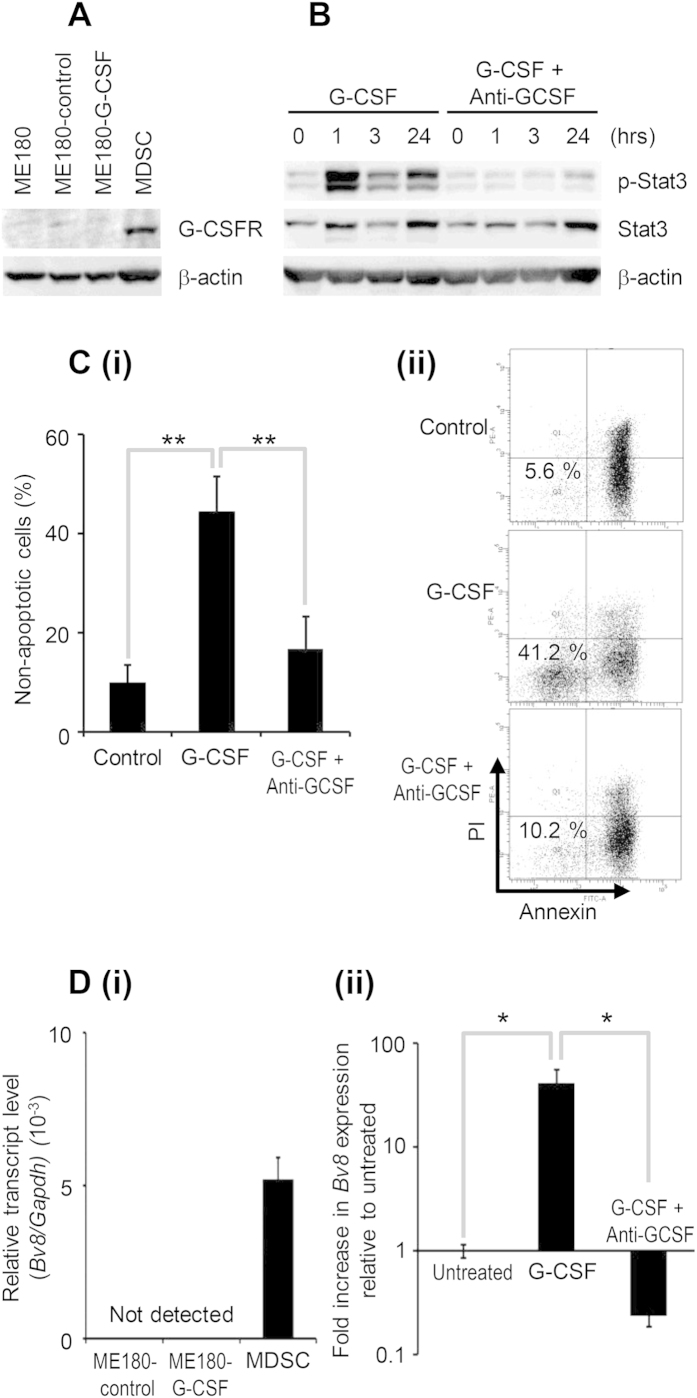
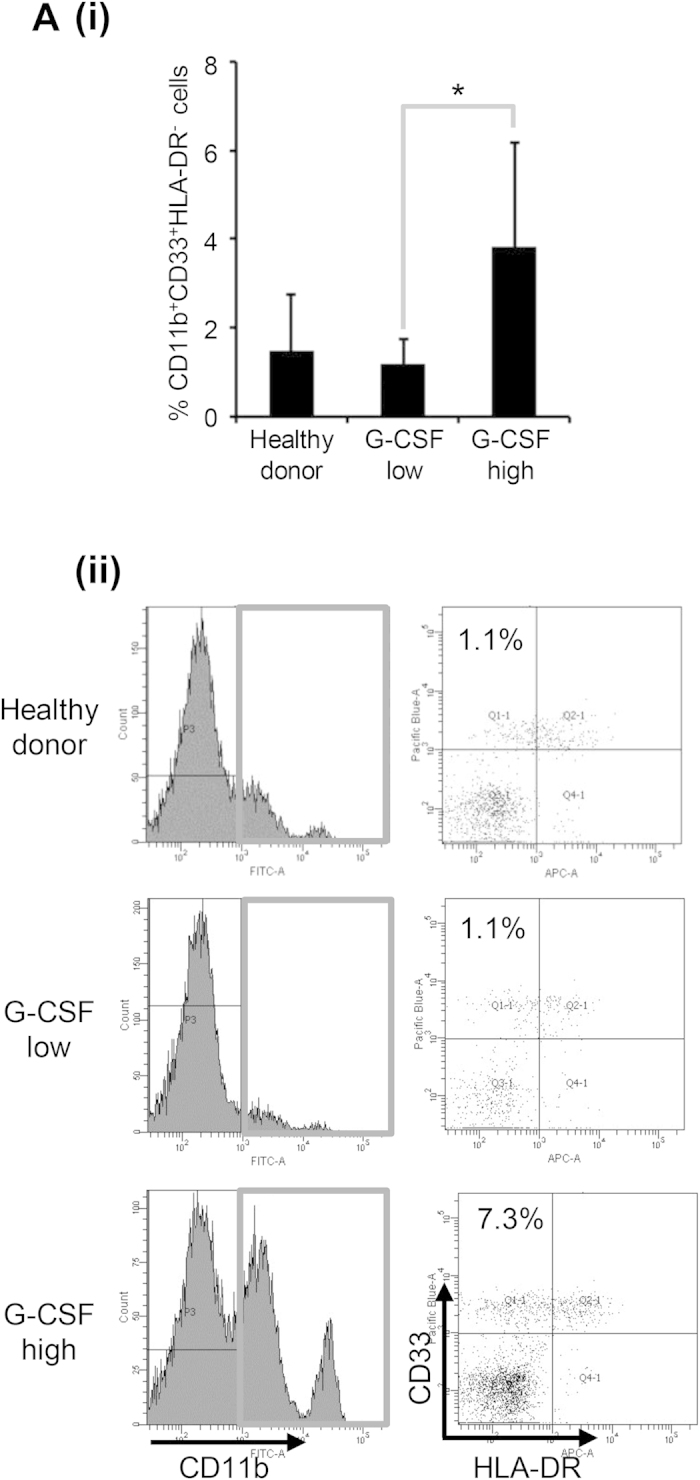
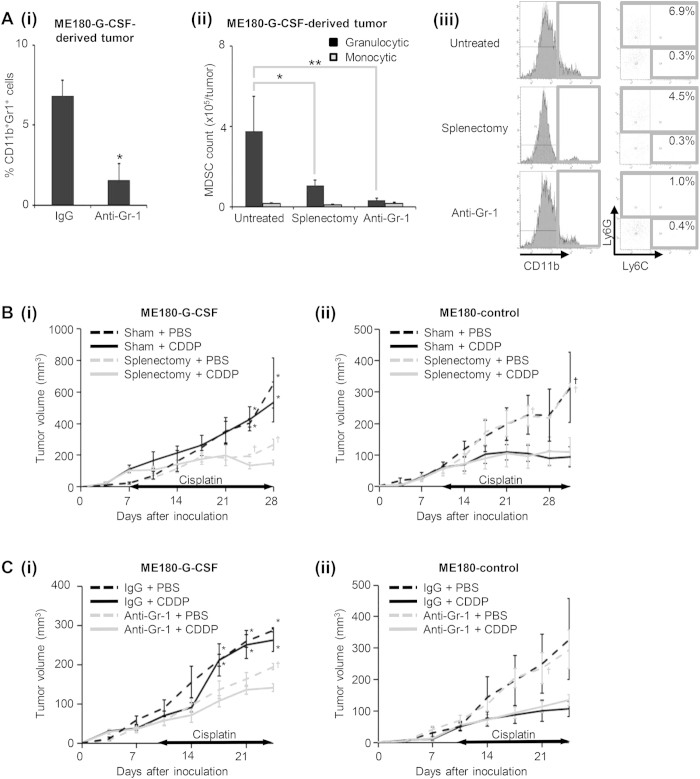
Granulocyte-colony stimulating factor (G-CSF) producing malignant tumor has been reported to occur in various organs, and has been associated with poor clinical outcome. The aim of this study is to investigate the significance of tumor G-CSF expression in the chemosensitivity of uterine cervical cancer. The clinical data of recurrent or advanced cervical cancer patients who were treated with platinum-based chemotherapy were analyzed. Clinical samples, cervical cancer cell lines, and a mouse model of cervical cancer were employed to examine the mechanisms responsible for the development of chemoresistance in G-CSF-producing cervical cancer, focusing on myeloid-derived suppressor cells (MDSC). As a result, the tumor G-CSF expression was significantly associated with increased MDSC frequencies and compromised survival. In vitro and in vivo experiments demonstrated that the increased MDSC induced by tumor-derived G-CSF is involved in the development of chemoresistance. The depletion of MDSC via splenectomy or the administration of anti-Gr-1 antibody sensitized G-CSF-producing cervical cancer to cisplatin. In conclusion, tumor G-CSF expression is an indicator of an extremely poor prognosis in cervical cancer patients that are treated with chemotherapy. Combining MDSC-targeting treatments with current standard chemotherapies might have therapeutic efficacy as a treatment for G-CSF-producing cervical cancer.


Conflict of interest statement

The authors declare no competing financial interests.

Figures

Figure 1
Figure 1. Clinical implications of tumor G-CSF expression in cervical cancer patients receiving chemotherapy. (A) G-CSF expression in cervical cancer.
Cervical cancer biopsy samples were stained with anti-G-CSF antibody. Representative photographs of tumors which exhibited zero, weak and strong G-CSF expression (magnification: ×200, bar = 50 μm). (B) Kaplan–Meier estimates of overall survival after chemotherapy according to G-CSF immunoreactivity. Log-rank test was used to determine statistical significance. (C) Establishment of G-CSF-producing cervical cancer cell lines. RT-PCR analysis of the G-CSF and β-actin mRNA levels of ME180 cells that had been stably transfected with the G-CSF vector (ME180-G-CSF) or the control vector (ME180-control). (D) A mouse model of G-CSF-producing cervical cancer. Mice were inoculated with ME180-G-CSF (n = 5) or ME180-control cells (n = 5). Three weeks after the inoculation, their subcutaneous tumors and blood were collected for evaluation. Blood samples were also collected from G-CSF-positive cervical cancer patients (n = 6) (normal range of the serum G-CSF level in humans: <20.0  pg/mL). (i) G-CSF expression in the subcutaneous tumors. (magnification: ×200, bar = 50 μm) (ii) Serum G-CSF concentrations according to ELISA. Bars, SD. **P < 0.01, Two-sided Student’s t test. (iii) WBC/granulocyte counts. Bars, SD. *P < 0.05, **P < 0.01, Two-sided Student’s t test. (E) Cisplatin-resistant nature of G-CSF-producing cervical cancer. Mice that had been inoculated with the ME180-G-CSF or ME180-control cells were treated with 4 mg/kg of weekly cisplatin or PBS (n = 5 for each group). (i) Growth curves. Bars, SD. *P < 0.05 for cisplatin vs. PBS, Wilcoxon rank sum test. (ii) Relative tumor volume three weeks after chemotherapy. Bars, SD. *P < 0.05, Wilcoxon rank sum test.
Figure 2
Figure 2. MDSC accumulation in G-CSF-producing cervical cancer derived tumor bearing mice.
(A) In vitro sensitivity of cervical cancer cells to cisplatin. ME180-G-CSF or ME180-control cells were exposed to the indicated dose of cisplatin for 72 hours. Cell viability was assessed using the MTS assay. Data points, mean values; bars, SD. Data are shown as the means of triplicate samples. (B) RT-PCR analysis of the G-CSFR and β-actin mRNA levels of the cervical cancer cells. ME180-G-CSFR cells, into which a G-CSFR expression vector had been stably transfected, were used as positive controls. (C) CD11b+ Gr-1+ cell populations in G-CSF-producing cervical cancer. Mice were inoculated with ME180-G-CSF (n = 6), ME180-control cells (n = 6), or PBS alone (n = 6). Four weeks after the inoculation, their spleen, bone marrow, blood, and tumors were collected. (i) CD11b+ Gr-1+ cell populations were counted by flow cytometry. Bars, SD. *P < 0.05, **P < 0.01, ***P < 0.001, Two-sided Student’s t test. (ii) Representative dot plot. The percentage of the CD11b+ Gr-1+ cell is indicated. (D) Ability of G-CSF-induced CD11b+ Gr-1+ cells to suppress anti-CD3 mAb-stimulated T cells. Balb/c mice were subcutaneously treated with 10 μg recombinant human G-CSF for three days. CD11b+ Gr-1+ cells were isolated from their spleen. CD8+ T cells (2 × 105 cells/well) were isolated from syngeneic mice and co-cultured with CD11b+ Gr-1+ cells at indicated ratios. Cells were incubated for 72 hours, after which BrdU was added for an additional 24 hours. T cell proliferation was determined by BrdU incorporation. Bars, SD. *P < 0.05, Two-sided Student’s t test. (E) Splenomegaly in G-CSF-producing cervical cancer. Mice were inoculated with ME180-G-CSF (n = 6) or ME180-control cells (n = 6). Their spleens were collected 4 weeks later. (i) Representative photos of the spleen (bar = 1 cm). (ii) Spleen weight. Bars, SD. *P < 0.05, Wilcoxon rank sum test. (F) The effect of splenectomy on MDSC accumulation in ME180-G-CSF-derived tumors. Mice that underwent splenectomy (n = 5) or sham surgery (n = 5) were inoculated with ME180-G-CSF. Three weeks after the inoculation, their subcutaneous tumors were collected. (i) CD11b+ Gr-1+ cell populations in tumors. Bars, SD. *P < 0.05, Two-sided Student t test. (ii) Representative data. (G) Proposed paracrine mechanism responsible for the chemoresistance in cervical cancer.
Figure 3
Figure 3. Mechanism of MDSC-mediated cisplatin resistance.
(A) Western blot analysis of G-CSFR and β-actin expression in MDSC. (B) The effect of G-CSF on Stat3 activation of MDSC. MDSC were treated with 10 ng/mL G-CSF in the presence or absence of 100 μg/mL anti-G-CSF-neutralizing antibody. (i) Cells were cultured for indicated time and then activation of Stat3 in MDSC was assessed by Western blotting. (C) The effect of G-CSF on the survival of MDSC. MDSC were treated with 10 ng/mL G-CSF in the presence or absence of 100 μg/mL anti-G-CSF-neutralizing antibody. (i) Cells were cultured for 24 hours and then assayed for apoptosis by flow cytometry. The pooled data indicating the non-apoptotic cells were shown. Bars, SD. **P < 0.01, Two-sided Student’s t test. (ii) Representative dot plot. The percentage of the non-apoptotic cells is indicated. (D) The effect of G-CSF on the expression of Bv8 in MDSC. (i) Cervical cancer cells and MDSC were harvested, and their Bv8 expression was assessed by real-time RT-PCR. The expression level of Bv8 mRNA was normalized to that of GAPDH mRNA. (ii) MDSC were treated with 10 ng/mL G-CSF in the presence or absence of 100 μg/mL anti-G-CSF-neutralizing antibody for 4 hours. Then their Bv8 expression was assessed. Bars, 95% confidence interval. *P < 0.05, Two-sided Student’s t test.
Figure 4
Figure 4. MDSC in cervical cancer patients.
(A) Circulating MDSC levels of the cervical cancer patients. Peripheral blood mononuclear cells (PBMC) were obtained from healthy donors (n = 10), cervical cancer patients with normal G-CSF levels (n = 9) and cervical cancer patients with elevated G-CSF levels (n = 5). (i) Human MDSC, which were defined as CD11b+ CD33+ HLA-DR cells, were counted using flow cytometry. Bars, SD. *P < 0.05, Wilcoxon rank sum test. (ii) Representative dot plot. The percentage of the CD11b+ CD33+ HLA-DR cell is indicated.
Figure 5
Figure 5. MDSC depletion and cisplatin resistance.
(A) (i) The effects of anti-Gr-1 neutralizing antibody on MDSC accumulation in ME180-G-CSF-derived tumors. Mice that had been inoculated with ME180-G-CSF cells were treated with anti-Gr-1 neutralizing antibody (n = 6) or control IgG (n = 6) every 2 days. Three weeks after inoculation, the subcutaneous were collected for evaluation. Bars, SD. *P < 0.05, Two-sided Student t test. (ii–iii) The effects of splenectomy and anti-Gr-1-neutralizing antibody on MDSC subsets in ME180-G-CSF-derived tumor-bearing mice that had undergone splenectomy (n = 5), anti-Gr-1 antibody treatment (n = 5), or no treatment (n = 5). CD11b+ cells were gated and then re-plotted for their Ly6G and Ly6C expression to determine the frequencies of the granulocytic and monocytic MDSC subsets. (ii) Each MDSC subpopulation was counted by flow cytometry. Bars, SD. *P < 0.05, **P < 0.01, Wilcoxon rank sum test. (iii) Representative histograms and dot plots. The percentage of granulocytic and monocytic MDSC subsets is indicated. (B) Effects of spleen removal on the cisplatin-sensitivity of cervical cancer. Mice that had undergone splenectomy or sham surgery were inoculated with cervical cancer cells (n = 5 for each group) and treated with cisplatin or PBS. Growth curves of (i) ME180-G-CSF- and (ii) ME180-control-derived tumors. Bars, SD. *P < 0.05 for splenectomy vs sham group, P < 0.05 for cisplatin vs PBS group, Wilcoxon rank sum test. (C) Effects of anti-Gr-1-neutralizing antibody on the cisplatin-sensitivity of cervical cancer. Mice carrying cervical cancer-derived tumors were treated with cisplatin or PBS in combination with anti-Gr-1-neutralizing antibody or IgG (n = 5 for each group). Growth curves of (i) ME180-G-CSF- and (ii) ME180-control-derived tumors. Bars, SD. *P < 0.05 for anti-Gr-1 vs IgG group, P < 0.05 for cisplatin vs PBS group, Wilcoxon rank sum test.

Similar articles

Cited by

References

    1. Torre L. A. et al. Global cancer statistics, 2012. CA Cancer J Clin 65, 87–108, 10.3322/caac.21262 (2015). - DOI - PubMed
    1. Eifel P. J. et al. Pelvic irradiation with concurrent chemotherapy versus pelvic and para-aortic irradiation for high-risk cervical cancer: an update of radiation therapy oncology group trial (RTOG) 90-01. J Clin Oncol 22, 872–880, 10.1200/JCO.2004.07.197 (2004). - DOI - PubMed
    1. Kitagawa R. et al. A multi-institutional phase II trial of paclitaxel and carboplatin in the treatment of advanced or recurrent cervical cancer. Gynecol Oncol 125, 307–311, 10.1016/j.ygyno.2012.02.009 (2012). - DOI - PubMed
    1. Monk B. J., Huang H. Q., Cella D. & Long H. J. & Study, G. O. G. Quality of life outcomes from a randomized phase III trial of cisplatin with or without topotecan in advanced carcinoma of the cervix: a Gynecologic Oncology Group Study. J Clin Oncol 23, 4617–4625, 10.1200/JCO.2005.10.522 (2005). - DOI - PubMed
    1. Granger J. M. & Kontoyiannis D. P. Etiology and outcome of extreme leukocytosis in 758 nonhematologic cancer patients: a retrospective, single-institution study. Cancer 115, 3919–3923, 10.1002/cncr.24480 (2009). - DOI - PubMed

Publication types

MeSH terms

Substances