. 2015 Dec 14;36(4):628-44.
doi: 10.1128/MCB.00436-15. Print 2016 Feb 15.

Snf1-Dependent Transcription Confers Glucose-Induced Decay upon the mRNA Product

Affiliations

Snf1-Dependent Transcription Confers Glucose-Induced Decay upon the mRNA Product

Katherine A Braun et al. Mol Cell Biol. .

Abstract

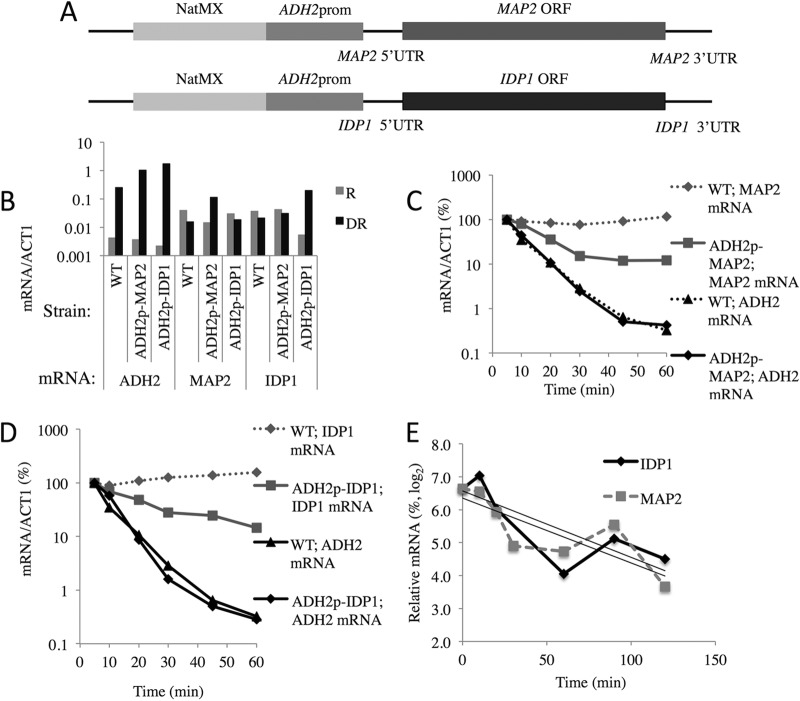
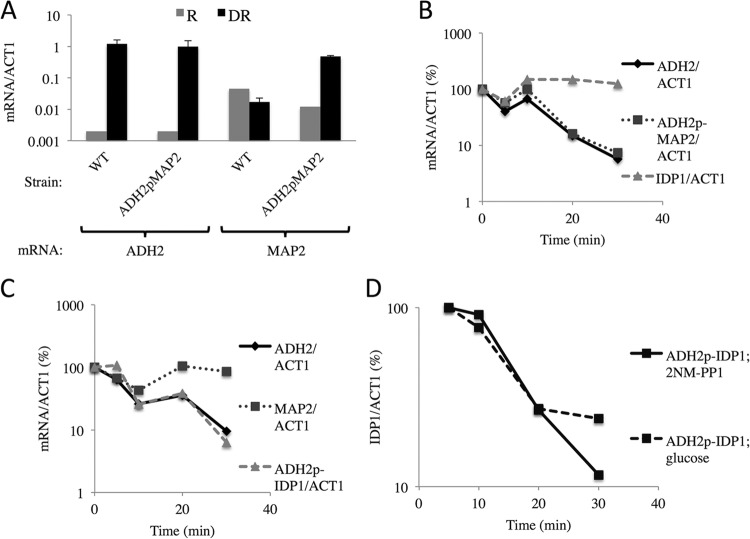
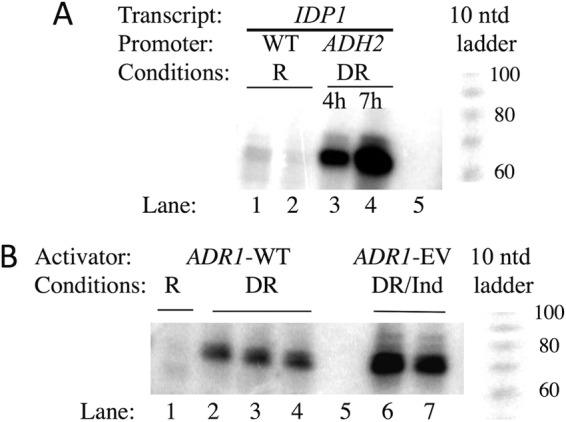
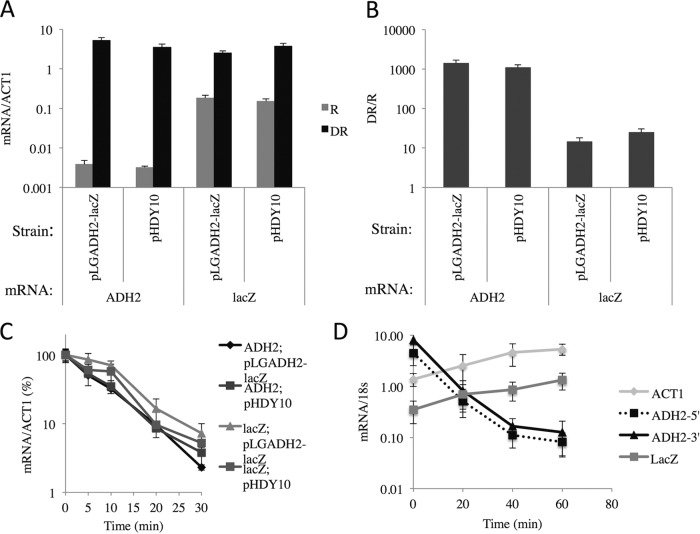
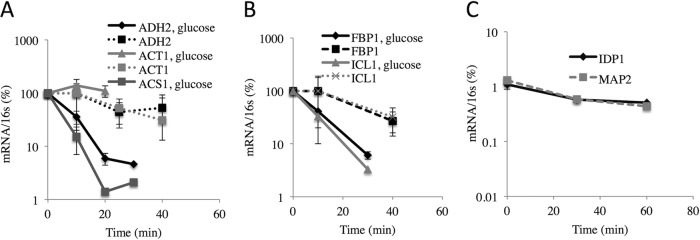
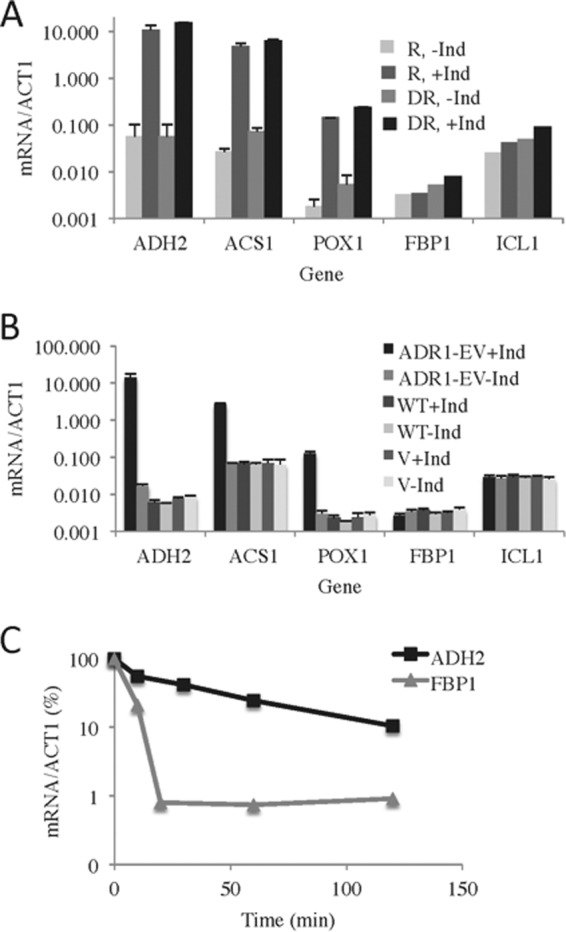
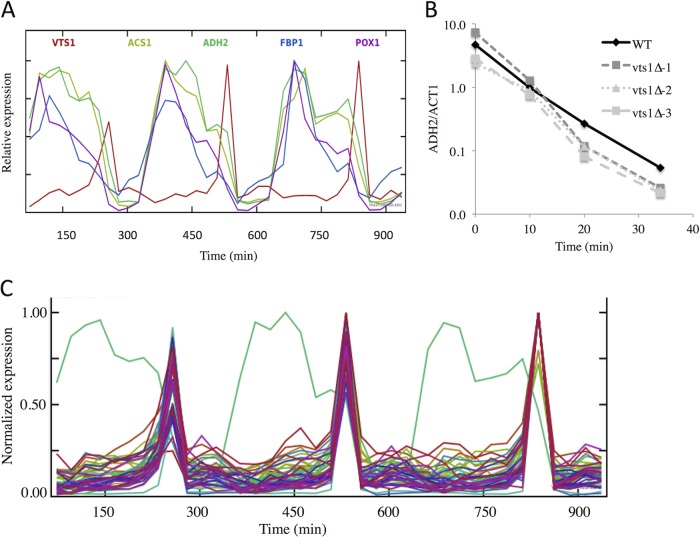
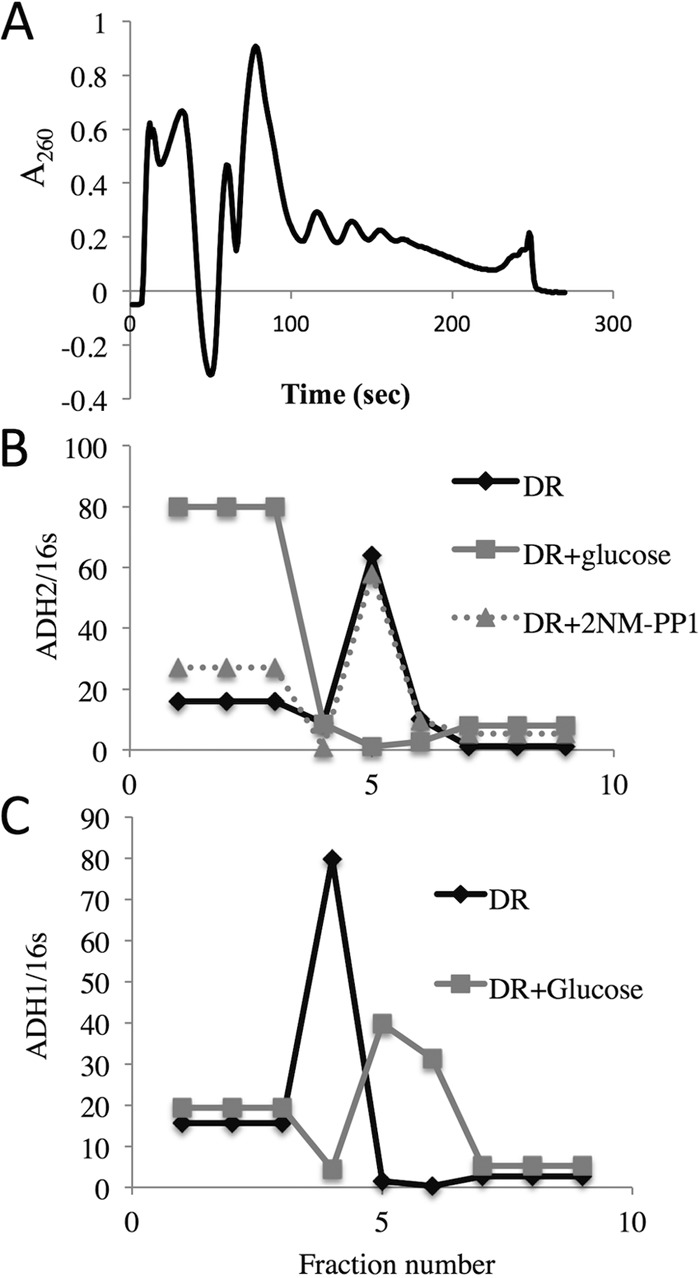
In the yeast Saccharomyces cerevisiae, the switch from respiratory metabolism to fermentation causes rapid decay of transcripts encoding proteins uniquely required for aerobic metabolism. Snf1, the yeast ortholog of AMP-activated protein kinase, has been implicated in this process because inhibiting Snf1 mimics the addition of glucose. In this study, we show that the SNF1-dependent ADH2 promoter, or just the major transcription factor binding site, is sufficient to confer glucose-induced mRNA decay upon heterologous transcripts. SNF1-independent expression from the ADH2 promoter prevented glucose-induced mRNA decay without altering the start site of transcription. SNF1-dependent transcripts are enriched for the binding motif of the RNA binding protein Vts1, an important mediator of mRNA decay and mRNA repression whose expression is correlated with decreased abundance of SNF1-dependent transcripts during the yeast metabolic cycle. However, deletion of VTS1 did not slow the rate of glucose-induced mRNA decay. ADH2 mRNA rapidly dissociated from polysomes after glucose repletion, and sequences bound by RNA binding proteins were enriched in the transcripts from repressed cells. Inhibiting the protein kinase A pathway did not affect glucose-induced decay of ADH2 mRNA. Our results suggest that Snf1 may influence mRNA stability by altering the recruitment activity of the transcription factor Adr1.


Figures

FIG 1
FIG 1
The ADH2 promoter/regulatory region confers glucose-induced mRNA instability on normally stable transcripts. (A) Structures of the MAP2 and IDP1 loci after targeted integration of the ADH2 promoter. (B) ADH2, MAP2, and IDP1 transcript levels under repressed (R) and derepressed (DR) growth conditions. (C and D) Glucose-induced mRNA decay experiments were performed as described in Materials and Methods in strains W303-1a (WT), KBY127 (ADH2p-MAP2), and KBY131 (ADH2p-IDP1). (E) Levels of endogenous IDP1 and MAP2 transcripts after transcription was inhibited by the addition of 100 μg/ml 1,10-o-phenanthroline following 4 h of derepression in strain KBY77. The slopes of the linear regression curves were used to calculate the mRNA half-lives reported in Table 3.
FIG 2
FIG 2
The ADH2 promoter confers SNF1-dependent mRNA expression and stability to normally SNF1-independent transcripts. (A) ADH2 and MAP2 transcript levels under repressed (R) and derepressed (DR) growth conditions. The mean results and ranges for two biological replicates are shown. (B and C) Strains KBY137 and KBY140 with the relevant genotypes [map2::natMX-ADH2p(−591 to −49)-MAP2 and idp1::natMX-ADH2p(−591 to −49)-IDP1 ura3::YIpSNF1as::URA3 snf1Δ::kanMX, respectively] were grown to mid-log phase in YP plus 5% glucose and treated as described in the legend to Fig. 1, except that 2NM-PP1 rather than glucose was added to a final concentration of 10 μM after 4 h of derepression. (D) IDP1 transcript levels in strain KBY140 after the addition of glucose or 2NM-PP1 to a 4-h derepressed culture.
FIG 3
FIG 3
Primer extension analysis. (A) The 5′ ends of IDP1 mRNA were determined as described in Materials and Methods. The strains used were KBY137 (WT IDP1) and BY4741 (WT IDP1) grown under repressing (R) conditions (lanes 1 and 2, respectively) and strain KBY140 (ADH2p-IDP1) grown under derepressing (DR) conditions for 4 and 7 h (lanes 3 and 4, respectively). Lane 5, no RNA during primer extension. A 10-nucleotide (ntd) ladder is shown to the right. (B) 5′ ends of ADH2. Lane 1, RNA isolated from strain KBY140 grown under repressing conditions; lanes 2 to 4, three replicates using RNA from strain KBY140 grown for 4 h under derepressing conditions; lane 5, no RNA during the primer extension; lanes 6 and 7, two RNA preparations from strain TYY204 containing pRR01(ADR1-EV) grown under derepressing conditions for 3 h and then induced with 1 nM β-estradiol for 1 h (DR/Ind). A 10-nucleotide ladder is shown to the right.
FIG 4
FIG 4
Binding sites for Adr1 are sufficient to promote glucose-induced mRNA decay. (A and B) ADH2 and lacZ transcript levels under repressed (R) and derepressed (DR) growth conditions (A), and the ratio of expression levels under derepressed and repressed growth conditions (B). (C and D) Strain W303-1a (WT) was transformed with pHDY10 (34) or pLGADH2 (35), and cultures were grown to mid-log phase in synthetic complete (SC) medium lacking uracil plus 5% glucose. (C) After 21 h of derepression, a typical glucose-induced mRNA decay experiment was performed. (D) lacZ, ACT1, and ADH2 transcript levels in strain CKY19 transformed with the lacZ expression plasmid YCpPKG2 (PYK1lacZ). After 4 h of derepression, glucose and 1,10-o-phenanthroline were added. The values for mRNA were normalized to the abundance of 18S RNA. The average results and standard deviations for four transformants of CKY19 transformed with YCpPKG2 are shown.
FIG 5
FIG 5
Glucose-induced mRNA instability assessed by pulse-chase using 4-thiouracil as described in Materials and Methods. Strain TYY203 was grown in SM with limiting uracil and 5% glucose and then shifted to derepressing medium with 0.05% glucose and limiting uracil. After the addition of a 50-fold excess of normal uracil with or without glucose, samples were removed at the indicated times and 4-thiouracil-containing RNA was purified. Specific mRNA levels were measured by RT-qPCR and normalized to the amount of reference 16S RNA that was added prior to the biotinylation reactions. (A) ADH2, ACT1, and ACS1 mRNAs. (B) FBP1 and ICL1 mRNAs. (C) IDP1 and MAP2 transcript levels were measured in an analogous experiment conducted using the same strain. (A and B) The values represent the means and ranges of the results for two replicate cultures.
FIG 6
FIG 6
Transcript stability is influenced by the activator, not the transition from respiration to fermentation. (A) Strain CKY27 (adr1Δ snf1Δ) carrying the chimeric gene ADR1-EV on the centromeric plasmid pRR01 was grown in synthetic medium lacking histidine but with 5% glucose to an A600 of ∼1. Different portions of the culture were maintained under repressing conditions or subjected to derepression, in each case with or without induction with 1 nM β-estradiol. The data represent the average results and standard deviations from three replicate experiments. (B) β-Estradiol induction of gene expression requires the chimeric Adr1-EV activator. Cultures of strain CKY27 (adr1Δ snf1Δ) carrying the chimeric gene ADR1-EV on pRR01 (ADR1-EV), a WT ADR1 gene carried on pKD16H (WT), or pRS313, a HIS3 vector with no ADR1 (vector [V]), were grown to mid-log phase in SC medium without histidine but with 5% glucose. Thereafter, the cells were treated as described for panel A. The values shown are the average results and standard deviations from three replicate experiments. (C) ADH2 mRNA made in derepressing conditions under the control of the chimeric Adr1-EV activator is not subject to glucose-induced mRNA decay. Cultures of strain TYY204 (adr1Δ) carrying the chimeric gene ADR1-EV were grown, derepressed, and induced as described for panel A. After 60 min of induction, glucose and 1,10-o-phenanthroline were added to final concentrations of 5% and 100 μg/ml, respectively. Aliquots were removed at the times indicated for RNA isolation and analysis. The results shown are those of a representative example from three replicate experiments.
FIG 7
FIG 7
(A) VTS1 expression is regulated during the metabolic cycle. The abundance of ADH2 and VTS1 transcripts during three turns of the metabolic cycle was retrieved from the data in Tu et al. (69) as described in Materials and Methods. (B) Glucose-induced mRNA decay in WT and vts1 deletion mutants. A typical glucose-induced mRNA decay experiment was performed and analyzed as described in Materials and Methods. The WT strain is BY4741, and it and the three deletion mutants are from the Research Genetics collection. The vts1Δ-1 and vts1Δ-3 strains are MATa, and the vts1Δ-2 strain is MATα. The vts1Δ-1 and vts1Δ-3 strains are derived from two different strain collections. (C) Expression of genes whose timing is correlated with that of VTS1 during the yeast metabolic cycle. Transcript abundance was obtained as described in Materials and Methods.
FIG 8
FIG 8
ADH2 mRNA rapidly dissociates from polysomes after glucose repletion. Cell extracts were made and fractionated by sucrose density gradient centrifugation as described in Materials and Methods and in more detail in reference . E. coli RNA was added to fractions 1 to 9 to serve as a reference for the efficiency of RNA purification and cDNA synthesis. (A) A260 values of the material eluting from a 10-to-30% sucrose gradient on which an extract from derepressed cells was sedimented. (B and C) ADH2 (B) and ADH1 (C) transcript abundance normalized to the amount of reference 16S RNA.
FIG 9
FIG 9
Activity of the cyclic AMP-dependent protein kinase is not required for glucose-induced mRNA decay. (A) ADH2 and RSP5 mRNA levels after 4 h of derepression in strain JBY3622 (relevant genotype, TPK1as TPK2as TPK3as). 2NM-PP1 or DMSO (No inhibitor) was added at the time derepression was initiated by pelleting the cells and resuspending them in low-glucose medium. (B and C) A typical glucose-induced mRNA decay experiment was performed in strain JBY3622 (described above). 2NM-PP1, glucose, 2NM-PP1 and glucose, or DMSO (No addition) was added after 4 h of derepression, and ADH2, ACT1, and RSP5 transcripts were analyzed by RT-qPCR.

Similar articles

Cited by

References

    1. Carlson M. 1999. Glucose repression in yeast. Curr Opin Microbiol 2:202–207. doi:10.1016/S1369-5274(99)80035-6. - DOI - PubMed
    1. Schuller H-J. 2003. Transcriptional control of nonfermentative metabolism in the yeast Saccharomyces cerevisiae. Curr Genet 43:139–160. doi:10.1007/s00294-003-0381-8. - DOI - PubMed
    1. Santangelo GM. 2006. Glucose signaling in Saccharomyces cerevisiae. Microbiol Mol Biol Rev 70:253–282. doi:10.1128/MMBR.70.1.253-282.2006. - DOI - PMC - PubMed
    1. Gancedo JM. 2008. The early steps of glucose signalling in yeast. FEMS Microbiol Rev 32:673–704. doi:10.1111/j.1574-6976.2008.00117.x. - DOI - PubMed
    1. Zaman S, Lippman SI, Zhao X, Broach JR. 2008. How Saccharomyces responds to nutrients. Annu Rev Genet 42:27–81. doi:10.1146/annurev.genet.41.110306.130206. - DOI - PubMed

Publication types

MeSH terms