. 2016 Jan 13;138(1):289-99.
doi: 10.1021/jacs.5b10494. Epub 2015 Dec 28.

Biosynthesis and Reactivity of Cysteine Persulfides in Signaling

Affiliations

Biosynthesis and Reactivity of Cysteine Persulfides in Signaling

Pramod K Yadav et al. J Am Chem Soc. .

Abstract

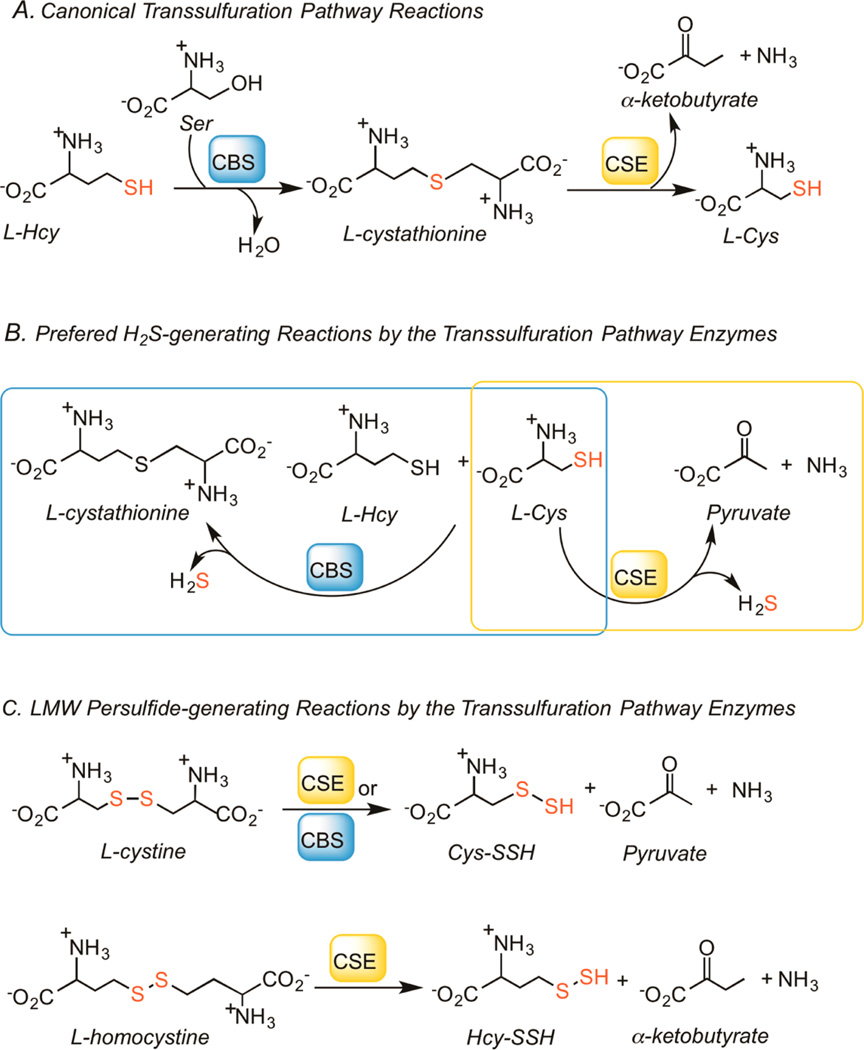
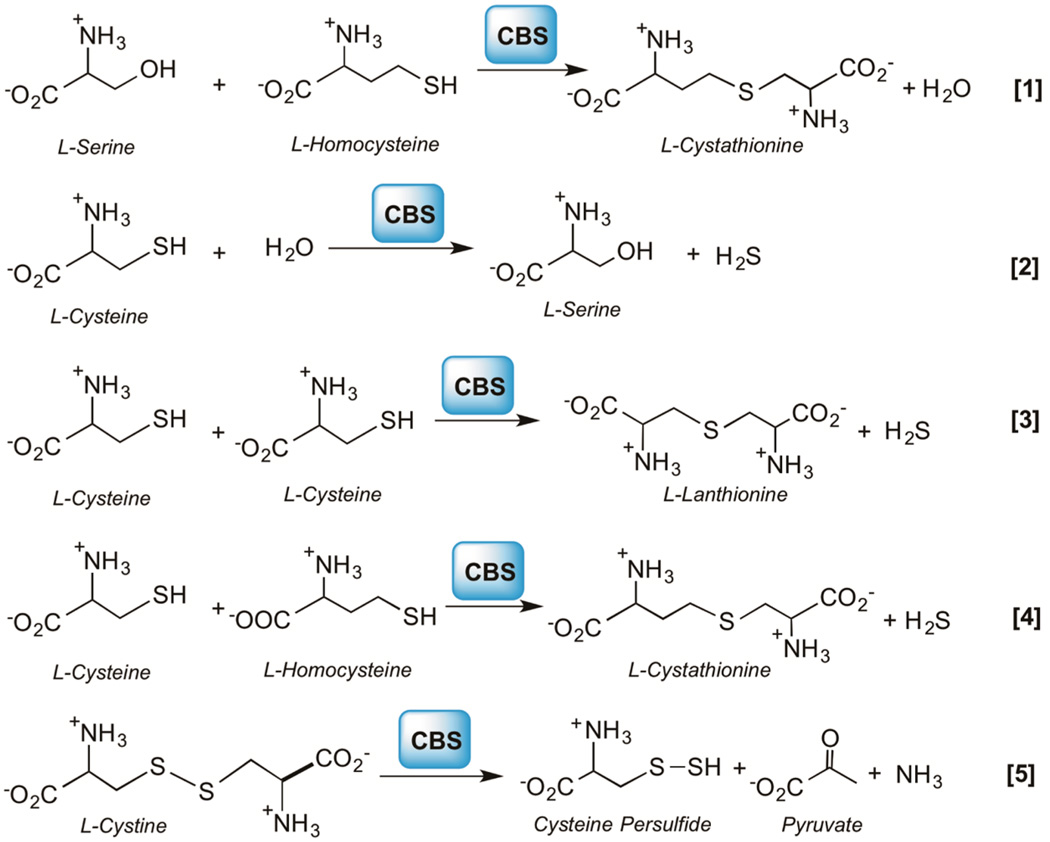
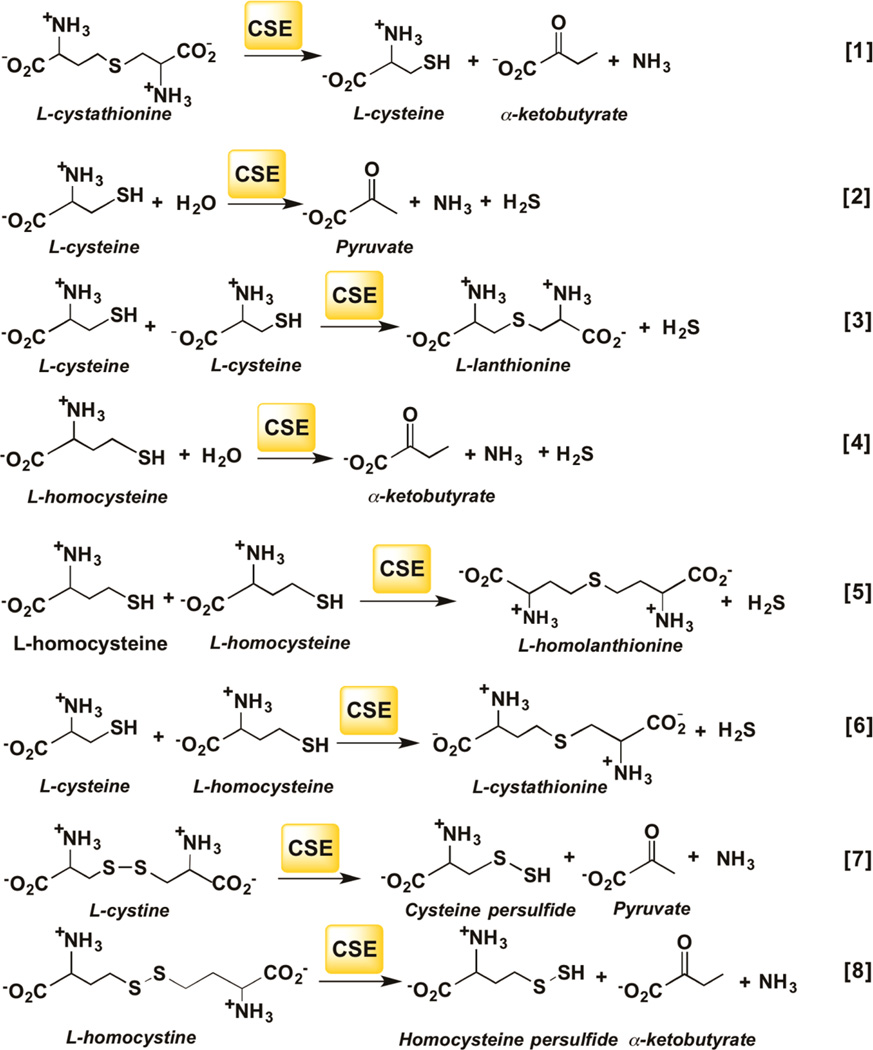
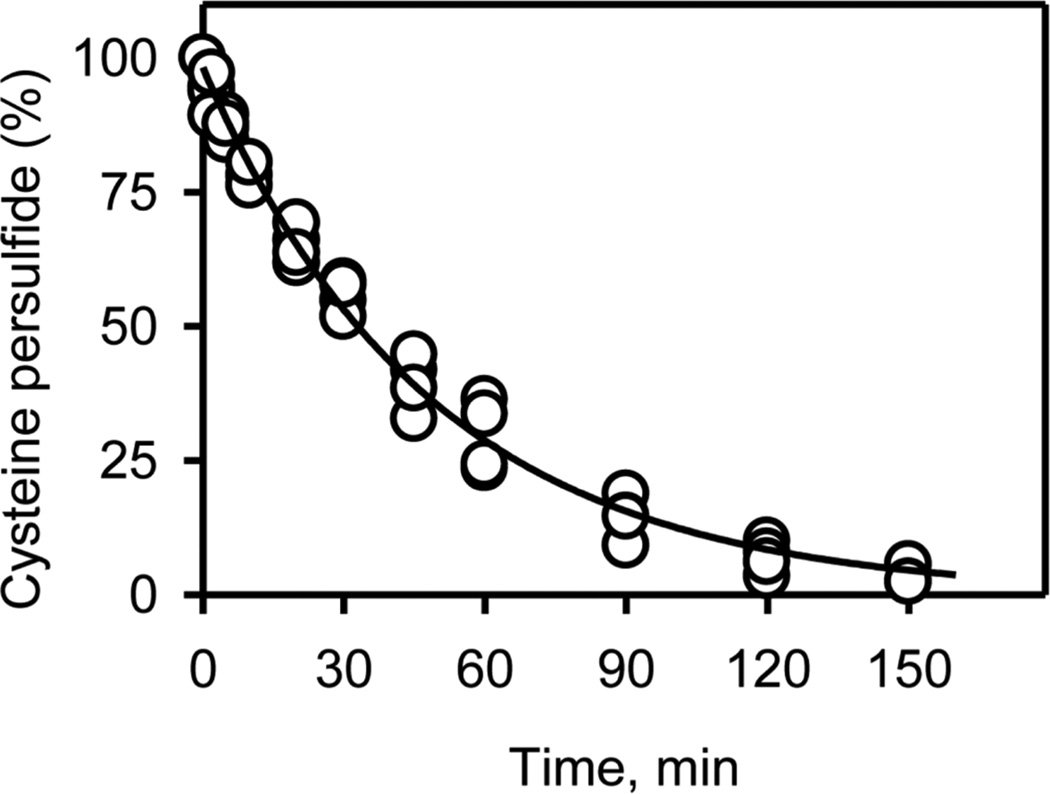
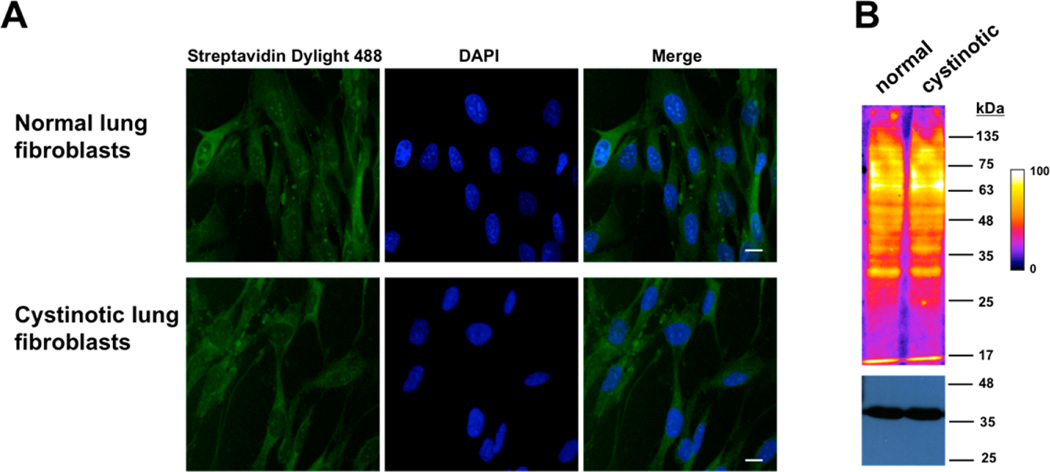
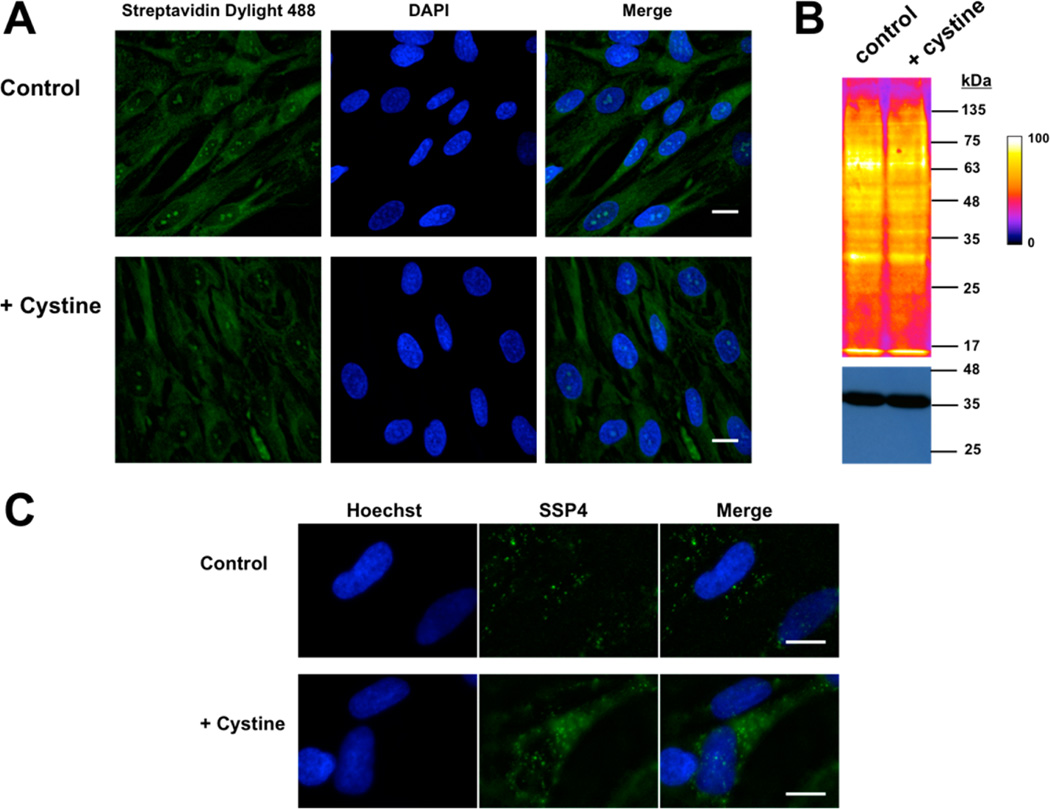
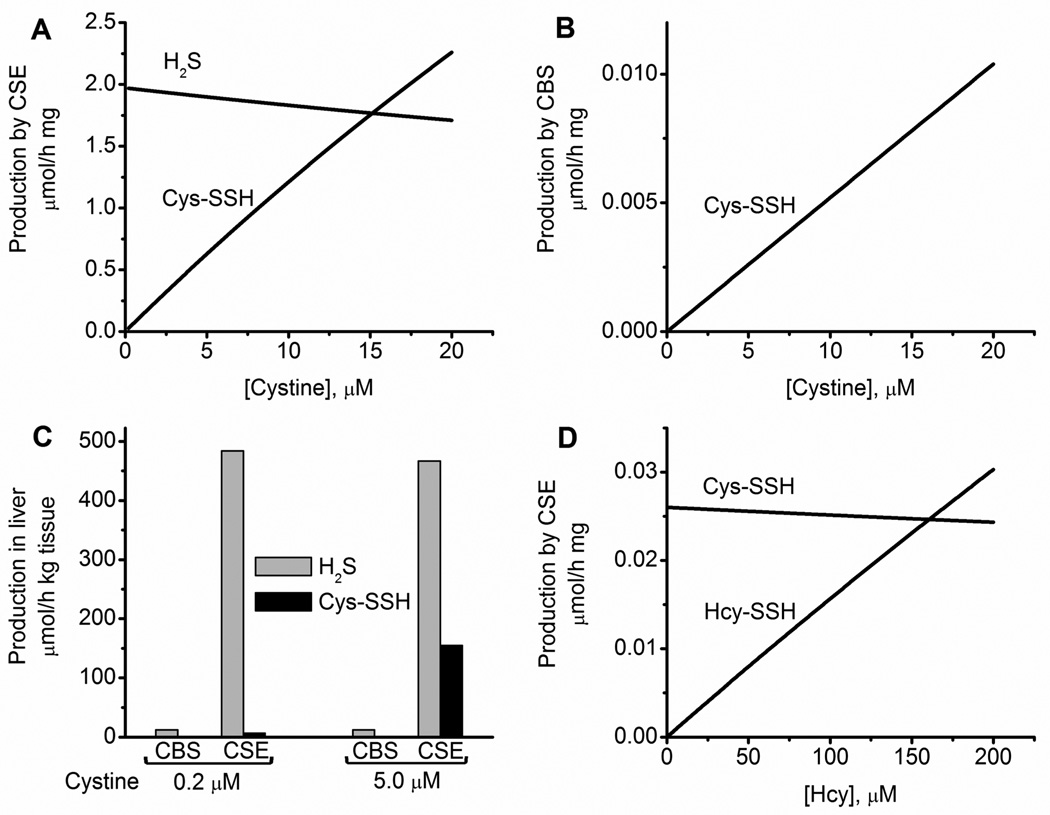
Hydrogen sulfide (H2S) elicits pleiotropic physiological effects ranging from modulation of cardiovascular to CNS functions. A dominant method for transmission of sulfide-based signals is via posttranslational modification of reactive cysteine thiols to persulfides. However, the source of the persulfide donor and whether its relationship to H2S is as a product or precursor is controversial. The transsulfuration pathway enzymes can synthesize cysteine persulfide (Cys-SSH) from cystine and H2S from cysteine and/or homocysteine. Recently, Cys-SSH was proposed as the primary product of the transsulfuration pathway with H2S representing a decomposition product of Cys-SSH. Our detailed kinetic analyses demonstrate a robust capacity for Cys-SSH production by the human transsulfuration pathway enzymes, cystathionine beta-synthase and γ-cystathionase (CSE) and for homocysteine persulfide synthesis from homocystine by CSE only. However, in the reducing cytoplasmic milieu where the concentration of reduced thiols is significantly higher than of disulfides, substrate level regulation favors the synthesis of H2S over persulfides. Mathematical modeling at physiologically relevant hepatic substrate concentrations predicts that H2S rather than Cys-SSH is the primary product of the transsulfuration enzymes with CSE being the dominant producer. The half-life of the metastable Cys-SSH product is short and decomposition leads to a mixture of polysulfides (Cys-S-(S)n-S-Cys). These in vitro data, together with the intrinsic reactivity of Cys-SSH for cysteinyl versus sulfur transfer, are consistent with the absence of an observable increase in protein persulfidation in cells in response to exogenous cystine and evidence for the formation of polysulfides under these conditions.


Figures

Figure 1
Figure 1
Reactions catalyzed by the transsulfuration pathway enzymes. (A) The canonical reactions catalyzed by CBS and CSE. (B) The preferred H2S-generating reactions via condensation of cysteine and homocysteine (by CBS) and α,β-elimination of cysteine (by CSE). (C) Formation of Cys−SSH from cystine by CBS or CSE and Hcy−SSH from homocystine by CSE.
Figure 2
Figure 2
Reactions catalyzed by CBS. CBS catalyzes the condensation of serine and homocysteine to give cystathionine and water [1] or reactions [2–4] that utilize cysteine to produce H2S. Reaction [5] leads to Cys−SSH synthesis from cystine.
Figure 3
Figure 3
Reactions catalyzed by CSE. CSE catalyzes the α,γ elimination of cystathionine [1]. Reactions [2–6] lead to the production of H2S. Reactions [7] and [8] lead to Cys−SSH and Hcy−SSH synthesis from cystine and homocystine, respectively.
Figure 4
Figure 4
Stability of Cys−SSH in buffer at physiological pH. The kinetics of decay of Cys−SSH formed in the CSE reaction was monitored using Ellman’s reagent as described under Methods. The data are the aggregate of three independent experiments and the line represents a single exponential fit giving a t½ for decay of 35 ± 3.5 min.
Figure 5
Figure 5
Visualization of persulfides in normal and cystinotic fibroblasts using the CN-biotin tag switch method. (A) Representative photomicrographs of normal and cystinotic human lung fibroblasts labeled with CN biotin tag-switch assay. The nuclei were stained with DAPI. (B) Intracellular persulfide levels in normal and cystinotic human lung fibroblast cell lysates, labeled using the CN-biotin tag switch reagent. Proteins were visualized using Streptavidin Dylight 488. Artificial color intensity was used and the gradient scale is shown on the right. GAPDH was used as a loading control (bottom). Scale bar: 20 µm.
Figure 6
Figure 6
Visualization of persulfides and polysulfides in normal fibroblasts in response to exogenous cystine treatment. (A) Photomicrographs of human lung fibroblasts cultured ±200 µM cystine for 1 h and labeled by the CN biotin tag-switch method. Nuclei were stained with DAPI. (B) Western blot analysis of proteins from (A) shows a similar labeling intensity in cells grown ± cystine supplementation. GAPDH was used as a loading control (bottom). (C) Representative photomicrographs show a clear increase in fluorescence in cells treated with cystine when probed with the SSP4 reagent. Nuclei were stained with Hoechst. Scale bar: 20 µm.
Figure 7
Figure 7
Simulation of H2S and LMW persulfide production rates by CBS and CSE in murine liver. Dependence of the specific rates of total H2S and Cys−SSH production by CSE (A) and of Cys−SSH production by CBS (B) on cystine concentration. A and B, show data from simulations at varying concentrations of cystine and at physiological concentrations of other metabolites (reported in Table 2). The simulations in A predict a modest decline in H2S production rate with increasing cystine concentration due to competition between cysteine and cystine for the CSE active site. (C). Simulated results comparing the rates of H2S and −SSH production by CBS and CSE in murine liver at two concentrations of cystine (0.2 and 5.0 µM) and physiologically relevant concentrations of other metabolites (reported in Table 2). The simulations took into account the difference in CBS and CSE protein levels and the experimentally determined rate of H2S production in murine liver., The rate of Cys−SSH production by CBS is too low to be visible. (D). Dependence of the specific rates of Cys−SSH and Hcy-SSH production by CSE on homocysteine [Hcy]. The concentration of homocystine was 5% that of homocysteine. The concentration of the other metabolites used for the simulations are reported in Table 2.

References

    1. Lavu M, Bhushan S, Lefer D. J. Clin. Sci. 2011;120:219. - PubMed
    1. Abe K, Kimura H. J. Neurosci. 1996;16:1066. - PMC - PubMed
    1. Kimura Y, Goto Y, Kimura H. Antioxid. Redox Signaling. 2010;12:1. - PubMed
    1. Kimura Y, Kimura H. FASEB J. 2004;18:1165. - PubMed
    1. Zanardo RC, Brancaleone V, Distrutti E, Fiorucci S, Cirino G, Wallace JL. FASEB J. 2006;20:2118. - PubMed

Publication types