. 2016 Jan 5;113(1):E7-15.
doi: 10.1073/pnas.1522193112. Epub 2015 Dec 14.

Contributions of microbiome and mechanical deformation to intestinal bacterial overgrowth and inflammation in a human gut-on-a-chip

Affiliations

Contributions of microbiome and mechanical deformation to intestinal bacterial overgrowth and inflammation in a human gut-on-a-chip

Hyun Jung Kim et al. Proc Natl Acad Sci U S A. .

Abstract

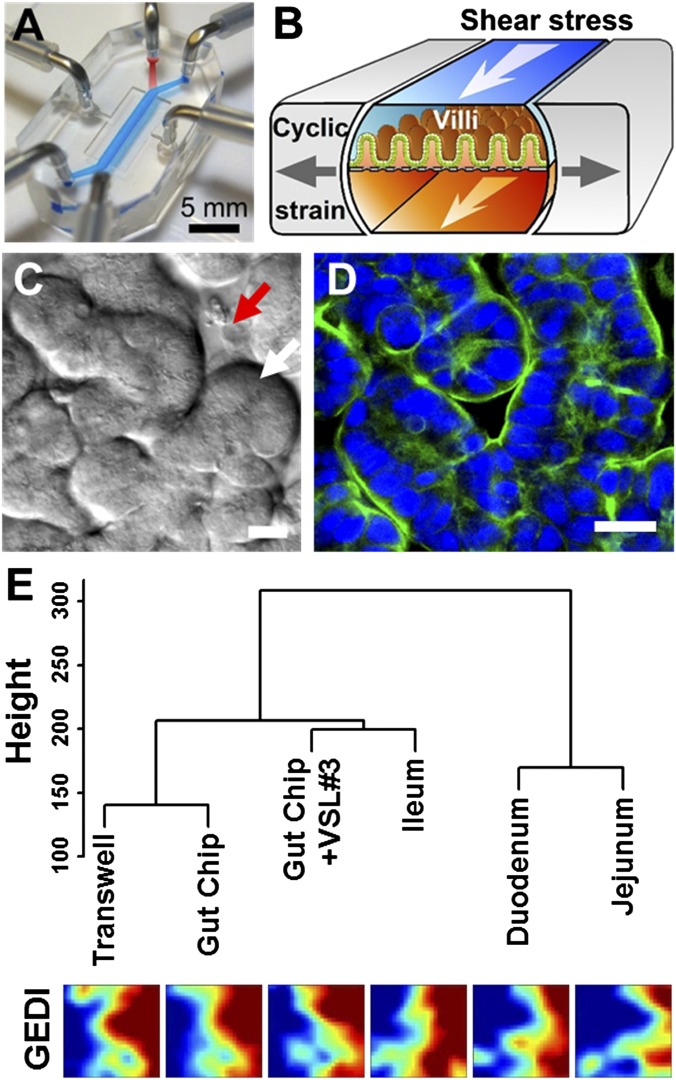
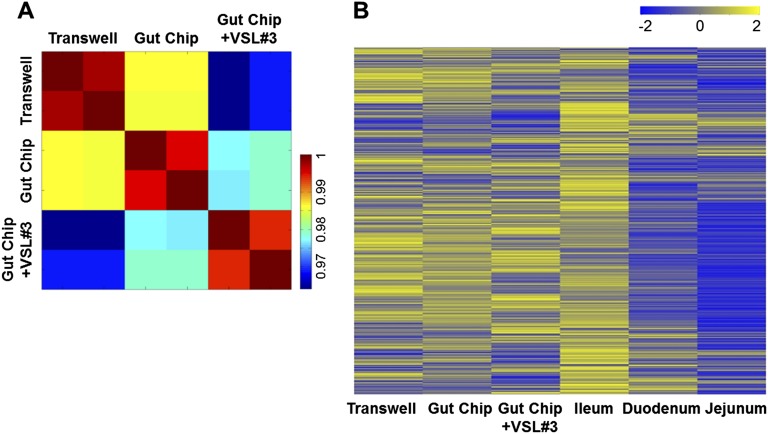
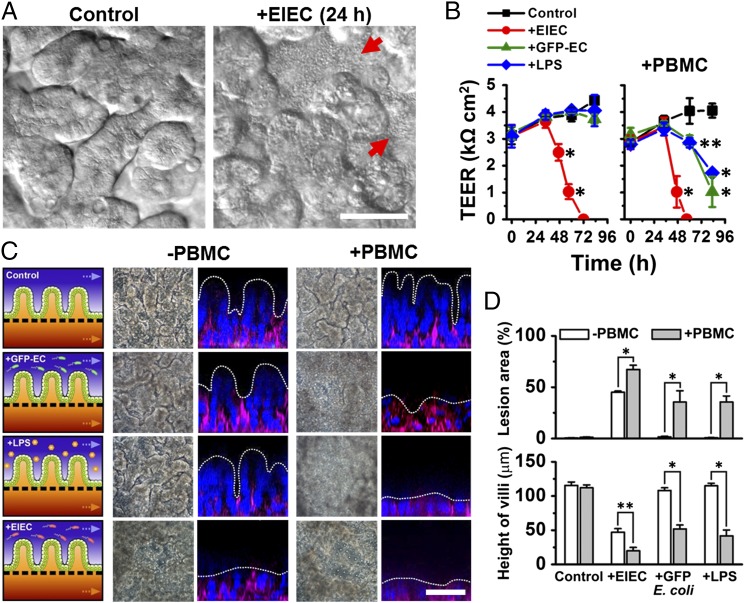
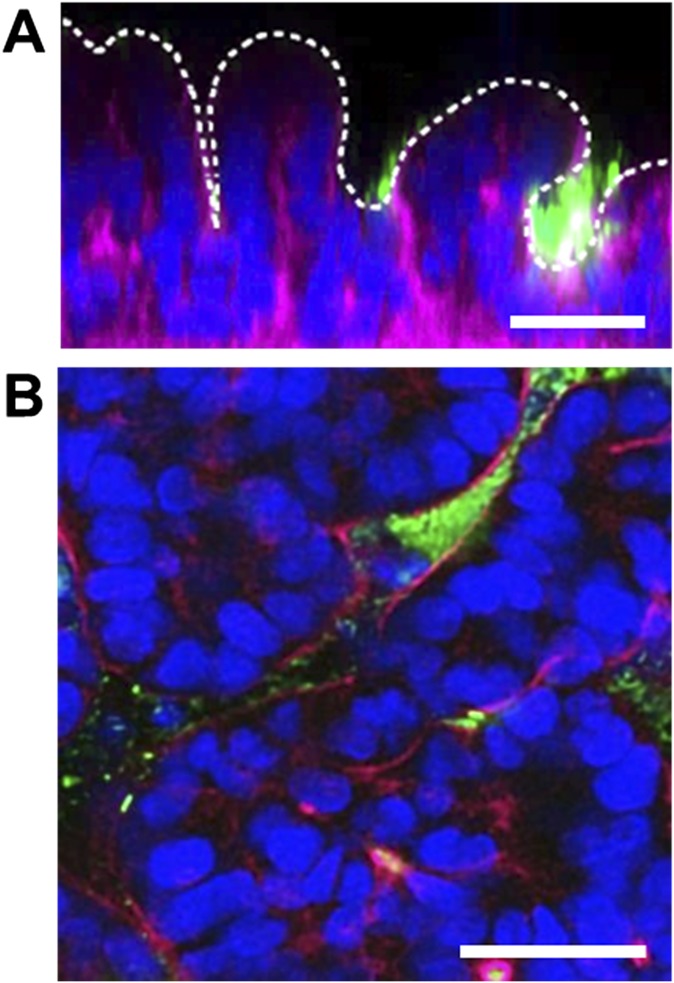
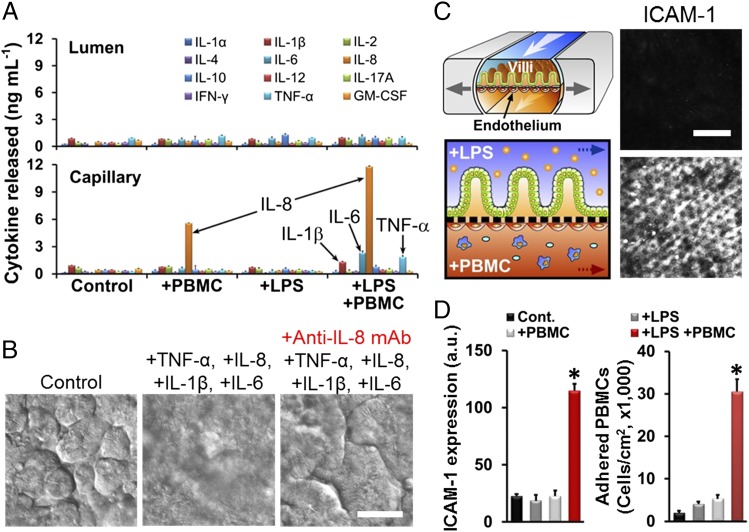
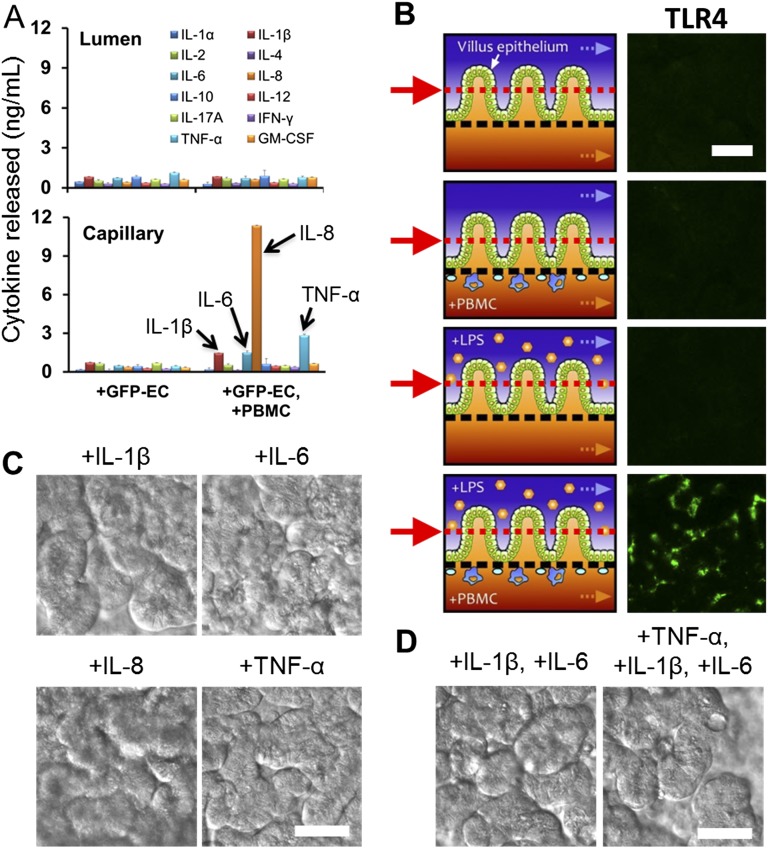
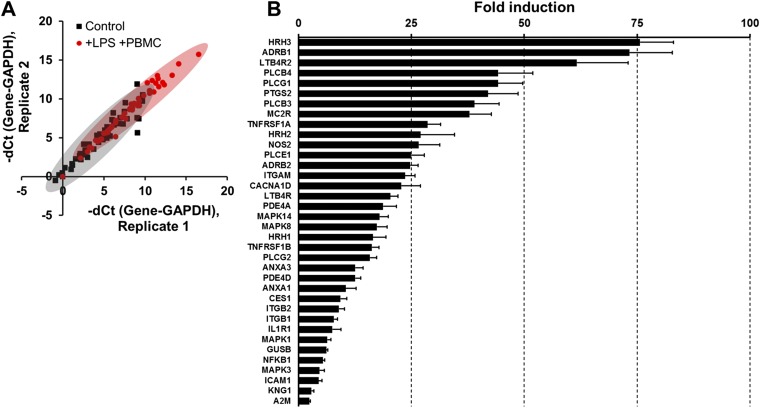
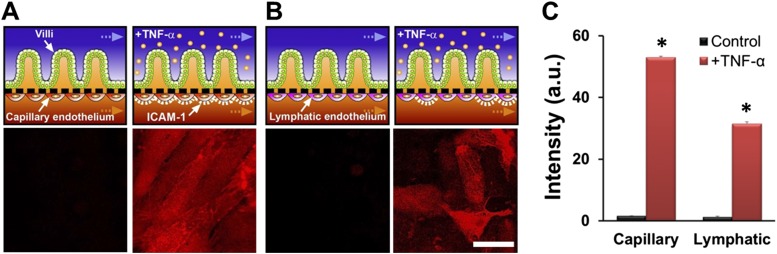
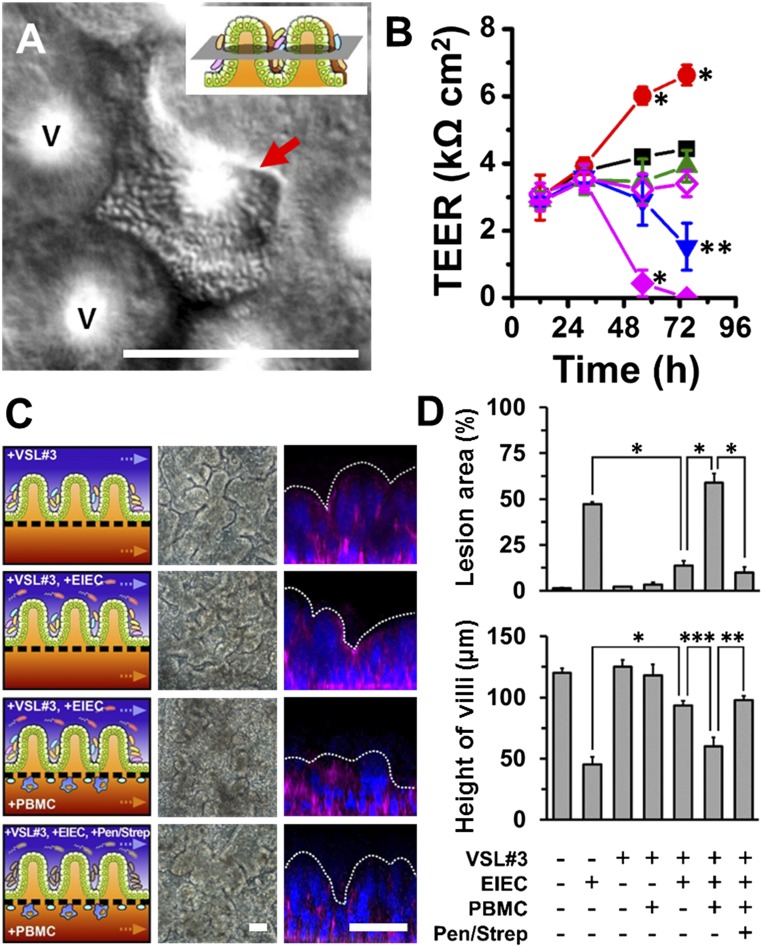
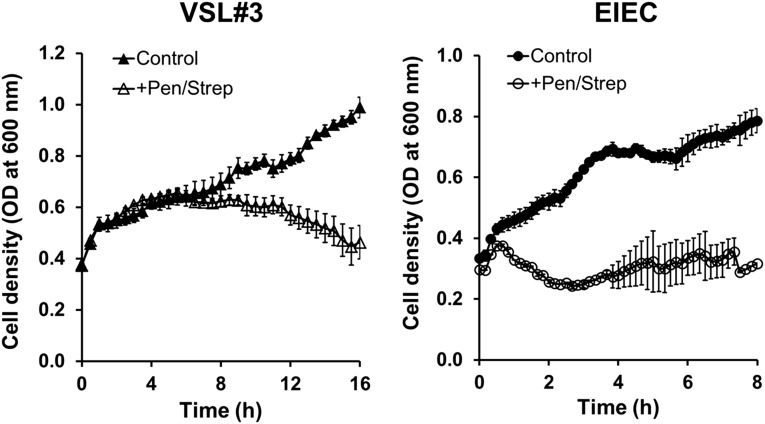
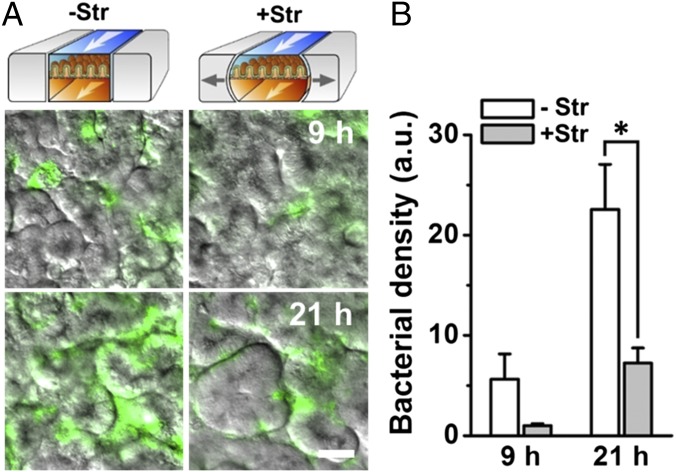
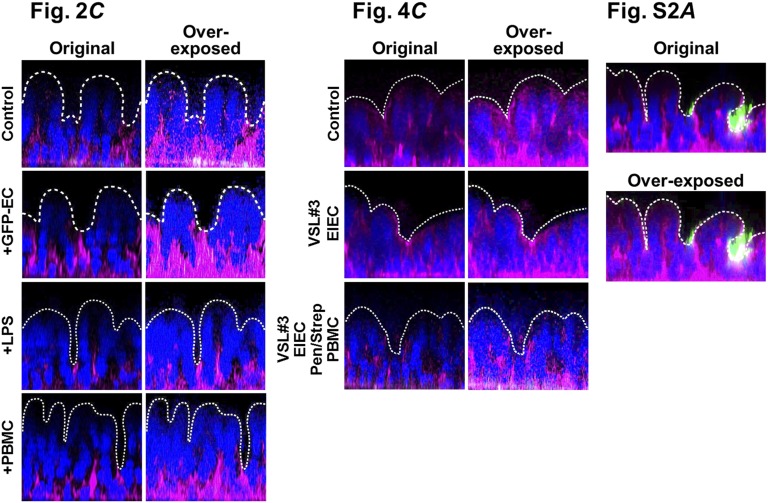
A human gut-on-a-chip microdevice was used to coculture multiple commensal microbes in contact with living human intestinal epithelial cells for more than a week in vitro and to analyze how gut microbiome, inflammatory cells, and peristalsis-associated mechanical deformations independently contribute to intestinal bacterial overgrowth and inflammation. This in vitro model replicated results from past animal and human studies, including demonstration that probiotic and antibiotic therapies can suppress villus injury induced by pathogenic bacteria. By ceasing peristalsis-like motions while maintaining luminal flow, lack of epithelial deformation was shown to trigger bacterial overgrowth similar to that observed in patients with ileus and inflammatory bowel disease. Analysis of intestinal inflammation on-chip revealed that immune cells and lipopolysaccharide endotoxin together stimulate epithelial cells to produce four proinflammatory cytokines (IL-8, IL-6, IL-1β, and TNF-α) that are necessary and sufficient to induce villus injury and compromise intestinal barrier function. Thus, this human gut-on-a-chip can be used to analyze contributions of microbiome to intestinal pathophysiology and dissect disease mechanisms in a controlled manner that is not possible using existing in vitro systems or animal models.

Keywords: gut-on-a-chip; inflammatory bowel disease; intestine; mechanical; microbiome.


Conflict of interest statement

Conflict of interest statement: D.E.I. is a founder of Emulate Inc., holds equity in the company, and chairs its Scientific Advisory Board.

Figures

Fig. 1.
Fig. 1.
The human gut-on-a-chip microfluidic device and changes in phenotype resulting from different culture conditions on-chip, as measured using genome-wide gene profiling. (A) A photograph of the device. Blue and red dyes fill the upper and lower microchannels, respectively. (B) A schematic of a 3D cross-section of the device showing how repeated suction to side channels (gray arrows) exerts peristalsis-like cyclic mechanical strain and fluid flow (white arrows) generates a shear stress in the perpendicular direction. (C) A DIC micrograph showing intestinal basal crypt (red arrow) and villi (white arrow) formed by human Caco-2 intestinal epithelial cells grown for ∼100 h in the gut-on-a-chip under medium flow (30 µL/h) and cyclic mechanical stretching (10%, 0.15 Hz). (Scale bar, 50 µm.) (D) A confocal immunofluorescence image showing a horizontal cross-section of intestinal villi similar to those shown in Fig. 1C, stained for F-actin (green) that labels the apical brush border of these polarized intestinal epithelial cells (nuclei in blue). (Scale bar, 50 µm.) (E) Hierarchical clustering analysis of genome-wide transcriptome profiles (Top) of Caco-2 cells cultured in the static Transwell, the gut-on-a-chip (with fluid flow at 30 µL/h and mechanical deformations at 10%, 0.15 Hz) (Gut Chip), or the mechanically active gut-on-a-chip cocultured with the VSL#3 formulation containing eight probiotic gut microbes (Gut Chip + VSL#3) for 72 h compared with normal human small intestinal tissues (Duodenum, Jejunum, and Ileum; microarray data from the published GEO database). The dendrogram was generated based on the averages calculated across all replicates, and all branches in the cluster have the approximately unbiased (AU) P value equal to 100. The y axis next to the dendrogram represents the metric for Euclidean distance between samples. Corresponding pseudocolored GEDI maps analyzing profiles of 650 metagenes between samples described above (Bottom).
Fig. S1.
Fig. S1.
Transcriptome profiling of Caco-2 cells grown in various culture conditions and comparison with the normal human small intestinal tissues. (A) Visual representation of a Pearson correlation analysis of pairwise comparisons between transcriptome profiles of Caco-2 cells cultured in the static Transwell, the gut-on-a-chip (Gut Chip) with peristalsis-like fluid flow (30 µL/h) and mechanical deformations (10%, 0.15 Hz), or the mechanically active gut-on-a-chip cocultured with the VSL#3 formulation containing eight probiotic gut microbes (Gut Chip +VSL#3) for 72 h. Each group has two biological replicates, where an individual square in the heat map represents 22,097 human relevant genes (color bar indicates the relative expression levels). (B) Transcriptome hierarchical clustering analysis of genome-wide gene profiles of Caco-2 cells shown in Fig. 1E and Fig. S1A (Transwell, Gut Chip, and Gut Chip +VSL#3) compared with normal human small intestinal tissues (Duodenum, Jejunum, and Ileum; microarray data from the published GEO database). Color bar indicates the z-score scaled gene expression levels.
Fig. 2.
Fig. 2.
Reconstitution of pathological intestinal injury induced by interplay between nonpathogenic or pathogenic enteroinvasive E. coli bacteria or LPS endotoxin with immune cells. (A) DIC images showing that the normal villus morphology of the intestinal epithelium cultured on-chip (Control) is lost within 24 h after EIEC (serotype O124:NM) are added to the apical channel of the chip (+EIEC; red arrows indicate bacterial colonies). (B) Effects of GFP-EC, LPS (15 µg/mL), EIEC, or no addition (Control) on intestinal barrier function (Left). Right shows the TEER profiles in the presence of human PBMCs (+PBMC). GFP-EC, LPS, and EIEC were added to the apical channel (intestinal lumen) at 4, 12, and 35 h, respectively, and PBMCs were subsequently introduced through the lower capillary channel at 44 h after the onset of experiment (0 h) (n = 4). (C) Morphological analysis of intestinal villus damage in response to addition of GFP-EC, LPS, and EIEC in the absence (−PBMC) or the presence of immune components (+PBMC). Schematics (experimental setup), phase contrast images (horizontal view, taken at 57 h after onset), and fluorescence confocal micrographs (vertical cross-sectional views at 83 h after onset) were sequentially displayed. F-actin and nuclei were coded with magenta and blue, respectively. (D) Quantification of intestinal injury evaluated by measuring changes in lesion area (Top; n = 30) and the height of the villi (Bottom; n = 50) in the absence (white) or the presence (gray) of PBMCs. Intestinal villi were grown in the gut-on-a-chip under trickling flow (30 µL/h) with cyclic deformations (10%, 0.15 Hz) during the preculture period for ∼100 h before stimulation (0 h, onset). Asterisks indicate statistical significance compared with the control at the same time point (*P < 0.001, **P < 0.05). (Scale bars, 50 µm.)
Fig. S2.
Fig. S2.
Fluorescence confocal micrographs of a vertical cross-section (A) and a horizontal cross-section (B) of microcolonies of GFP-labeled E. coli (GFP-EC; green) cultured on the intestinal epithelium (F-actin, magenta; nuclei, blue) on-chip for 2 d. White dotted line in A indicates the apical surface of the intestinal villi. Note that the bacteria preferentially inhabit the basal spaces between the villi. (Scale bars, 50 μm.)
Fig. S3.
Fig. S3.
Cellular composition of PBMCs isolated from fresh human blood analyzed by flow cytometry. A representative flow cytometric dot plot shows the gating strategy for analyzing a mixed population of immune cell subsets such as monocyte (M), lymphocyte (L), and granulocyte (G) from PBMCs based on forward- and side-light scattering. See SI Text, Flow Cytometry.
Fig. 3.
Fig. 3.
Tissue- and organ-level pathophysiological inflammatory responses of intestinal villus epithelium and vascular endothelium after being challenged with LPS and PBMCs. (A) Polarized secretion of proinflammatory cytokines after costimulation of LPS (15 µg/mL; for 32 h) and PBMCs (3.3 × 10⁶ cells per mL; for 12 h). The concentrations of IL-1β, IL-6, IL-8, and TNF-α secreted basolaterally were all significantly higher (P < 0.01) than in the control cultures (n = 3). (B) Villus injury caused by the treatment of four key proinflammatory cytokines (IL-1β, IL-6, IL-8, and TNF-α added at 3, 5, 15, and 4 ng/mL, respectively) and blocking effect of the anti-IL-8 monoclonal antibody (Anti-IL-8 mAb; 50 µg/mL) against the cytokine-induced villus injury. DIC images were recorded at 48 h after cytokine treatment. (C) The microenvironment of the tissue–tissue interface between the intestinal villus epithelium and vascular endothelium (Left Top) and the experimental design of studies involving challenge of this microenvironment with LPS and PBMCs (Left Bottom). Confocal microscopic fluorescence images show the ICAM-1 activation on the apical surface of the capillary endothelium in the absence (Right Top) or presence (Right Bottom) of both LPS (15 µg/mL) and PBMCs (3.3 × 10⁶ cells per mL). (D) Quantification of the ICAM-1 expression (Left) and the number of adherent PBMCs on the surface of the activated capillary endothelium (Right). Black, control; dark gray, LPS alone; light gray, PBMCs alone; red, simultaneous administration of LPS and PBMCs (*P < 0.001; n = 50). (Scale bars, 50 µm.)
Fig. S4.
Fig. S4.
Polarized secretion of proinflammatory cytokines in response to the stimulation of the GFP E. coli alone (+GFP-EC; seeding density ∼1.0 × 10⁷ cells per mL) or in the presence of PBMCs (+GFP-EC, +PBMC; 3.3 × 10⁶ cells per mL) measured by ELISA (A). The concentrations of IL-1β, IL-6, IL-8, and TNF-α secreted basolaterally were significantly higher (P < 0.01) than in the control cultures (n = 3). Intestinal villi were grown in the gut-on-a-chip at 40 µL/h in flow rate with cyclic deformations (10%, 0.15 Hz). (B) TLR4 expression on the villus epithelium. (Left) Schematics showing the experimental setup and (Right) immunofluorescence images showing that TLR4 was only expressed on the surface of the epithelium stimulated with LPS + PBMCs. Red arrows and matched dotted lines indicate the Z-position of the immunofluorescence image. Effects of individual (C) or partial combinations (D) of four cytokines (IL-1β, IL-6, IL-8, or TNF-α) on intestinal villus morphology. IL-1β, IL-6, IL-8, and TNF-α were added at 3, 5, 15, and 4 ng/mL, respectively, which correspond to the levels measured in the gut-on-a-chip in the presence of both LPS and PBMCs (Fig. 3A). DIC images were taken at 48 h after addition of the cytokine. (Scale bars, 50 µm.)
Fig. S5.
Fig. S5.
Profiling of genes involved in human inflammatory pathways for the microengineered intestinal villi challenged to LPS and PBMCs simultaneously in the gut-on-a-chip. (A) Expression profiling analysis of human inflammation-related genes expressed by the intestinal epithelium. Scatter spots shown in the correlation chart depict the individual genes in the nonstimulated villus epithelium (Control; black square) versus villus epithelium that was stimulated by LPS for 20 h followed by both LPS and PBMCs for an additional 20 h (+LPS +PBMC; red square). The delta threshold cycle (dCt) denotes the difference of the number of cycles that exceeds the baseline threshold between the gene of interest and a control gene (GAPDH). The averaged distribution of individual genes (n = 52) in each group was statistically significantly different (P < 0.0001) between the treated versus control groups. (B) A bar chart showing fold induction of genes relevant to human inflammation that exhibited statistically significant (n = 2, P < 0.05) increases in expression in villus epithelial cells challenged simultaneously with LPS and PBMCs compared with the nonstimulated control. These induced genes include alpha-2-Macroglobulin (A2M), beta-1 adrenergic receptor (ADRB1), beta-2 adrenergic receptor (ADRB2), annexin A1 (ANXA1), annexin A3 (ANXA3), calcium channel, voltage-dependent, L type, alpha 1D subunit (CACNA1D), carboxylesterase 1 (CES1), Beta-glucuronidase (GUSB), histamine H1 receptor (HRH1), histamine H2 receptor (HRH2), histamine H3 receptors (HRH3), intercellular adhesion molecule 1 (ICAM1), interleukin 1 receptor, type I (IL1R1), integrin alpha M (ITGAM), integrin beta-1 (ITGB1), integrin beta-2 (ITGB2), kininogen 1 (KNG1), leukotriene B4 receptor 1 (LTB4R), leukotriene B4 receptor 2 (LTB4R2), mitogen-activated protein kinase 1 (MAPK1), mitogen-activated protein kinase 3 (MAPK3), mitogen-activated protein kinase 8 (MAPK8), mitogen-activated protein kinase 14 (MAPK14), adrenocorticotropic hormone receptor (MC2R), nuclear factor NF-κ-B p105 subunit (NFKB1), nitric oxide synthase 2 (NOS2), cAMP-specific 3′,5′-cyclic phosphodiesterase 4A (PDE4A), cAMP-specific 3′,5′-cyclic phosphodiesterase 4D (PDE4D), 1-phosphatidylinositol-4,5-bisphosphate phosphodiesterase beta-3 (PLCB3), 1-phosphatidylinositol-4,5-bisphosphate phosphodiesterase beta-4 (PLCB4), 1-phosphatidylinositol-4,5-bisphosphate phosphodiesterase epsilon-1 (PLCE1), phospholipase C, gamma 1 (PLCG1), 1-phosphatidylinositol-4,5-bisphosphate phosphodiesterase gamma-2 (PLCG2), prostaglandin-endoperoxide synthase 2 (PTGS2), tumor necrosis factor receptor superfamily member 1A (TNFRSF1A), and tumor necrosis factor receptor superfamily member 1B (TNFRSF1B).
Fig. S6.
Fig. S6.
Responses of capillary or lymphatic endothelium to addition of the proinflammatory cytokine, TNF-α, into the lumen of the upper epithelial channel. Schematics (Top) and immunofluorescence confocal microscopic views (Bottom) show the organ-level tissue–tissue interface of intestinal villus epithelium and capillary endothelium (A) or lymphatic lacteal endothelium (B) cultured within the two adjacent microchannels in the gut-on-a-chip. Immunofluorescence staining for ICAM-1 revealed that epithelial stimulation with TNF-α (50 ng/mL) for 12 h induced endothelial activation and up-regulated expression of this surface adhesion receptor (red), which displayed a bright, uniform pattern of staining on the surface of the capillary endothelium (A, Right Bottom) and a more diffuse and punctate pattern on the lymphatic endothelium (B, Right Bottom). (Scale bar, 50 µm.) (C) Quantitation of the expression level of ICAM-1 on each endothelium (*P < 0.001; n = 50).
Fig. 4.
Fig. 4.
Probiotic gut bacteria protect against EIEC-induced, immune cell-associated intestinal injury on-chip. (A) A DIC micrograph showing a viable microcolony of multispecies probiotic VSL#3 bacterial cells inhabiting the space between adjacent villi. V indicates the villi. (Inset) A schematic displaying the focal plane of the cross-sectional view. The image was recorded at 96 h after the VSL#3 cells were added to the villi. (B) Intestinal barrier function of control intestinal villus epithelium compared with epithelium exposed to probiotic VSL#3 bacteria alone (red circles) or to the copresence with EIEC (+VSL#3 +EIEC; blue inverted triangles), PBMCs (+VSL#3 +PBMC; green triangles), or both (+VSL#3 +EIEC +PBMC; filled magenta diamonds). Effect of the antibiotic mixture (100 units per mL penicillin and 100 µg/mL streptomycin) was tested before the addition of PBMCs (+VSL#3 +EIEC +Pen/Strep +PBMC; open magenta diamonds). We set onset time (at t = 0 h) when the VSL#3 cells were added; then EIEC, PBMCs, and antibiotics were added at 35 h, 45 h, and 44 h after onset, respectively. Asterisks indicate the statistical significance in each point compared with the control at the same time point (n = 4). (C) Morphological analysis of intestinal villus damage under the conditions described in Fig. 4B. The left, middle, and right columns show schematics, phase contrast images (taken at 57 h), and fluorescence confocal micrographs (vertical cross-sectional views) of villi recorded at 83 h after staining for F-actin (magenta) and nuclei (blue). (D) Quantification of intestinal injury evaluated by measuring changes in lesion area (Top; n = 30) and the height of the villi (Bottom; n = 50) in the absence or the presence of VSL#3, EIEC, PBMCs, or antibiotics, as indicated. Intestinal villi were grown for ∼100 h in the gut-on-a-chip with flow (40 µL/h) and cyclic deformation (10%, 0.15 Hz) before stimulation. *P < 0.001, **P < 0.01, ***P < 0.05. (Scale bars, 50 µm.)
Fig. S7.
Fig. S7.
Stochastic microbial niche of VSL#3 microbial cells on the microengineered villi. (A) A DIC micrograph visualizing the long-term coculture of VSL#3 on the intestinal villi on-chip, here shown 8 d after seeding of the VSL#3 cells. Red dotted circles indicate the location of the microbial niches. Two representative DIC images at lower (B) and higher (C) Z-positions showing the presence of live bacterial microcolonies (yellow dotted circles) at different locations along the crypt-villus axis. (Scale bar, 50 µm.)
Fig. S8.
Fig. S8.
PBMCs alone do not cause pathological villus destruction during the coculture with commensal VSL#3 gut bacteria. A schematic of the experimental design (Left) and a representative phase contrast image (Right) showing that villi remained morphologically intact when precolonized with probiotic VSL#3 for 56 h and subsequently challenged to PBMCs for 40 h. (Scale bar, 50 µm.)
Fig. S9.
Fig. S9.
Graphs show that both VSL#3 (Left) and EIEC (Right) bacterial cells do not grow in the presence of antibiotics. Each bacterial strain was independently cultured in the cell culture medium (DMEM, 20% FBS) in the absence (Control; filled symbols) or the presence of a mixture of penicillin (100 units per mL) and streptomycin (100 µg/mL) (+Pen/Strep; open symbols). VSL#3 and EIEC cell densities were estimated by measuring optical density at 600 nm (n = 5).
Fig. 5.
Fig. 5.
Bacterial overgrowth induced on-chip by cessation of peristalsis-like mechanical deformations. (A) Overlaid fluorescence and DIC microscopic views showing growth of GFP-EC (seeding density ∼1.0 × 10⁷ cells per mL) on the intestinal villi in the gut-on-a-chip in the absence (−Str) or presence (+Str) of cyclic stretching motions (10% in cell strain, 0.15 Hz in frequency) after 9 h and 21 h of culture. (B) Bacterial density on villi measured by quantitating changes in the fluorescence intensity of GFP-EC in the absence (white) or presence (gray) of mechanical deformation. n = 10; *P < 0.001. (Scale bar, 50 µm.)
Fig. S10.
Fig. S10.
Identification of the contours of apical surface of the villus epithelia presented in Figs. 2C and 4C and Fig. S2A. Each fluorescence image highlighting nuclei (blue) and F-actin (magenta) was overexposed to identify the entire cell mass and the upper boundary of the villi. Then its position was indicated with a white dotted line in the same position on the final normally exposed images.

References

    1. Rutgeerts P, et al. Natural history of recurrent Crohn’s disease at the ileocolonic anastomosis after curative surgery. Gut. 1984;25(6):665–672. - PMC - PubMed
    1. Round JL, Mazmanian SK. The gut microbiota shapes intestinal immune responses during health and disease. Nat Rev Immunol. 2009;9(5):313–323. - PMC - PubMed
    1. Kaser A, Zeissig S, Blumberg RS. Inflammatory bowel disease. Annu Rev Immunol. 2010;28:573–621. - PMC - PubMed
    1. Gayer CP, Basson MD. The effects of mechanical forces on intestinal physiology and pathology. Cell Signal. 2009;21(8):1237–1244. - PMC - PubMed
    1. Ohama T, Hori M, Ozaki H. Mechanism of abnormal intestinal motility in inflammatory bowel disease: How smooth muscle contraction is reduced? J Smooth Muscle Res. 2007;43(2):43–54. - PubMed

Publication types

MeSH terms