. 2015 Dec 29;112(52):16036-41.
doi: 10.1073/pnas.1507552112. Epub 2015 Dec 14.

Frequency preference and attention effects across cortical depths in the human primary auditory cortex

Affiliations

Frequency preference and attention effects across cortical depths in the human primary auditory cortex

Federico De Martino et al. Proc Natl Acad Sci U S A. .

Abstract

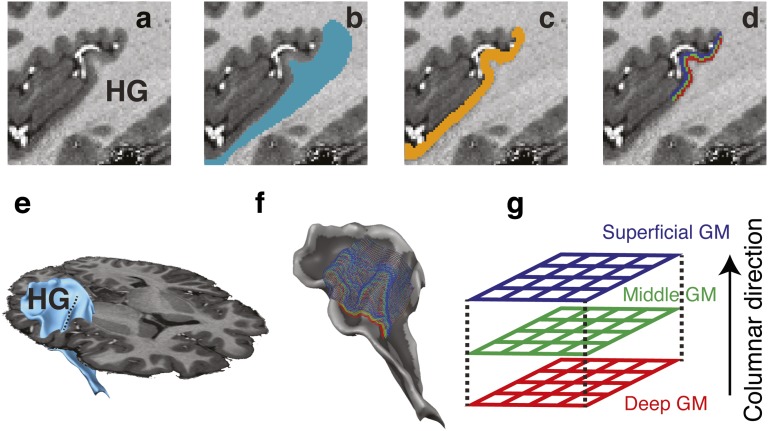
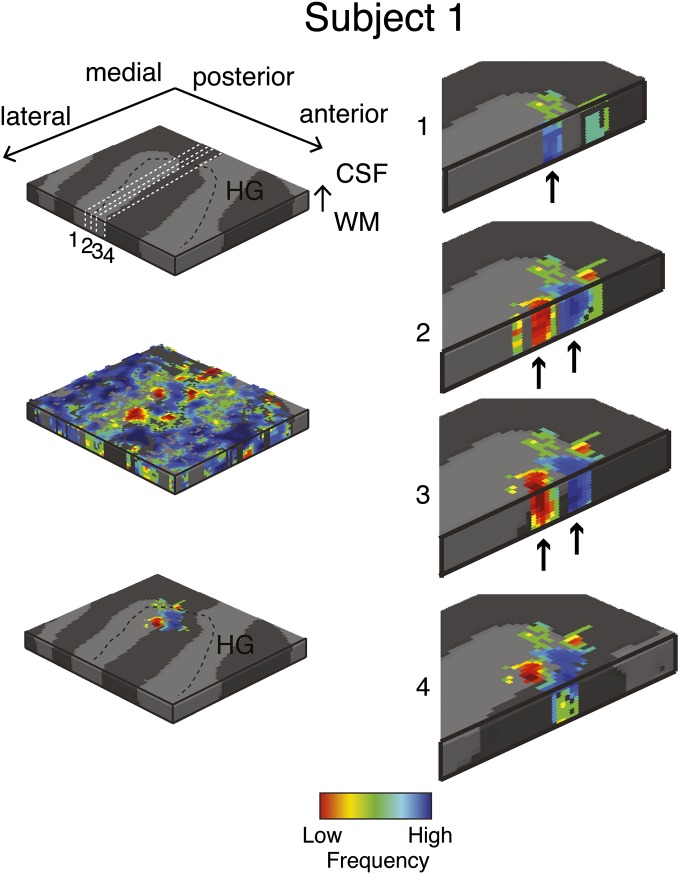
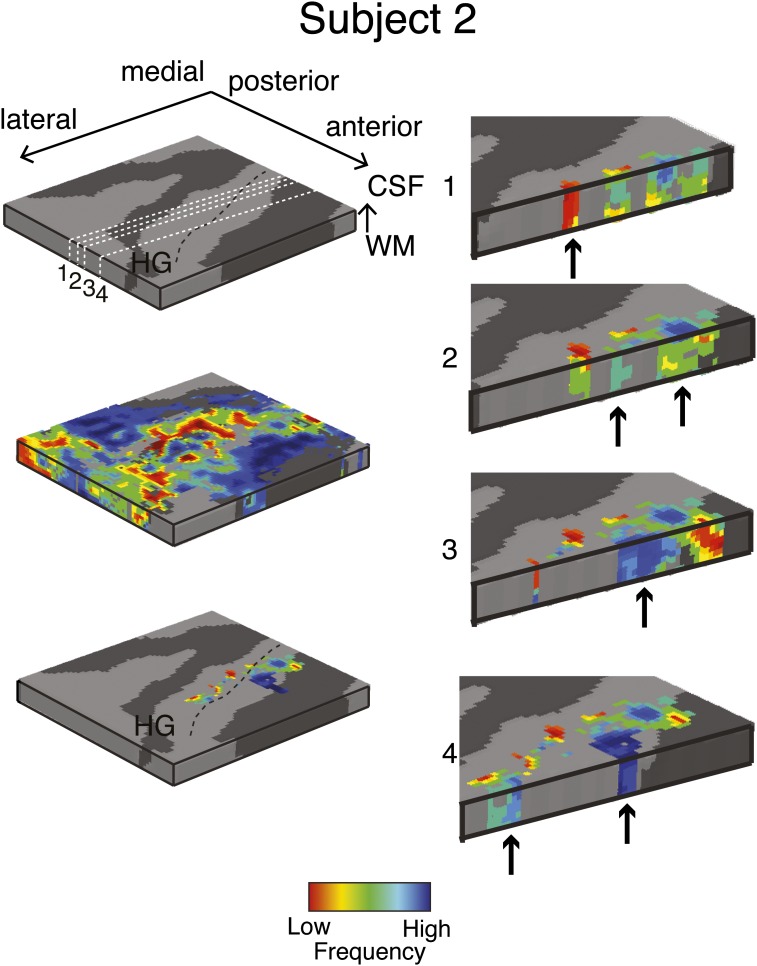
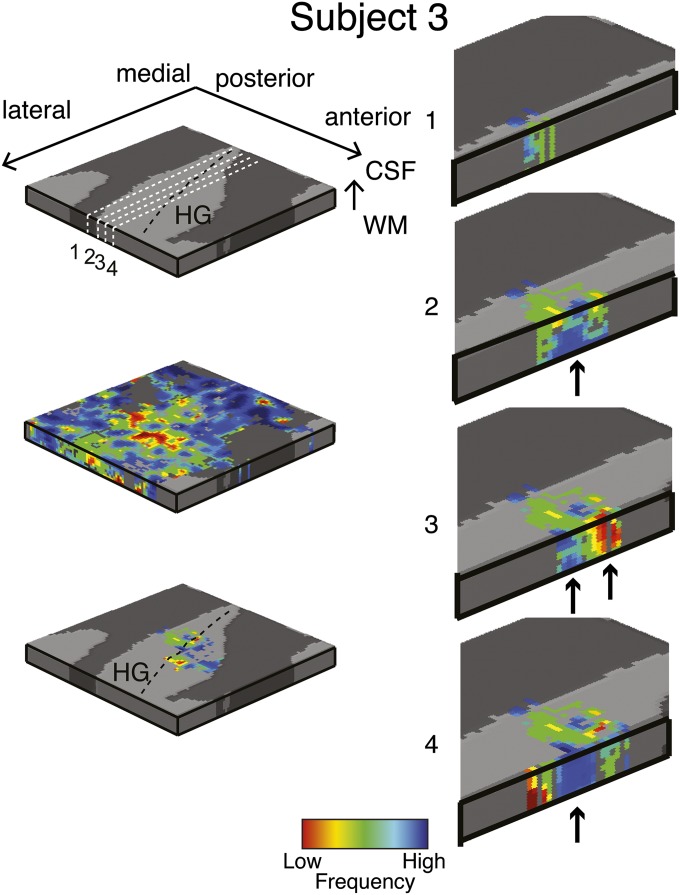
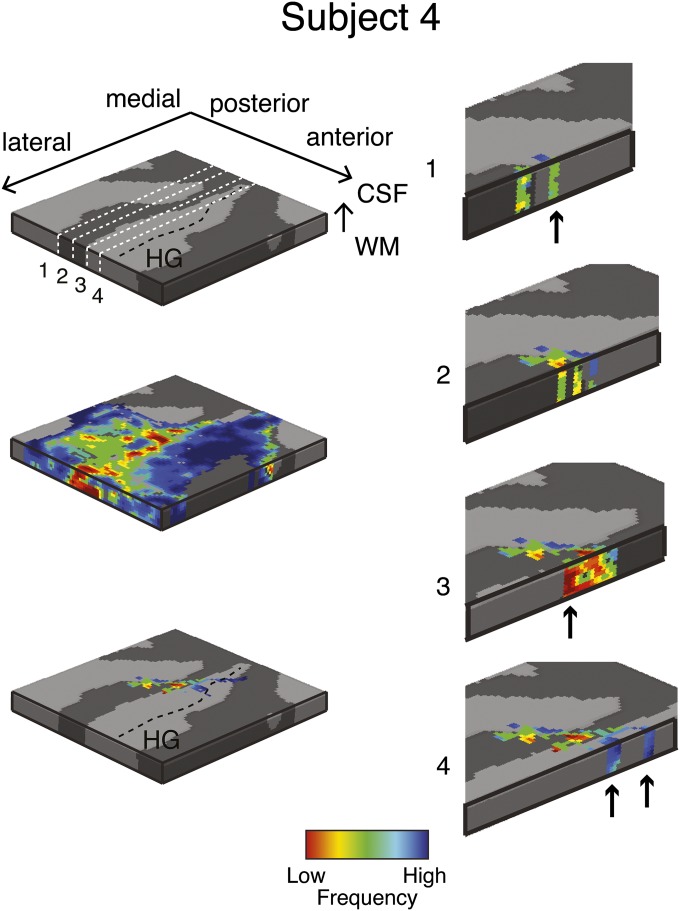
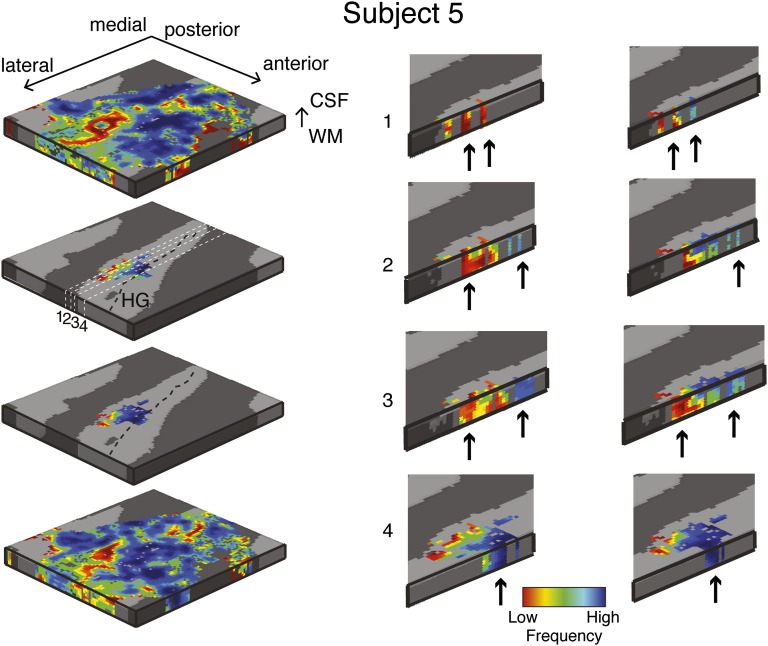
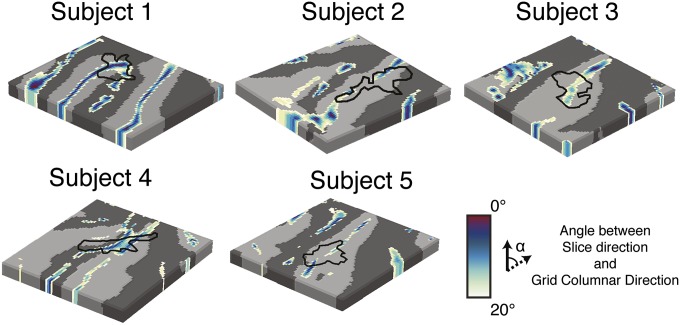
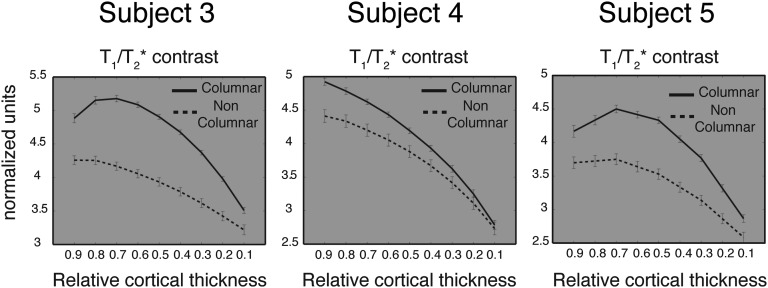
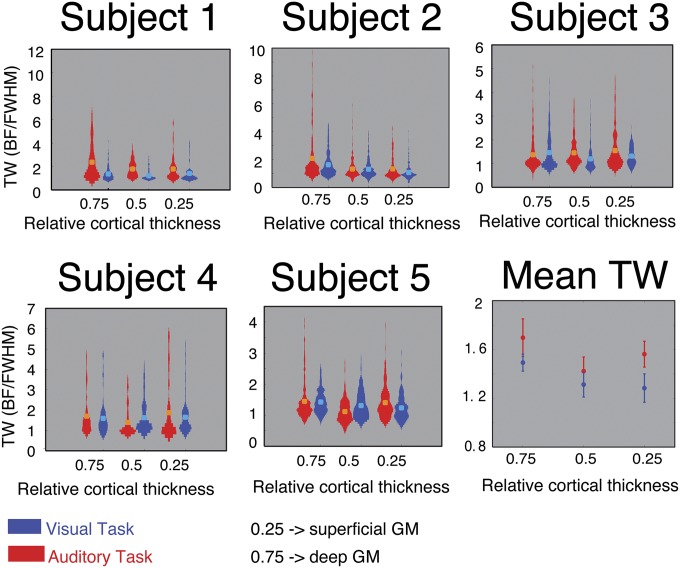
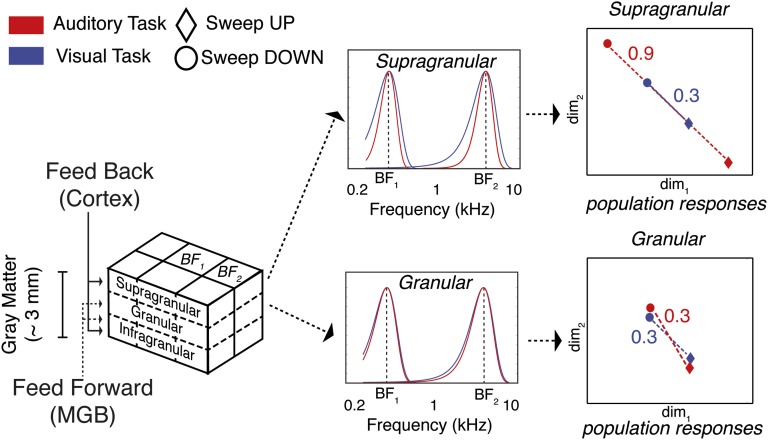
Columnar arrangements of neurons with similar preference have been suggested as the fundamental processing units of the cerebral cortex. Within these columnar arrangements, feed-forward information enters at middle cortical layers whereas feedback information arrives at superficial and deep layers. This interplay of feed-forward and feedback processing is at the core of perception and behavior. Here we provide in vivo evidence consistent with a columnar organization of the processing of sound frequency in the human auditory cortex. We measure submillimeter functional responses to sound frequency sweeps at high magnetic fields (7 tesla) and show that frequency preference is stable through cortical depth in primary auditory cortex. Furthermore, we demonstrate that-in this highly columnar cortex-task demands sharpen the frequency tuning in superficial cortical layers more than in middle or deep layers. These findings are pivotal to understanding mechanisms of neural information processing and flow during the active perception of sounds.

Keywords: 7-Tesla; columns; depth-dependent; fMRI; tonotopy.


Conflict of interest statement

The authors declare no conflict of interest.

Figures

Fig. 1.
Fig. 1.
Illustration of the anatomical segmentation procedure. Anatomical images (A) are segmented to identify the white matter (B) and gray matter (C) in the region of interest [Heschl’s gyrus (HG)]. The white/gray matter boundary is used to reconstruct 3D surfaces [blue in E; with cortical curvature (light gray, gyrus; dark gray, sulcus) in F]. The gray matter region is used to estimate the cortical thickness and obtain regularly spaced grids (n = 3; red, green, and blue in D, F, and G) used to evaluate the distribution of functional responses orthogonally to the white/gray matter boundary (i.e., columnar direction).
Fig. 2.
Fig. 2.
Single-subject (subject 3 and subject 4) results. The overall response to the sounds (F-Map; FDR corrected q < 0.05), intracortical anatomical contrast related to myelin (T1/T2*), and tonotopic maps (auditory task, visual task, and average) are projected on the individual surface reconstruction of the right temporal cortex. For all other subjects, see Fig. S1.
Fig. S1.
Fig. S1.
Single-subject results. The overall response to the sounds (F-Map; FDR corrected q < 0.05), intracortical anatomical contrast related to myelin (T1/T2*), and tonotopic maps (auditory task, visual task, and average) are projected on the individual surface reconstruction of the right temporal cortex.
Fig. 3.
Fig. 3.
Single-subject columnar analysis. Tonotopic maps are computed in the grid space of the right HG. Permutation testing is used to determine grid locations with a significant (P < 0.05) columnar tonotopic arrangement (Bottom Left). (Right) Mediolateral cuts through HG and displays the vertical distribution of frequency preference in the columnar region. Arrows indicate example locations with high similarity in BF across cortical depths within the columnar region. For all other subjects, see Figs. S2–S6 and Movies S1–S6.
Fig. S2.
Fig. S2.
Single-subject (subject 1) columnar analysis. Tonotopic maps were computed in the grid space of the right Heschl’s gyrus (HG, see Top Left for anatomical information). Permutation testing was used to determine grid locations with significant (P < 0.05) columnar tonotopic arrangement (Bottom Left). To highlight the vertical distribution of frequency preference, the columnar region is presented through four cuts in the medial-to-lateral direction of the grid space (Right). Arrows indicate example locations with high similarity in best frequency across cortical depths within the columnar region.
Fig. S3.
Fig. S3.
Single-subject (subject 2) columnar analysis. Tonotopic maps were computed in the grid space of the right Heschl’s gyrus (HG, see Top Left for anatomical information). Permutation testing was used to determine grid locations with significant (P < 0.05) columnar tonotopic arrangement (Bottom Left). To highlight the vertical distribution of frequency preference, the columnar region is presented through four cuts in the medial-to-lateral direction of the grid space (Right). Arrows indicate example locations with high similarity in best frequency across cortical depths within the columnar region.
Fig. S4.
Fig. S4.
Single-subject (subject 3) columnar analysis. Tonotopic maps were computed in the grid space of the right Heschl’s gyrus (HG) (see Top Left for anatomical information). Permutation testing was used to determine grid locations with significant (P < 0.05) columnar tonotopic arrangement (Bottom Left). To highlight the vertical distribution of frequency preference, the columnar region is presented through four cuts in the medial-to-lateral direction of the grid space (Right). Arrows indicate example locations with high similarity in best frequency across cortical depths within the columnar region.
Fig. S5.
Fig. S5.
Single-subject (subject 4) columnar analysis. Tonotopic maps were computed in the grid space of the right Heschl’s gyrus (HG) (see Top Left for anatomical information). Permutation testing was used to determine grid locations with significant (P < 0.05) columnar tonotopic arrangement (Bottom Left). To highlight the vertical distribution of frequency preference, the columnar region is presented through four cuts in the medial-to-lateral direction of the grid space (Right). Arrows indicate example locations with high similarity in best frequency across cortical depths within the columnar region.
Fig. S6.
Fig. S6.
Single-subject (subject 5) reproducibility of columnar analysis. Tonotopic maps of two separate sessions (Top Left and Bottom Left) were computed in the grid space of the right HG. Permutation testing was used to determine grid locations with a significant (P < 0.05) columnar tonotopic arrangement (two Middle Left panels). To highlight the vertical distribution of frequency preference, the columnar region is presented through four cuts in the medial-to-lateral direction of the grid space (session 1, Middle column; session 2, Right column). Arrows indicate example locations with high similarity in best frequency across cortical depths within the columnar region.
Fig. S7.
Fig. S7.
Comparison of columnar region and slice acquisition direction. The angle (α) between the slice acquisition direction and the columnar direction of the grid is mapped for every single subject. The region with significant columnar tonotopic organization is outlined in black. The columnar region does not correspond fully to regions that are characterized by a small angle with respect to the direction of the slices in the acquisition. This result indicates that our results cannot be explained by the potential acquisition-induced blurring in this direction.
Fig. S8.
Fig. S8.
Depth-dependent (deep gray matter – relative cortical thickness = 0.9); superficial gray matter – relative cortical thickness = 0.1) anatomical contrast (T1/T2*) in the columnar region (full line) and noncolumnar regions (dashed line). Note that the columnar region exhibits stronger anatomical contrast (i.e., more myelin-related signal) in the deep cortex, a characteristic of primary-like sensory areas. This result demonstrates that the columnar region is situated in the primary auditory cortex.
Fig. 4.
Fig. 4.
Task-dependent modulation of tuning width across cortical depths. Single-subject distributions are presented together with subjects’ mean TW value (orange and cyan dots). The mean across subjects (Bottom Right) is presented together with error bars indicating the SE across subjects. At superficial cortical depths (0.25 relative cortical thickness), TW values were significantly higher for the auditory task compared with the visual task, indicating narrower tuning (P < 0.05; paired t test).
Fig. 5.
Fig. 5.
Effect of frequency tuning width sharpening on the population responses to upward and downward sweeps. The pattern of cortical depth-dependent inputs to a columnar region of primary auditory cortex (5, 40) is summarized on the Left. For two different cortical depths (i.e., supragranular and granular), the frequency response of different units is simulated as a Gaussian function with mean equal to the BF and full width at half maximum (FWHM = BF/TW) equal to the value empirically estimated from our fMRI data. The task modulation (red, auditory task; blue, visual task) acts on the TW: i.e., sharpens the frequency response in the supragranular but not in the granular layer. Average responses to upward and downward sweeps (circles and diamonds, respectively) are represented using 2D multidimensional scaling. As a result of the sharpening, the Euclidean distance between upward and downward sweeps during the auditory task increases at the population level in the supragranular layers.

References

    1. Merzenich MM, Reid MD. Representation of the cochlea within the inferior colliculus of the cat. Brain Res. 1974;77(3):397–415. - PubMed
    1. De Martino F, et al. Spatial organization of frequency preference and selectivity in the human inferior colliculus. Nat Commun. 2013;4:1386. - PMC - PubMed
    1. Merzenich MM, Brugge JF. Representation of the cochlear partition of the superior temporal plane of the macaque monkey. Brain Res. 1973;50(2):275–296. - PubMed
    1. Formisano E, et al. Mirror-symmetric tonotopic maps in human primary auditory cortex. Neuron. 2003;40(4):859–869. - PubMed
    1. Winer JA, Schreiner CE, editors. The Auditory Cortex. Springer; New York: 2009.

Publication types

LinkOut - more resources