. 2016 May 1;193(9):1032-43.
doi: 10.1164/rccm.201508-1667OC.

AMP-activated Protein Kinase Deficiency Blocks the Hypoxic Ventilatory Response and Thus Precipitates Hypoventilation and Apnea

Affiliations

AMP-activated Protein Kinase Deficiency Blocks the Hypoxic Ventilatory Response and Thus Precipitates Hypoventilation and Apnea

Amira D Mahmoud et al. Am J Respir Crit Care Med. .

Abstract

Rationale: Modulation of breathing by hypoxia accommodates variations in oxygen demand and supply during, for example, sleep and ascent to altitude, but the precise molecular mechanisms of this phenomenon remain controversial. Among the genes influenced by natural selection in high-altitude populations is one for the adenosine monophosphate-activated protein kinase (AMPK) α1-catalytic subunit, which governs cell-autonomous adaptations during metabolic stress.

Objectives: We investigated whether AMPK-α1 and/or AMPK-α2 are required for the hypoxic ventilatory response and the mechanism of ventilatory dysfunctions arising from AMPK deficiency.

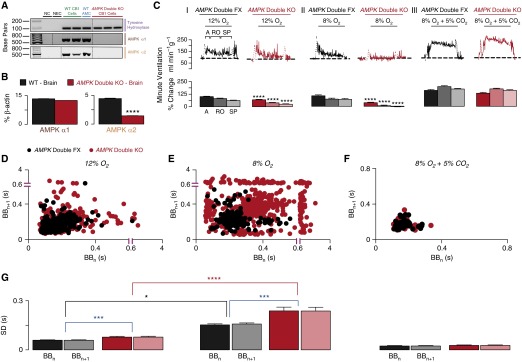
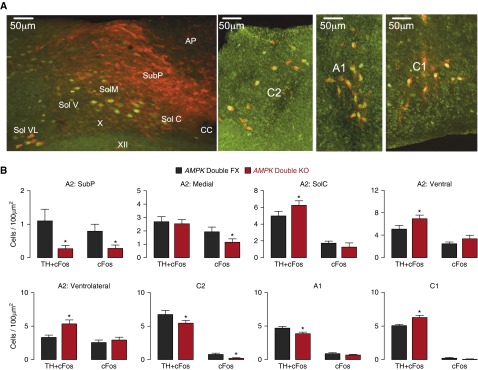
Methods: We used plethysmography, electrophysiology, functional magnetic resonance imaging, and immediate early gene (c-fos) expression to assess the hypoxic ventilatory response of mice with conditional deletion of the AMPK-α1 and/or AMPK-α2 genes in catecholaminergic cells, which compose the hypoxia-responsive respiratory network from carotid body to brainstem.

Measurements and main results: AMPK-α1 and AMPK-α2 deletion virtually abolished the hypoxic ventilatory response, and ventilatory depression during hypoxia was exacerbated under anesthesia. Rather than hyperventilating, mice lacking AMPK-α1 and AMPK-α2 exhibited hypoventilation and apnea during hypoxia, with the primary precipitant being loss of AMPK-α1 expression. However, the carotid bodies of AMPK-knockout mice remained exquisitely sensitive to hypoxia, contrary to the view that the hypoxic ventilatory response is determined solely by increased carotid body afferent input to the brainstem. Regardless, functional magnetic resonance imaging and c-fos expression revealed reduced activation by hypoxia of well-defined dorsal and ventral brainstem nuclei.

Conclusions: AMPK is required to coordinate the activation by hypoxia of brainstem respiratory networks, and deficiencies in AMPK expression precipitate hypoventilation and apnea, even when carotid body afferent input is normal.

Keywords: adenosine monophosphate–activated protein kinase; apnea; brainstem; hypoxia; ventilation.


Figures

Figure 1.
Figure 1.
Conditional deletion of adenosine monophosphate–activated protein kinase (AMPK) α-catalytic subunits in tyrosine hydroxylase–expressing cells markedly attenuates the hypoxic ventilatory response. (A) Single-cell endpoint reverse transcription–polymerase chain reaction amplicons for tyrosine hydroxylase and the catalytic α1- and α2-subunits of AMPK from acutely isolated carotid body type I (CB1) cells of wild-type (WT) and AMPK-α1/AMPK-α2 double-knockout (AMPK Double KO) mice. (B) Quantitative reverse transcription–polymerase chain reaction assays of AMPK-α1 and AMPK-α2 subunit expression of mouse brain as a percentage of β-actin from WT and AMPK-α1/AMPK-α2 double-knockout mice (n = 3). (C) Upper panels show example records of minute ventilation (in milliliters per minute per gram of body weight) versus time during (I) 12% O2, (II) 8% O2, and (III) 8% O2 with 5% CO2 for AMPK-α1/AMPK-α2 double-floxed (AMPK Double FX, black; n = 31) and AMPK-α1/AMPK-α2 double-knockout (AMPK Double KO, red; n = 22) mice. Lower panels show mean ± SEM for increase in minute ventilation for the peak of the augmenting phase (A), after 100 seconds of roll off (RO), and the plateau of the sustained phase (SP) of the response to hypoxia. ****P < 0.0001. (D–F) Exemplary Poincaré plots of the interbreath interval (BBn) versus subsequent interval (BBn+1) of AMPK-α1/AMPK-α2 double-floxed (AMPK Double FX, black) and AMPK-α1/AMPK-α2 double-knockout (AMPK Double KO, red) mice during (D) mild hypoxia (12% O2 + 0.05% CO2), (E) severe hypoxia (8% O2 + 0.05% CO2), and (F) hypoxia with hypercapnia (8% O2 + 5% CO2). (G) Corresponding mean ± SEM for the SD of BBn and BBn+1 for each genotype during 12% O2 (AMPK double FX, n = 31; AMPK double KO, n = 22), 8% O2 + 0.05% CO2 (AMPK Double FX, n = 12; AMPK Double KO, n = 19), and 8% O2 + 5% CO2 (AMPK Double FX, n = 20; AMPK Double KO, n = 29). *P < 0.05; ***P < 0.001; ****P < 0.0001. AMC = adrenomedullary chromaffin cells; NC = negative control (cell aspirant but no cell reverse transcriptase added); NEC = negative extracellular control (aspirant of extracellular medium).
Figure 2.
Figure 2.
Deletion of adenosine monophosphate–activated protein kinase (AMPK) precipitates hypoventilation and apnea. (A) Records of ventilatory activity obtained using whole-body plethysmography from AMPK-α1/AMPK-α2 double-floxed (AMPK Double FX; n = 31) and AMPK-α1/AMPK-α2 double-knockout (AMPK Double KO; n = 22) mice during (I) normoxia (21% O2), (II) hypoxia (8% O2), and (III) hypoxia with hypercapnia (8% O2 + 5% CO2). (BI and BII) Typical ventilatory records on an expanded time scale during hypoxia (8% O2). (CI and CII) Computational video analysis of thoracic movement (upper panels) with corresponding ventilatory traces (lower panels). (D) Mean ± SEM for (I) apneic index (per minute), (II) apnea duration (in seconds), and (III) apnea duration index (ADI) (frequency × duration) (AMPK Double FX, n = 31; AMPK Double KO, n = 22). *P < 0.05; **P < 0.01; ***P < 0.001; ****P < 0.0001.
Figure 3.
Figure 3.
Adenosine monophosphate–activated protein kinase (AMPK) deletion does not inhibit carotid body activation by hypoxia. Upper panels show extracellular recordings of single-fiber chemoafferent discharge versus Po2 for (A) AMPK-α1/AMPK-α2 double-floxed (AMPK Double FX) and (B) AMPK-α1/AMPK-α2 double-knockout (AMPK Double KO) mice. (Inset) Single-fiber discriminations. (Middle panels) Frequency × time histograms. (Lower panels) Frequency–Po2 response curves.
Figure 4.
Figure 4.
Functional magnetic resonance imaging demonstrates that adenosine monophosphate–activated protein kinase (AMPK) deletion inhibits activation by hypoxia of dorsal and ventral regions of the brainstem. (A) Example records of breathing frequency (breaths per minute) versus time during hypoxia (8% O2) for anesthetized AMPK-α1/AMPK-α2 double-floxed (AMPK Double FX, black; n = 6) and AMPK-α1/AMPK-α2 double-knockout (AMPK Double KO, red; n = 6) mice. (B) Mean ± SEM for change in breathing frequency during hypoxia. **P < 0.01. (C) Dorsal active region (DAR) and ventral active region (VAR) of brainstem that exhibited significantly lower signal change (P < 0.005) during hypoxia in AMPK Double KO than in Double FX control mice. (D) Variability of signal time courses for DAR and VAR are shown in blue for each individual mouse (same mice as in Figures 4A, lower panel) overlaid on mean signal for AMPK Double FX (black line) and AMPK Double KO (red line). AU = arbitrary units. (E) Mean ± SEM percentage signal changes for DAR and VAR during hypoxia (same mice as in Figure 4A, lower panel). *P < 0.05; **P < 0.01.
Figure 5.
Figure 5.
Adenosine monophosphate–activated protein kinase (AMPK) deletion attenuates c-fos expression in discrete areas of the nucleus tractus solitarius and ventrolateral medulla. (A) Immunostaining of a brainstem section derived from an AMPK-α1/AMPK-α2 double-knockout mouse (AMPK Double KO) shows c-Fos (green) and tyrosine hydroxylase (TH, red) staining in the A2 and C2 regions of the nucleus of the solitary tract as well as in the ventrolateral C1/A1 region. Scale bar = 50 μm. (B) Bar charts show for each region shown in A the number of TH-positive and TH-negative cells per 100 μm2 in which c-Fos expression increased during hypoxia (8% O2) for AMPK-α1/AMPK-α2 double-floxed mice (AMPK Double FX, black; n = 19 sections, n = 6 mice) and AMPK Double KO mice (red; n = 17 sections, n = 6 mice). *P < 0.01. AP = area postrema; CC = central canal; SolC = commissural, SolM = medial, SolV = ventral, SolVL = ventrolateral, and SubP = subpostrema regions of the nucleus of the solitary tract; X = dorsal motor nucleus of the vagus; XII = hypoglossal nucleus.
Figure 6.
Figure 6.
Respiratory dysfunction during hypoxia is mediated primarily by loss of the adenosine monophosphate–activated protein kinase (AMPK) α1-catalytic subunit. Exemplary Poincaré plots of the interbreath interval (BBn) versus subsequent interval (BBn+1) for mice with AMPK-α1/AMPK-α2 double floxed (AMPK Double FX; n = 31), AMPK-α2 knockout (AMPK-α2 KO; n = 16), AMPK-α1 knockout (AMPK-α1 KO; n = 19), and AMPK-α1/AMPK-α2 double knockout (AMPK Double KO; n = 22) during (AI) normoxia (21% O2) and (BI) hypoxia (8% O2). (AII and BII) Corresponding mean ± SEM for the SD of BBn and BBn+1 for each genotype under normoxia and 8% O2. (C) Mean ± SEM for (I) apneic index (per minute), (II) apnea duration (in seconds), and (III) apnea duration index (ADI). (D) Increases in minute ventilation relative to normoxia at the peak of the augmenting phase (A), after 100 seconds of roll off (RO), and the plateau of the sustained phase (SP) of the response to hypoxia. *P < 0.05; **P < 0.01; ***P < 0.001; ****P < 0.0001.
Figure 7.
Figure 7.
Schematic describing the new hypothesis on the integration by adenosine monophosphate–activated protein kinase (AMPK) of local and applied metabolic stresses. AP = area postrema; NTS = nucleus tractus solitarius.

Comment in

Similar articles

Cited by

References

    1. Hardie DG. AMPK—sensing energy while talking to other signaling pathways. Cell Metab. 2014;20:939–952. - PMC - PubMed
    1. Gowans GJ, Hawley SA, Ross FA, Hardie DG. AMP is a true physiological regulator of AMP-activated protein kinase by both allosteric activation and enhancing net phosphorylation. Cell Metab. 2013;18:556–566. - PMC - PubMed
    1. Sakamoto K, McCarthy A, Smith D, Green KA, Hardie DG, Ashworth A, Alessi DR. Deficiency of LKB1 in skeletal muscle prevents AMPK activation and glucose uptake during contraction. EMBO J. 2005;24:1810–1820. - PMC - PubMed
    1. Woods A, Dickerson K, Heath R, Hong SP, Momcilovic M, Johnstone SR, Carlson M, Carling D. Ca2+/calmodulin-dependent protein kinase kinase-β acts upstream of AMP-activated protein kinase in mammalian cells. Cell Metab. 2005;2:21–33. - PubMed
    1. Evans AM. AMP-activated protein kinase and the regulation of Ca2+ signalling in O2-sensing cells. J Physiol. 2006;574:113–123. - PMC - PubMed

Publication types

Substances

LinkOut - more resources