. 2015 Dec 15;10(12):e0144528.
doi: 10.1371/journal.pone.0144528. eCollection 2015.

Mutation Screening of 1,237 Cancer Genes across Six Model Cell Lines of Basal-Like Breast Cancer

Affiliations

Mutation Screening of 1,237 Cancer Genes across Six Model Cell Lines of Basal-Like Breast Cancer

Eleonor Olsson et al. PLoS One. .

Abstract

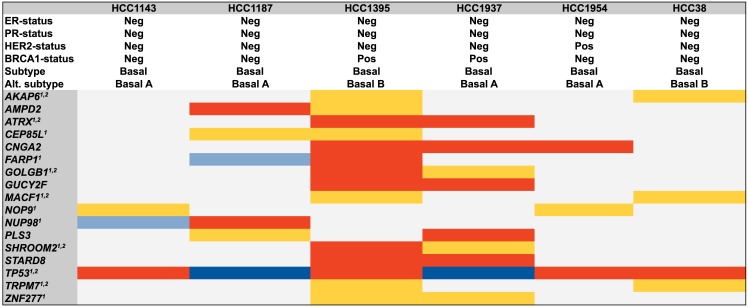
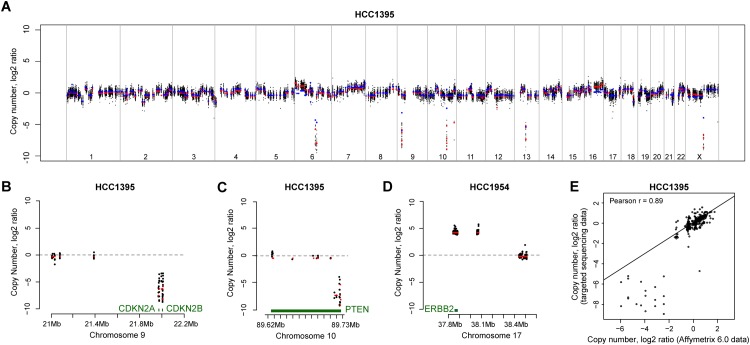
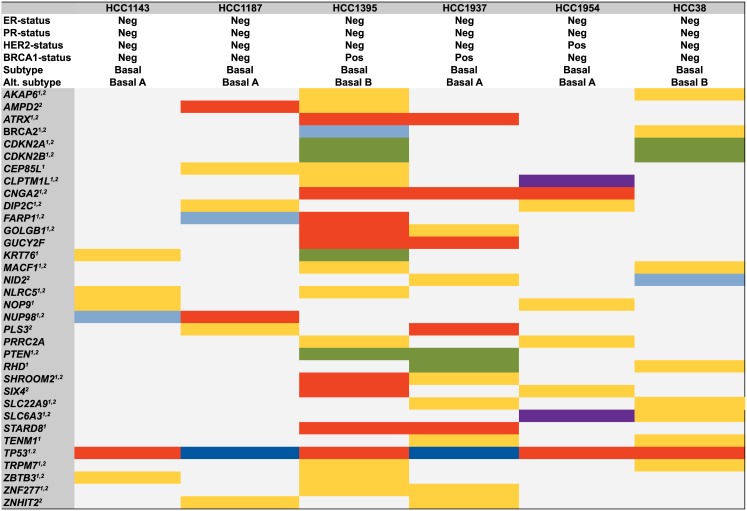
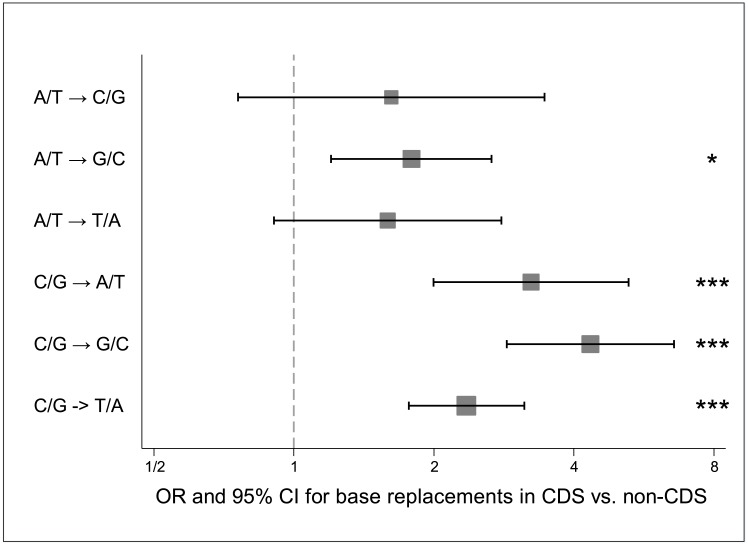
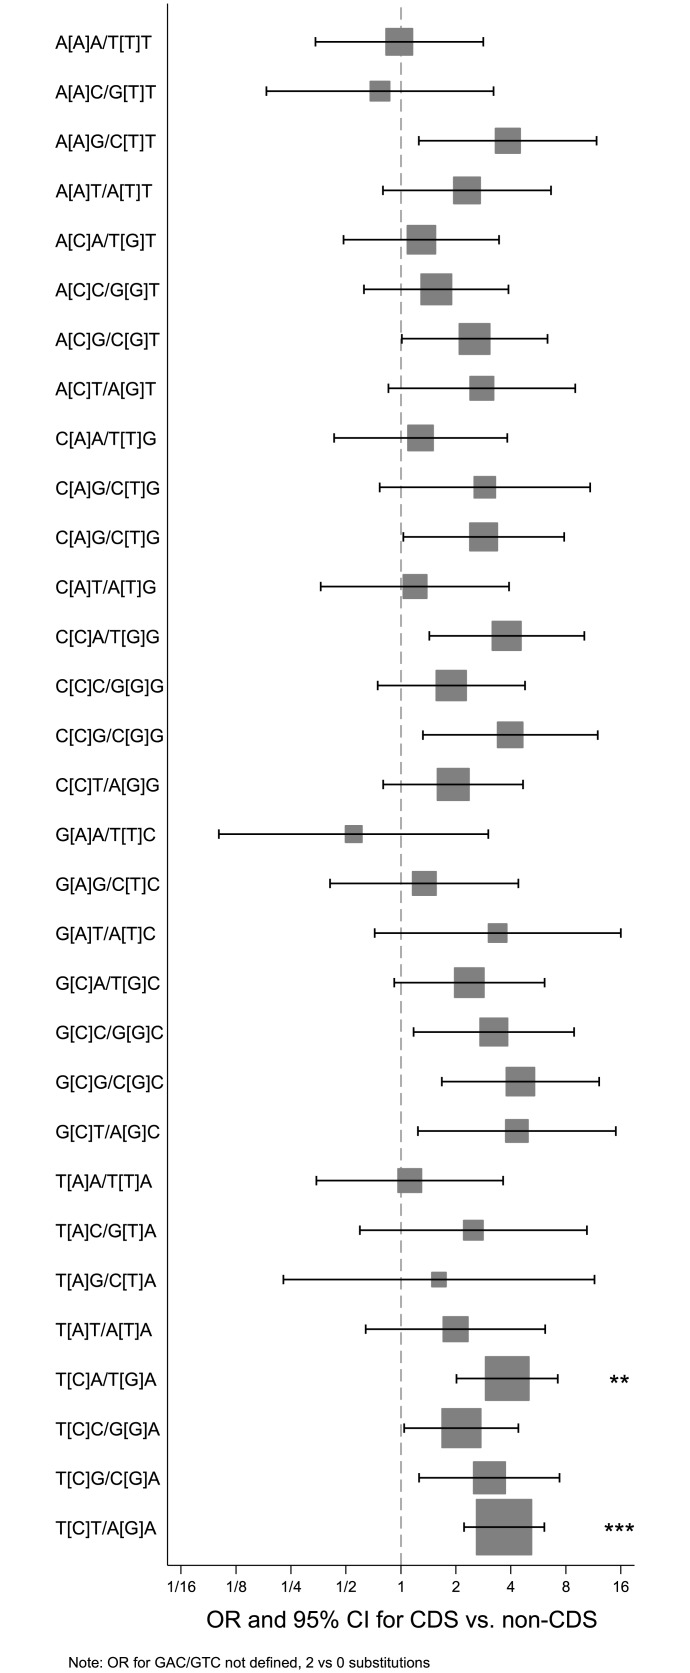
Basal-like breast cancer is an aggressive subtype generally characterized as poor prognosis and lacking the expression of the three most important clinical biomarkers, estrogen receptor, progesterone receptor, and HER2. Cell lines serve as useful model systems to study cancer biology in vitro and in vivo. We performed mutational profiling of six basal-like breast cancer cell lines (HCC38, HCC1143, HCC1187, HCC1395, HCC1954, and HCC1937) and their matched normal lymphocyte DNA using targeted capture and next-generation sequencing of 1,237 cancer-associated genes, including all exons, UTRs and upstream flanking regions. In total, 658 somatic variants were identified, of which 378 were non-silent (average 63 per cell line, range 37-146) and 315 were novel (not present in the Catalogue of Somatic Mutations in Cancer database; COSMIC). 125 novel mutations were confirmed by Sanger sequencing (59 exonic, 48 3'UTR and 10 5'UTR, 1 splicing), with a validation rate of 94% of high confidence variants. Of 36 mutations previously reported for these cell lines but not detected in our exome data, 36% could not be detected by Sanger sequencing. The base replacements C/G>A/T, C/G>G/C, C/G>T/A and A/T>G/C were significantly more frequent in the coding regions compared to the non-coding regions (OR 3.2, 95% CI 2.0-5.3, P<0.0001; OR 4.3, 95% CI 2.9-6.6, P<0.0001; OR 2.4, 95% CI 1.8-3.1, P<0.0001; OR 1.8, 95% CI 1.2-2.7, P = 0.024, respectively). The single nucleotide variants within the context of T[C]T/A[G]A and T[C]A/T[G]A were more frequent in the coding than in the non-coding regions (OR 3.7, 95% CI 2.2-6.1, P<0.0001; OR 3.8, 95% CI 2.0-7.2, P = 0.001, respectively). Copy number estimations were derived from the targeted regions and correlated well to Affymetrix SNP array copy number data (Pearson correlation 0.82 to 0.96 for all compared cell lines; P<0.0001). These mutation calls across 1,237 cancer-associated genes and identification of novel variants will aid in the design and interpretation of biological experiments using these six basal-like breast cancer cell lines.


Conflict of interest statement

Competing Interests: The authors have declared that no competing interests exist.

Figures

Fig 1
Fig 1. Recurrently mutated genes in 6 basal-like cell lines.
The 17 genes with identified somatic mutations in two or more cancer cell lines are shown, colored according to mutation type. Heterozygous non-synonymous single nucleotide variants (SNV) are in yellow; homozygous non-synonymous SNVs are in red; heterozygous stopgain/short indels mutations are in light blue; homozygous stopgain/short indels mutations are in blue. 1Non-synonymous SNVs, stopgain SNVs or short indels also identified in a breast cancer study from TCGA (basal-like tumors) [14]. 2Non-synonymous SNVs, stopgain SNVs or short indels also identified in a breast cancer study of triple-negative tumors [28]. The subtype classification and receptor status have been described earlier [17, 18, 24].
Fig 2
Fig 2. Copy number estimation using targeted sequencing data.
(a) Whole genome plot of HCC1395 copy number variations derived from targeted sequencing data analyzed with CONTRA in comparison to segmented Affymetrix 6.0 copy number data for the same cell line. For the sequencing data, the black datapoints are the CONTRA adjusted mean log2 ratios, and red datapoints are the CONTRA/GLAD segmented copy log2 ratios. For the Affymetrix 6.0 data, blue datapoints are the segmented copy number data. Zoomed-in plots of three selected genes, (b) CDKN2A and (c) PTEN in HCC1395, and (d) ERBB2 in HCC1954 (color codes are as above). (e) Representative correlation plot for one cell line, HCC1395, of segmented CONTRA copy number data versus Affymetrix 6.0 segmented copy number data (Pearson r = 0.89). Correlation plots for all cell lines are presented in S2 Fig.
Fig 3
Fig 3. Integrated recurrent somatic mutations and copy number variations.
The 34 genes affected by mutation and/or copy number gain or deletion (|log2 ratio|>2) in two or more cell lines are shown. Color codes are as in Fig 1, with the addition that large homozygous deletions are in green and amplifications are in purple. 1Non-synonymous SNVs, stopgain SNVs, short indels respective deep deletions and amplifications also identified in a breast cancer study from TCGA (basal-like tumors) [14]. 2Non-synonymous SNVs, stopgain SNVs, short indels respective homozygous deletions and amplifications also identified in a breast cancer study of triple negative tumors [28]. The subtype classification and receptor status have been described earlier [17, 18, 24].
Fig 4
Fig 4. Base replacements in coding regions versus non-coding regions.
Forest plot indicating odds ratio (marker) and 95% confidence intervals (whiskers) for the frequency of indicated base replacements in coding regions (CDS) versus non-coding (non-CDS) regions. The dimensions of the squares are inversely proportional to the standard error (SE) of ln(odds ratio). * P = 0.024; *** P<0.0001 (Bonferroni adjusted).
Fig 5
Fig 5. Genomic context of mutations in coding regions versus non-coding regions.
Forest plot indicating the odds ratio (marker) and 95% confidence intervals (whiskers) for the trinucleotide context for base replacements (the center base within square brackets, both strands indicated) in coding regions (CDS) versus non-coding (non-CDS) regions. The dimensions of the squares are inversely proportional to the standard error (SE) of ln(odds ratio). ** P = 0.001; *** P<0.0001 (Bonferroni adjusted). Note that the odds ratio for G[A]C/G[T]C is undefined (2 substitutions in coding regions versus 0 in non-coding regions).

References

    1. Ferlay J, Soerjomataram II, Dikshit R, Eser S, Mathers C, Rebelo M, et al. Cancer incidence and mortality worldwide: sources, methods and major patterns in GLOBOCAN 2012. International journal of cancer Journal international du cancer. 2014. - PubMed
    1. Futreal PA, Liu Q, Shattuck-Eidens D, Cochran C, Harshman K, Tavtigian S, et al. BRCA1 mutations in primary breast and ovarian carcinomas. Science. 1994;266(5182):120–2. - PubMed
    1. Wooster R, Neuhausen SL, Mangion J, Quirk Y, Ford D, Collins N, et al. Localization of a breast cancer susceptibility gene, BRCA2, to chromosome 13q12-13. Science. 1994;265(5181):2088–90. - PubMed
    1. Antoniou AC, Casadei S, Heikkinen T, Barrowdale D, Pylkas K, Roberts J, et al. Breast-cancer risk in families with mutations in PALB2. The New England journal of medicine. 2014;371(6):497–506. 10.1056/NEJMoa1400382 - DOI - PMC - PubMed
    1. Hakansson S, Johannsson O, Johansson U, Sellberg G, Loman N, Gerdes AM, et al. Moderate frequency of BRCA1 and BRCA2 germ-line mutations in Scandinavian familial breast cancer. American journal of human genetics. 1997;60(5):1068–78. - PMC - PubMed

Publication types