. 2015 Dec 15;6(6):e01863-15.
doi: 10.1128/mBio.01863-15.

Common Viral Integration Sites Identified in Avian Leukosis Virus-Induced B-Cell Lymphomas

Affiliations

Common Viral Integration Sites Identified in Avian Leukosis Virus-Induced B-Cell Lymphomas

James F Justice 4th et al. mBio. .

Abstract

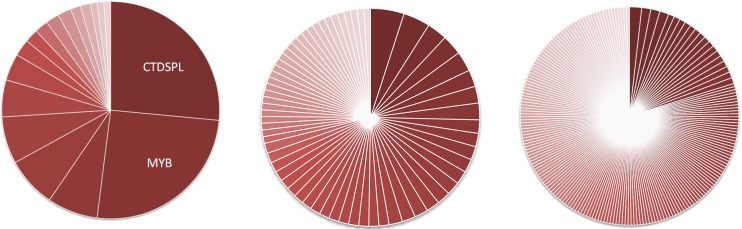
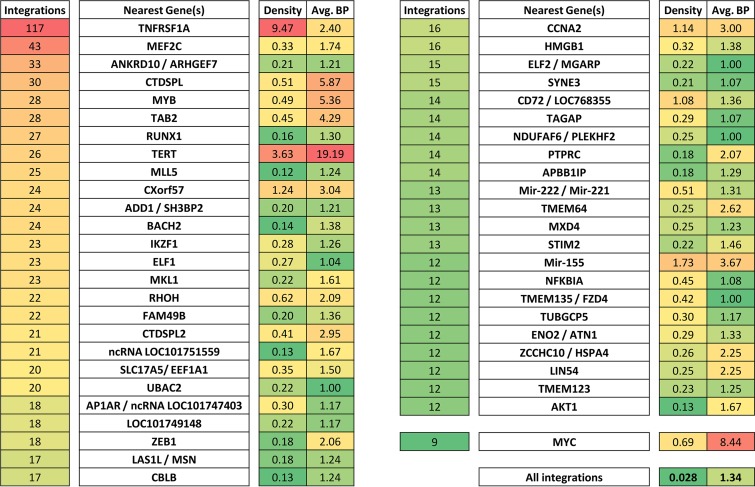
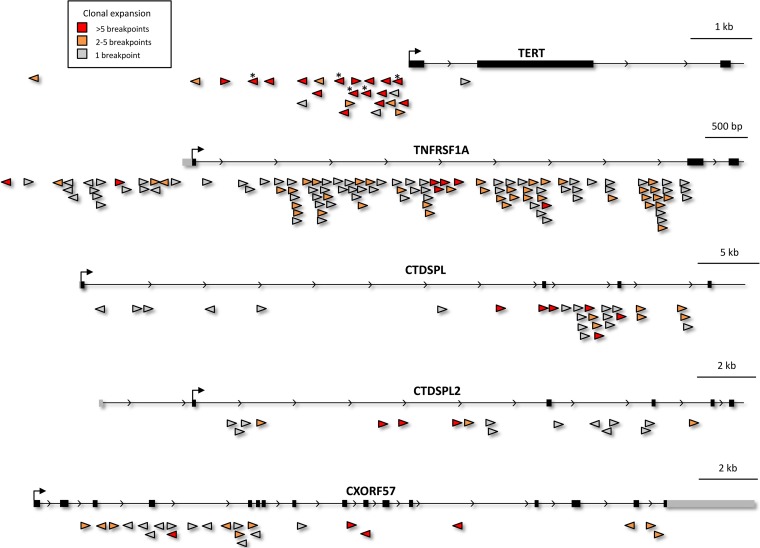
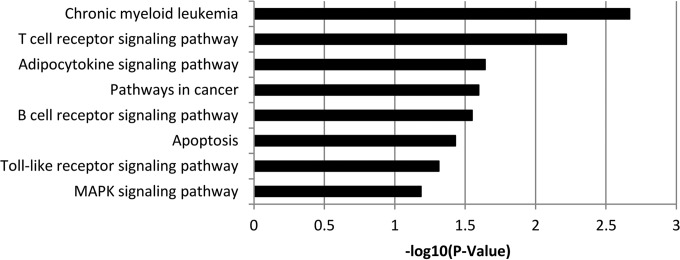
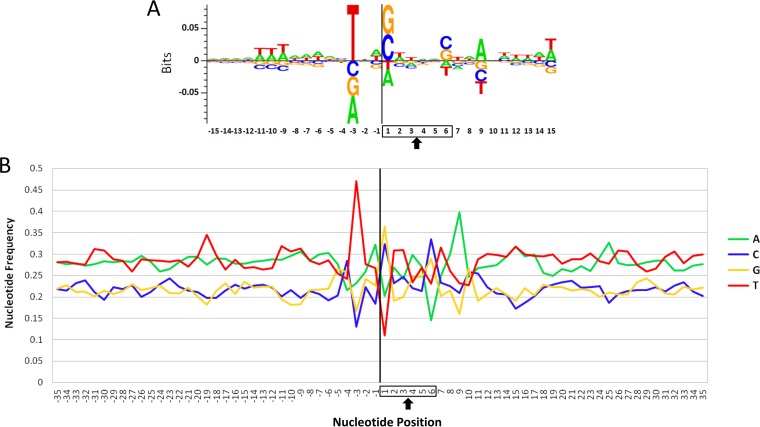
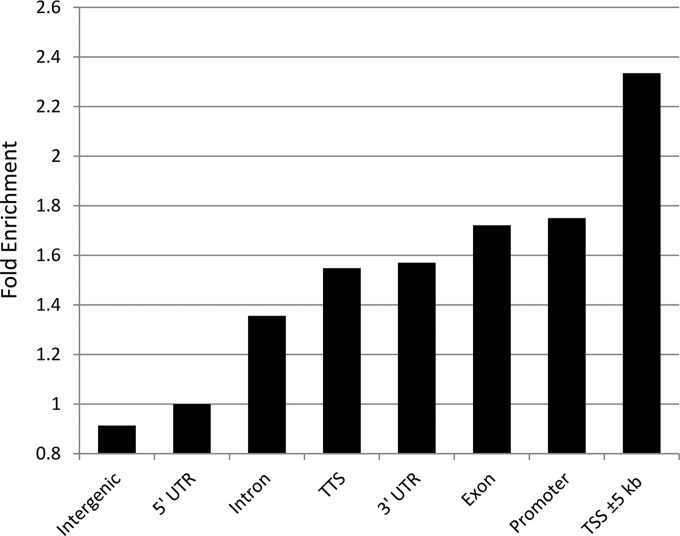
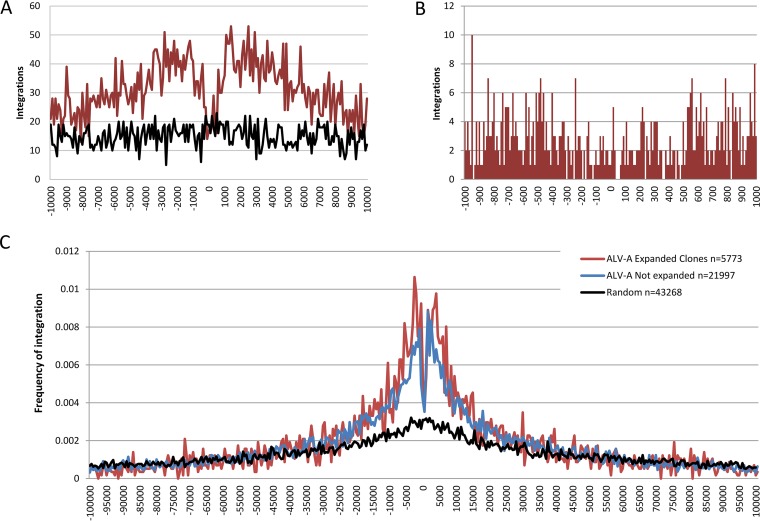
Avian leukosis virus (ALV) induces B-cell lymphoma and other neoplasms in chickens by integrating within or near cancer genes and perturbing their expression. Four genes--MYC, MYB, Mir-155, and TERT--have previously been identified as common integration sites in these virus-induced lymphomas and are thought to play a causal role in tumorigenesis. In this study, we employ high-throughput sequencing to identify additional genes driving tumorigenesis in ALV-induced B-cell lymphomas. In addition to the four genes implicated previously, we identify other genes as common integration sites, including TNFRSF1A, MEF2C, CTDSPL, TAB2, RUNX1, MLL5, CXorf57, and BACH2. We also analyze the genome-wide ALV integration landscape in vivo and find increased frequency of ALV integration near transcriptional start sites and within transcripts. Previous work has shown ALV prefers a weak consensus sequence for integration in cultured human cells. We confirm this consensus sequence for ALV integration in vivo in the chicken genome.

Importance: Avian leukosis virus induces B-cell lymphomas in chickens. Earlier studies showed that ALV can induce tumors through insertional mutagenesis, and several genes have been implicated in the development of these tumors. In this study, we use high-throughput sequencing to reveal the genome-wide ALV integration landscape in ALV-induced B-cell lymphomas. We find elevated levels of ALV integration near transcription start sites and use common integration site analysis to greatly expand the number of genes implicated in the development of these tumors. Interestingly, we identify several genes targeted by viral insertions that have not been previously shown to be involved in cancer.


Figures

FIG 1
FIG 1
Metastatic tumors contain integrations within clonally expanded cells. Each pie represents a specific tissue that underwent high-throughput integration site sequencing. Each slice represents a unique integration, and the size of each slice corresponds to the number of sonication breakpoints observed for that integration. The integrations that exhibit the greatest clonal expansion (i.e., the most breakpoints) are shown. A total of 200 breakpoints are shown for each sample. (Left) C3-B256 metastatic liver tumor exhibits extensive clonal expansion. (Middle) D1-G157 bursa with neoplastic follicles contains some integrations in moderately expanded clones. (Right) D4-G163 non-tumor liver exhibits very few integrations in expanded clones.
FIG 2
FIG 2
Common sites of ALV proviral integration. The top 48 common integration sites are shown. Integration clusters were defined as any 50-kb region that harbors 12 or more unique ALV integrations. If an integration cluster was within or near a gene, all integrations within that gene and ±10 kb from the gene transcript were also included. “Density” represents the number of integrations per kilobase in a given cluster. The average number of sonication breakpoints per integration is shown for each gene. A higher number of breakpoints indicates increased clonal expansion of the cells carrying that integration. MYC did not penetrate the 12-integration threshold but is shown for comparison.
FIG 3
FIG 3
Selected common integration sites. Integration clusters for TERT, TNFRSF1a, CTDSPL, CTDSPL2, and CXorf57 are shown. The orientation of each integrated provirus is indicated by the direction of the triangle, and the tip of the triangle corresponds to the exact location of integration. The extent of clonal expansion is indicated by the color of the integration marker—integrations with 1 breakpoint are gray, those with 2 to 5 breakpoints are orange, and those with greater than 5 breakpoints are red. TERT integrations marked with an asterisk (*) are the same integrations identified previously via inverse PCR (21).
FIG 4
FIG 4
KEGG pathway analysis. KEGG pathways enriched among the top 48 common integration sites are shown. MAPK, mitogen-activated protein kinase.
FIG 5
FIG 5
Consensus target integration site. (A) Sequence logo displaying the consensus sequence surrounding ALV integration sites in this study. The vertical black line represents the viral integration site, and the 6 nucleotides of sequence duplicated during viral integration are boxed. The arrow indicates the axis of symmetry. (B) Base frequencies in the chicken genome at ALV integration sites are shown.
FIG 6
FIG 6
Preference for integration near genomic features. Enrichment for integration near genomic features was calculated with HOMER (40). Fold enrichment was calculated by comparing ALV integrations to a randomly generated integration data set. Promoters are defined as the region from −1 kb to +100 bp from transcription start sites, while transcription termination sites (TTS) are defined as the region from −100 bp to +1 kb flanking the transcription termination site.
FIG 7
FIG 7
ALV integrations mapped with respect to transcription start sites. (A) Integrations within 10 kb of transcription start sites are shown placed into 100-bp bins. The red line represents ALV-A integrations, and the black line represents randomly simulated integrations. A preference for integration flanking TSSs is observed. (B) Integrations within 1 kb of TSSs are shown in 10-bp bins. A striking lack of integrations was observed in the immediate vicinity of TSSs. (C) Integration frequency was calculated for expanded clones (red), nonexpanded clones (blue), and randomly generated integrations (black), and integrations are presented in 500-bp bins. Integration frequency is the fraction of total integrations that fall into each 500-bp bin. Integrations near the TSS are shown to be slightly more likely to result in clonal expansion.

References

    1. Justice J IV, Beemon KL. 2013. Avian retroviral replication. Curr Opin Virol 3:664–669. doi:10.1016/j.coviro.2013.08.008. - DOI - PMC - PubMed
    1. Mitchell RS, Beitzel BF, Schroder ARW, Shinn P, Chen H, Berry CC, Ecker JR, Bushman FD. 2004. Retroviral DNA integration: ASLV, HIV, and MLV show distinct target site preferences. PLoS Biol 2:E234. doi:10.1371/journal.pbio.0020234. - DOI - PMC - PubMed
    1. Narezkina A, Taganov KD, Litwin S, Stoyanova R, Hayashi J, Seeger C, Skalka AM, Katz RA. 2004. Genome-wide analyses of avian sarcoma virus integration sites. J Virol 78:11656–11663. doi:10.1128/JVI.78.21.11656-11663.2004. - DOI - PMC - PubMed
    1. Barr SD, Leipzig J, Shinn P, Ecker JR, Bushman FD. 2005. Integration targeting by avian sarcoma-leukosis virus and human immunodeficiency virus in the chicken genome. J Virol 79:12035–12044. doi:10.1128/JVI.79.18.12035-12044.2005. - DOI - PMC - PubMed
    1. Wu X, Li Y, Crise B, Burgess SM, Munroe DJ. 2005. Weak palindromic consensus sequences are a common feature found at the integration target sites of many retroviruses. J Virol 79:5211–5214. doi:10.1128/JVI.79.8.5211-5214.2005. - DOI - PMC - PubMed

Publication types