. 2016 Mar;15(3):1017-31.
doi: 10.1074/mcp.M115.049999. Epub 2015 Dec 15.

Integrative Network Analysis Combined with Quantitative Phosphoproteomics Reveals Transforming Growth Factor-beta Receptor type-2 (TGFBR2) as a Novel Regulator of Glioblastoma Stem Cell Properties

Affiliations

Integrative Network Analysis Combined with Quantitative Phosphoproteomics Reveals Transforming Growth Factor-beta Receptor type-2 (TGFBR2) as a Novel Regulator of Glioblastoma Stem Cell Properties

Yuta Narushima et al. Mol Cell Proteomics. 2016 Mar.

Abstract

Glioblastoma is one of the most malignant brain tumors with poor prognosis and their development and progression are known to be driven by glioblastoma stem cells. Although glioblastoma stem cells lose their cancer stem cell properties during cultivation in serum-containing medium, little is known about the molecular mechanisms regulating signaling alteration in relation to reduction of stem cell-like characteristics. To elucidate the global phosphorylation-related signaling events, we performed a SILAC-based quantitative phosphoproteome analysis of serum-induced dynamics in glioblastoma stem cells established from the tumor tissues of the patient. Among a total of 2876 phosphorylation sites on 1584 proteins identified in our analysis, 732 phosphorylation sites on 419 proteins were regulated through the alteration of stem cell-like characteristics. The integrative computational analyses based on the quantified phosphoproteome data revealed the relevant changes of phosphorylation levels regarding the proteins associated with cytoskeleton reorganization such as Rho family GTPase and Intermediate filament signaling, in addition to transforming growth factor-β receptor type-2 (TGFBR2) as a prominent upstream regulator involved in the serum-induced phosphoproteome regulation. The functional association of transforming growth factor-β receptor type-2 with stem cell-like properties was experimentally validated through signaling perturbation using the corresponding inhibitors, which indicated that transforming growth factor-β receptor type-2 could play an important role as a novel cell fate determinant in glioblastoma stem cell regulation.


Figures

Fig. 1.
Fig. 1.
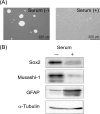
Alteration of glioblastoma stem cell characteristics by cultivation in serum-containing medium. A, Photomicrographs of serum-free (serum [-]) and serum (serum [+]) cultured GB2 cells. GB2 cells cultured in serum-free medium formed spheres, whereas serum cultured GB2 cells grew as adherent cells. Scale bar represents 200 μm. B, Western blotting analysis of the marker proteins expressed in GB2 cells. Decrease of the stem cell marker (Sox2 and Musashi-1) and increase of the astroglial marker (GFAP) were observed through serum-induced alteration.
Fig. 2.
Fig. 2.
SILAC-based quantitative phosphoproteome analysis. A, Schematic diagram of SILAC-based quantitative phosphoproteome analysis. The GB2 cells labeled with [13C6, 15N2]-lysine and [13C6, 15N4]-arginine were maintained in serum-free medium, whereas the GB2 cells cultured with [12C6, 14N2]-lysine and [12C6, 14N4]-arginine were induced to lose their stem-like properties by serum-containing medium. After 7 days cultivation, serum-free cultured cells (Heavy) and serum cultured cells (Light) were lysed, combined, fractionated, and tryptic digested into peptides. The peptide mixture was then subjected to phosphopeptide enrichment prior to nanoLC-MS/MS analysis. After protein identification and quantification, the network-wide computational analyses of GO terms, canonical pathways, and upstream kinases/regulators were performed based on the quantitative phosphoproteome data. B, Distribution of the phosphorylated serine, threonine, and tyrosine residues among the identified phosphorylation sites. C, SILAC ratio distribution of the unique phosphopeptides regulated through serum-induced alteration. The dashed lines indicate the log2-transformed SILAC ratios of 1.0 and −1.0 as the cut-offs for the regulated phosphopeptides.
Fig. 3.
Fig. 3.
GO analysis of the phosphoproteome data. Heatmap statistics show significantly enriched GO terms among the phosphorylated proteins regulated through serum-induced alteration (adjusted p value < 0.01). The subset “serum (−)” indicates SILAC ratio > 2.0, whereas “serum (+)” shows SILAC ratio < 0.5. Full statistical information including those on the unregulated phosphoproteome is shown in supplemental Table S3. A, Molecular function, B, Biological process, and C, Cellular component.
Fig. 4.
Fig. 4.
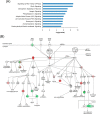
Network analysis of the regulated phosphoproteome by KeyMolnet. A, Canonical pathway analysis by KeyMolnet. The p values were calculated from hypergeometric tests based on the number of the overlapping molecular relations between the generated network and the canonical pathways stored in KeyMolnet. B, Quantitative phosphorylation changes regarding “Intermediate filament signaling pathway.” The image was created by overlaying the quantitative phosphoproteome data on “Intermediate filament signaling pathway” in KeyMolnet. The colors represent the largest distribution of the log2-transformed SILAC ratios regarding each phosphorylated protein as shown at the lower-right corner. The dashed circles show vimentin and nestin.
Fig. 5.
Fig. 5.
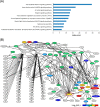
Network analysis of the regulated phosphoproteome by IPA. A, Canonical pathway analysis by IPA. The top ten canonical pathways relevant to the regulated phosphoproteome are shown with the corresponding score (−log [p value]). B, “Signaling by Rho family GTPases” depicted by IPA. Red indicates increased phosphorylation in serum-free cultured GB2 cells, whereas green shows increased phosphorylation in serum cultured cells. The proteins corresponding to the unregulated phosphopeptides are shown in gray.
Fig. 6.
Fig. 6.
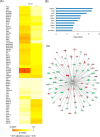
Upstream kinase/regulator analyses based on the regulated phosphoproteome data. A, Heatmap of the over-representation p values calculated for each predicted kinase using PhosphoSiteAnalyzer. The subset “serum (−)” indicates SILAC ratio > 2.0, whereas “serum (+)” shows SILAC ratio < 0.5. TGFBR2 and ACVR2A/B-specific phosphorylation sites were predicted to be significantly enriched in the “serum (−)” subset (adjusted p value < 0.05). B, Upstream regulator analysis by IPA. The top ten upstream regulators relevant to the regulated phosphoproteome are shown with the corresponding score (−log [p value]). C, IPA-based description of TGF-β1 and the target molecules in our phosphoproteome data. Red indicates increased phosphorylation in serum-free cultured GB2 cells, whereas green shows increased phosphorylation in serum cultured cells. Dashed lines represent indirect interactions caused by TGF-β1.
Fig. 7.
Fig. 7.
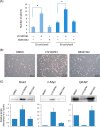
Experimental investigation of TGFBR signaling pathways involved in glioblastoma stem cell regulation. A, Clonal sphere formation capacity of GB2 cells after treatment with TGFBR1/2 dual inhibitor (LY2109761) or TGFBR1-specific inhibitor (SB431542). The cells were cultured on 96-well plates at the indicated cell densities. After 3 weeks cultivation, the numbers of spheres (> 50 μm) were independently counted using a phase-contrast microscope. The error bars represent the standard deviations (n = 8) and the p values were calculated by a two-sided Student's t test (*: p < 0.05). B, Photomicrographs of serum-free cultured GB2 cells treated with each 20 μm inhibitor. Scale bar shows 500 μm. C, Western blot analysis of serum cultured GB2 cells treated with each 20 μm inhibitor. The representative Western blot is shown for each protein and the bar charts represent the quantified values (mean ± s.d.) of three replicates. The fold changes were normalized by the relative densities regarding α-Tubulin.

References

    1. Wen P. Y., and Kesari S. (2008) Malignant gliomas in adults. N. Engl. J. Med. 359, 492–507 - PubMed
    1. Chen J., McKay R. M., and Parada L. F. (2012) Malignant glioma: lessons from genomics, mouse models, and stem cells. Cell 149, 36–47 - PMC - PubMed
    1. Singh S. K., Clarke I. D., Terasaki M., Bonn V. E., Hawkins C., Squire J., and Dirks P. B. (2003) Identification of a cancer stem cell in human brain tumors. Cancer Res. 63, 5821–5828 - PubMed
    1. Singh S. K., Hawkins C., Clarke I. D., Squire J. A., Bayani J., Hide T., Henkelman R. M., Cusimano M. D., and Dirks P. B. (2004) Identification of human brain tumor initiating cells. Nature 432, 396–401 - PubMed
    1. Lee J., Kotliarova S., Kotliarov Y., Li A., Su Q., Donin N. M., Pastorino S., Purow B. W., Christopher N., Zhang W., Park J. K., and Fine H. A. (2006) Tumor stem cells derived from glioblastomas cultured in bFGF and EGF more closely mirror the phenotype and genotype of primary tumors than do serum-cultured cell lines. Cancer Cell 9, 391–403 - PubMed

Publication types

MeSH terms

Substances