. 2016 Feb 4;127(5):646-57.
doi: 10.1182/blood-2015-10-672345. Epub 2015 Dec 15.

Unbalanced recovery of regulatory and effector T cells after allogeneic stem cell transplantation contributes to chronic GVHD

Affiliations

Unbalanced recovery of regulatory and effector T cells after allogeneic stem cell transplantation contributes to chronic GVHD

Ana C Alho et al. Blood. .

Abstract

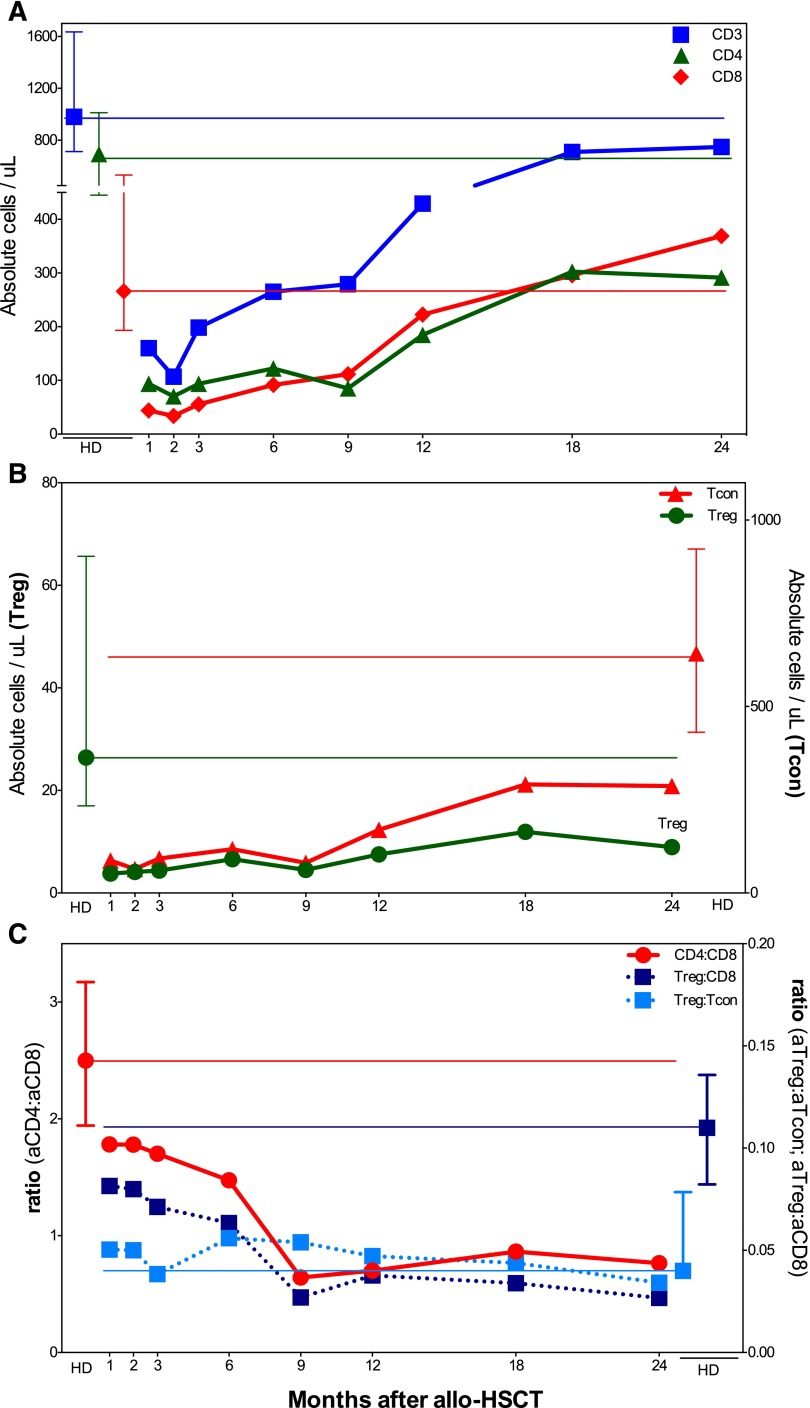
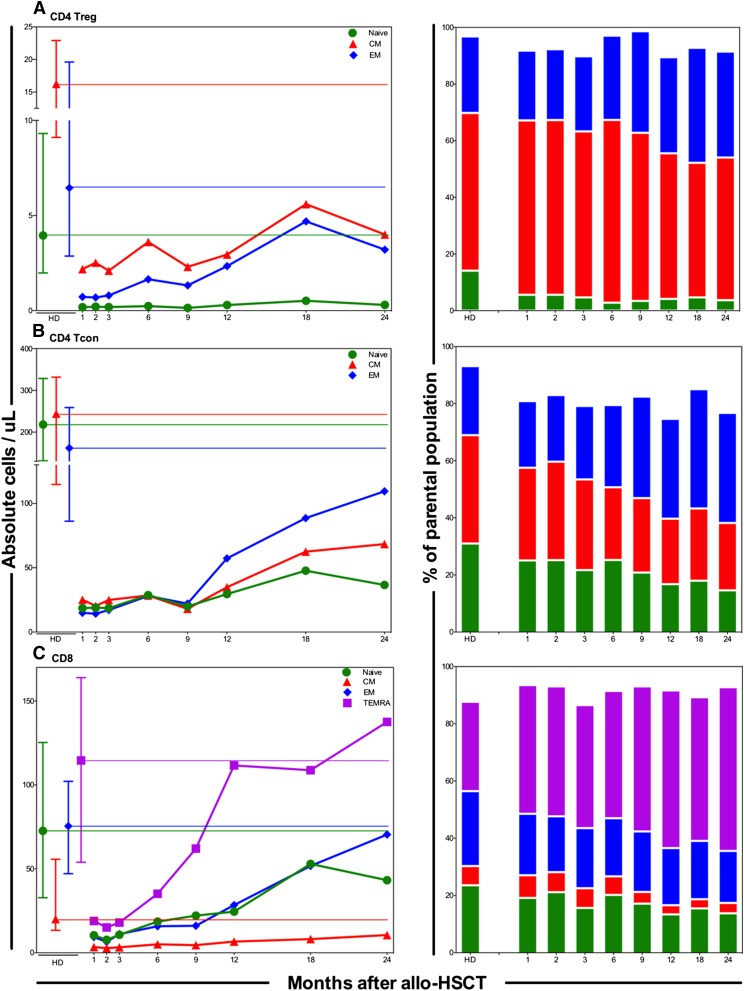
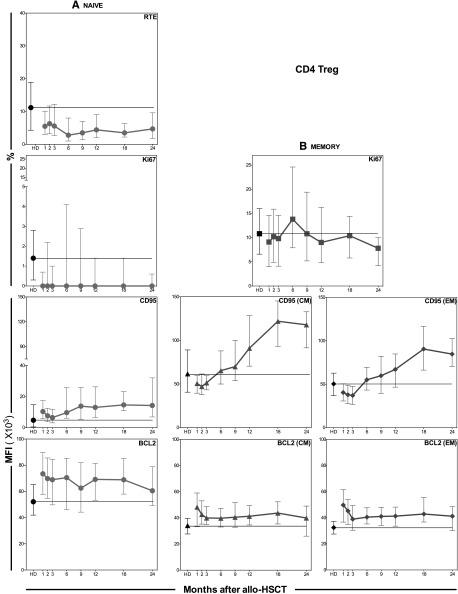
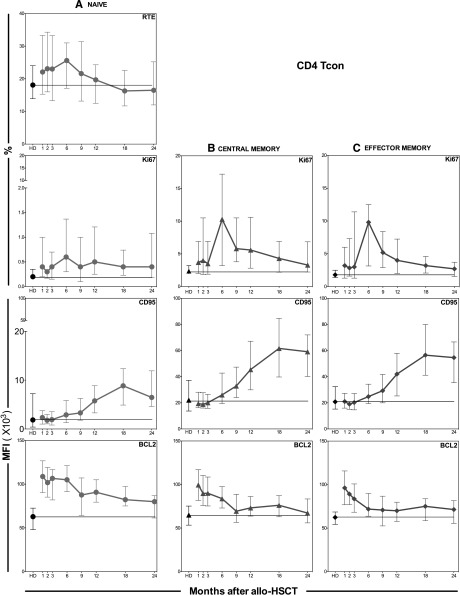
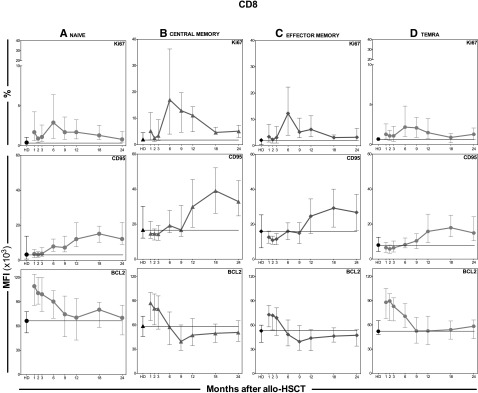
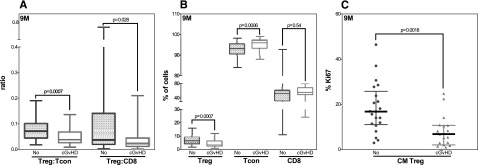
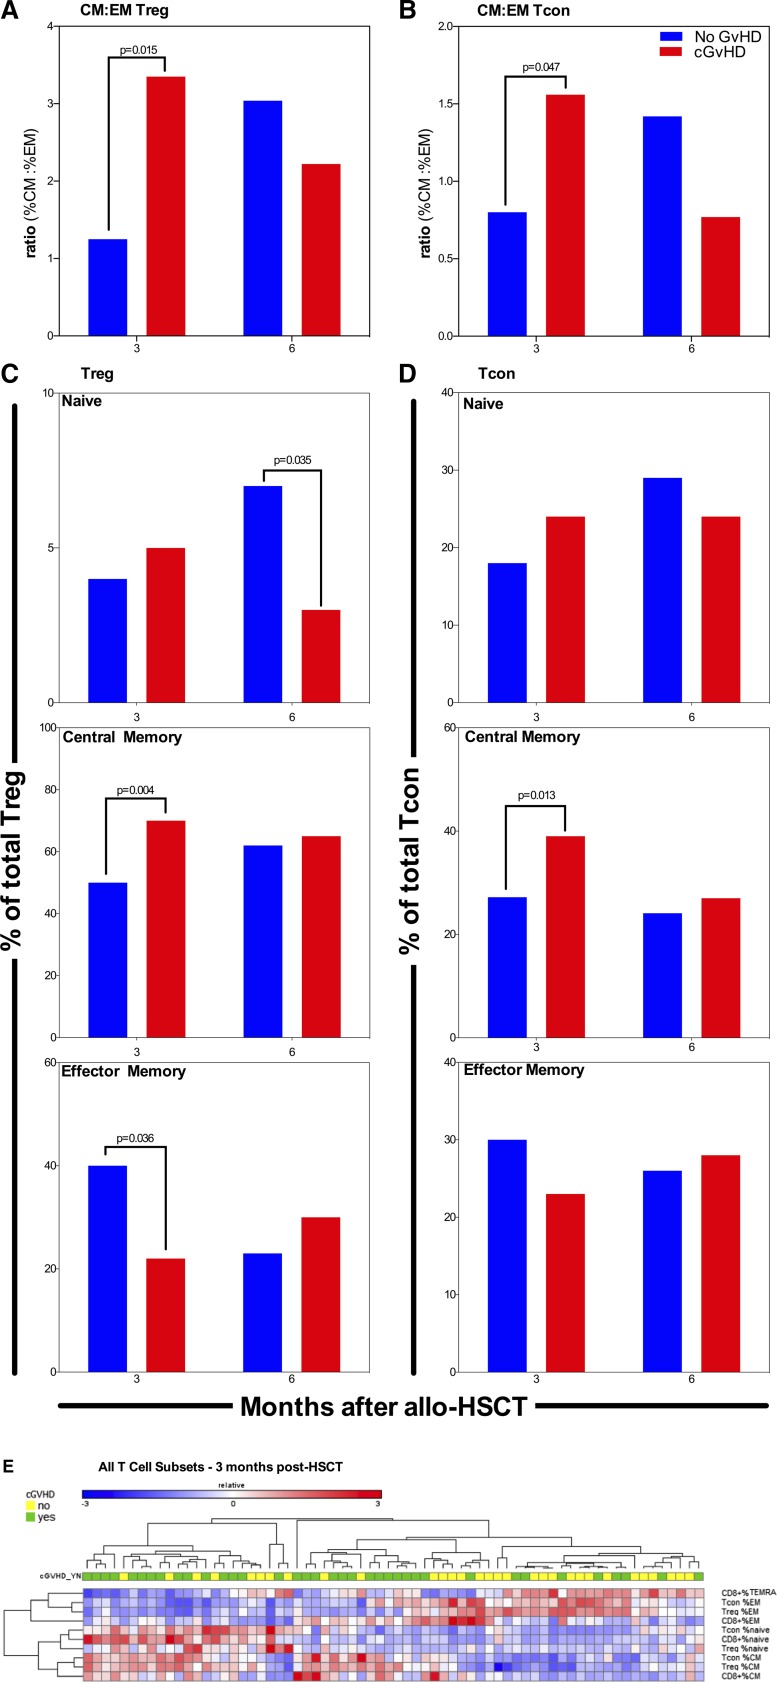
The development and maintenance of immune tolerance after allogeneic hematopoietic stem cell transplantation (HSCT) requires the balanced reconstitution of donor-derived CD4 regulatory T cells (CD4Tregs) as well as effector CD4 (conventional CD4 T cells [CD4Tcons]) and CD8 T cells. To characterize the complex mechanisms that lead to unbalanced recovery of these distinct T-cell populations, we studied 107 adult patients who received T-replete stem cell grafts after reduced-intensity conditioning. Immune reconstitution of CD4Treg, CD4Tcon, and CD8 T cells was monitored for a 2-year period. CD3 T-cell counts gradually recovered to normal levels during this period but CD8 T cells recovered more rapidly than either CD4Tregs or CD4Tcons. Reconstituting CD4Tregs and CD4Tcons were predominantly central memory (CM) and effector memory (EM) cells and CD8 T cells were predominantly terminal EM cells. Thymic generation of naive CD4Tcon and CD8 T cells was maintained but thymic production of CD4Tregs was markedly decreased with little recovery during the 2-year study. T-cell proliferation was skewed in favor of CM and EM CD4Tcon and CD8 T cells, especially 6 to 12 months after HSCT. Intracellular expression of BCL2 was increased in CD4Tcon and CD8 T cells in the first 3 to 6 months after HSCT. Early recovery of naive and CM fractions within each T-cell population 3 months after transplant was also strongly correlated with the subsequent development of chronic graft-versus-host disease (GVHD). These dynamic imbalances favor the production, expansion, and persistence of effector T cells over CD4Tregs and were associated with the development of chronic GVHD.


Figures

Figure 1
Figure 1
Reconstitution of major T-cell populations after allogeneic HSCT. The recovery of each T-cell population in peripheral blood was assessed prospectively by flow cytometry. The median cell counts per microliter for each population are represented at each time point, as well as the corresponding median value in healthy donors (HD), with the interquartile range (IQ) range (whisker bars). (A) Median CD3+ (blue), CD4+ (green), and CD8+(red) T-cell counts. (B) Median CD4Treg (green) and CD4Tcon (red) counts. (C) Median CD4:CD8, Treg:CD8, and Treg:Tcon ratios. To compare the patterns of recovery of CD4Tregs and CD4Tcons in the same graph, different scales were used in panels B and C. aCD4, absolute CD4; aCD8, absolute CD8; aTcon, absolute Tcon; aTreg, absolute Treg.
Figure 2
Figure 2
Reconstitution of naive and memory T-cell compartments. Absolute numbers (cells per microliter) of each subset in peripheral blood are shown on the left and relative percentages at each time point are shown on the right. Graphs on the left show median cell counts per microliter for each population and the corresponding median in HDs, with the IQ range (whisker bars). Bar graphs on the right show the median percentage of each population and the corresponding median in HDs. (A) CD4Treg subsets: naive (green), CM (red), EM (blue). (B) CD4Tcon subsets: naive (green), CM (red), EM (blue). (C) CD8 T-cell subsets: naive (green), CM (red), EM (blue), TEMRA (purple).
Figure 3
Figure 3
Dynamic profile of CD4Treg subsets. Phenotypic markers of thymic production, proliferation, and susceptibility to apoptosis were measured at different time points over a 2-year period. Results are shown for (A) naive and (B) memory subsets of CD4Tregs. Individual graphs show the percentage of RTEs, the percentage of Ki67 (proliferation), and the MFIs of CD95 and BCL2. Median values and the IQ range (whisker bars) are shown for each parameter. Results in HD are shown in black. MFI, mean fluorescence intensity.
Figure 4
Figure 4
Dynamic profile of CD4Tcon subsets. Phenotypic markers of thymic production, proliferation, and susceptibility to apoptosis were measured at different time points over a 2-year period. Results are shown for (A) naive, (B) memory, and (C) EM subsets of CD4Tcons. Individual graphs show the percentage of RTEs, the percentage of Ki67 (proliferation), and the MFIs of CD95 and BCL2. Median values and the IQ range (whisker bars) are shown for each parameter. Results in HD are shown in black.
Figure 5
Figure 5
Dynamic profile of CD8 T-cell subsets. Phenotypic markers of proliferation and susceptibility to apoptosis were measured at different time points over a 2-year period. Results are shown for (A) naive, (B) CM, (C) EM, and (D) TEMRA subsets. Individual graphs show the percentage of Ki67 (proliferation) and the MFIs of CD95 and BCL2. Median values and the IQ range (whisker bars) are shown for each parameter. Results in HD are shown in black.
Figure 6
Figure 6
Reconstitution of CD4Tregs, CD4Tcons, and CD8 T cells according to cGVHD status 9 months after transplant. (A) CD4Treg:CD4Tcon and CD4Treg:CD8 ratios. (B) The percentages of CD4Tregs, CD4Tcons, and CD8 T cells. (C) Proliferation (%Ki67) in CM CD4Tregs. Each figure compares patients with (red) and without (blue) cGVHD. Box plots in panels A and B depict the 75th percentile; median and 25th percentile values and whiskers represent maximum and minimum values. In panel C, dots depict the number of patients (n = 20 for each group) and the whiskers correspond to the 75th and 25th percentile. cGVHD, chronic GVHD.
Figure 7
Figure 7
Differentiation characteristics of CD4Tregs, CD4Tcons, and CD8 T cells associated with cGVHD. Percentages of naive, CM, and EM subsets were determined at 3 and 6 months after transplant. Results were compared in patients who developed (red) or did not develop (blue) cGVHD. (A) CM:EM ratio in CD4Tregs. (B) CM:EM ratio in CD4Tcons. (C) CD4Tregs: Median percentage of the naive, CM, and EM. (D) CD4Tcons: Median percentage of the naive, CM, and EM. (E) Frequency profile of the entire T-cell compartment at 3 months after transplant. Data are presented as a heatmap using hierarchical clustering after standardization of each row. Top bar indicates subsequent cGVHD outcome (green, cGVHD; yellow, no cGVHD). Blue, white, and red represent low, intermediate, and high subset frequency.

References

    1. Seggewiss R, Einsele H. Immune reconstitution after allogeneic transplantation and expanding options for immunomodulation: an update. Blood. 2010;115(19):3861–3868. - PubMed
    1. Kim DH, Sohn SK, Won DI, Lee NY, Suh JS, Lee KB. Rapid helper T-cell recovery above 200 x 10 6/l at 3 months correlates to successful transplant outcomes after allogeneic stem cell transplantation. Bone Marrow Transplant. 2006;37(12):1119–1128. - PubMed
    1. Storek J, Geddes M, Khan F, et al. Reconstitution of the immune system after hematopoietic stem cell transplantation in humans. Semin Immunopathol. 2008;30(4):425–437. - PubMed
    1. Podgorny PJ, Liu Y, Dharmani-Khan P, et al. Immune cell subset counts associated with graft-versus-host disease. Biol Blood Marrow Transplant. 2014;20(4):450–462. - PubMed
    1. Mirmonsef P, Tan G, Zhou G, et al. Escape from suppression: tumor-specific effector cells outcompete regulatory T cells following stem-cell transplantation. Blood. 2008;111(4):2112–2121. - PMC - PubMed

Publication types

MeSH terms