. 2015 Dec;3(1):34.
doi: 10.1186/s40635-015-0070-1. Epub 2015 Dec 15.

Lung anatomy, energy load, and ventilator-induced lung injury

Affiliations

Lung anatomy, energy load, and ventilator-induced lung injury

Alessandro Protti et al. Intensive Care Med Exp. 2015 Dec.

Abstract

Background: High tidal volume can cause ventilator-induced lung injury (VILI), but positive end-expiratory pressure (PEEP) is thought to be protective. We aimed to find the volumetric VILI threshold and see whether PEEP is protective per se or indirectly.

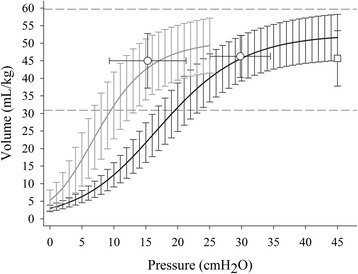
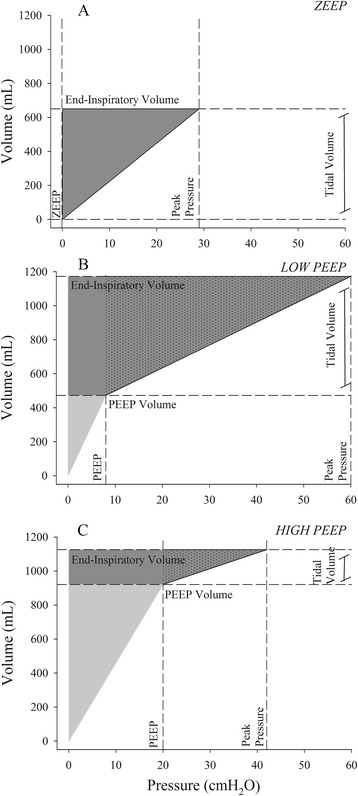
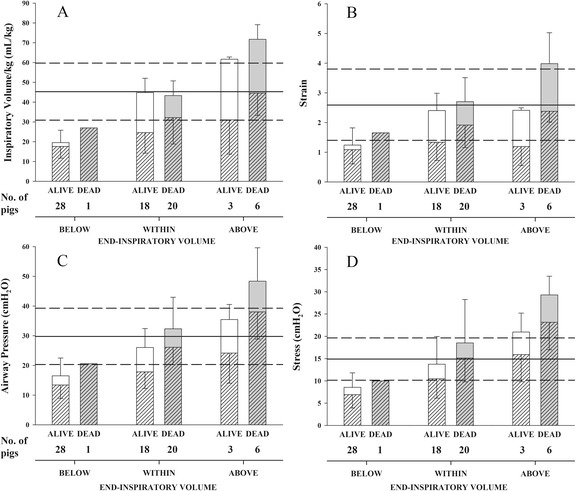
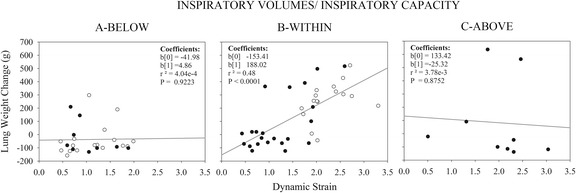
Methods: In 76 pigs (22 ± 2 kg), we examined the lower and upper limits (30.9-59.7 mL/kg) of inspiratory capacity by computed tomography (CT) scan at 45 cmH2O pressure. The pigs underwent a 54-h mechanical ventilation with a global strain ((tidal volume (dynamic) + PEEP volume (static))/functional residual capacity) from 0.45 to 5.56. The dynamic strain ranged from 18 to 100 % of global strain. Twenty-nine pigs were ventilated with end-inspiratory volumes below the lower limit of inspiratory capacity (group "Below"), 38 within (group "Within"), and 9 above (group "Above"). VILI was defined as death and/or increased lung weight.

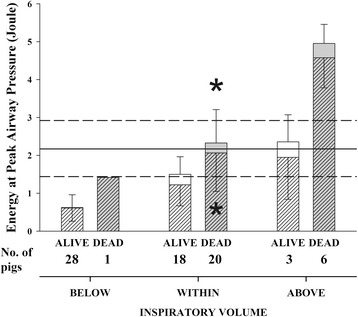
Results: "Below" pigs did not develop VILI; "Within" pigs developed lung edema, and 52 % died before the end of the experiment. The amount of edema was significantly related to dynamic strain (edema 188-153 × dynamic strain, R (2) = 0.48, p < 0.0001). In the "Above" group, 66 % of the pigs rapidly died but lung weight did not increase significantly. In pigs ventilated with similar tidal volume adding PEEP significantly increased mortality.

Conclusions: The threshold for VILI is the lower limit of inspiratory capacity. Below this threshold, VILI does not occur. Within these limits, severe/lethal VILI occurs depending on the dynamic component. Above inspiratory capacity stress at rupture may occur. In healthy lungs, PEEP is protective only if associated with a reduced tidal volume; otherwise, it has no effect or is harmful.

Keywords: Energy load; Experimental animal model; Inspiratory capacity; Lung stress and strain; Mechanical ventilation; Ventilator-induced lung injury.


Figures

Fig. 1
Fig. 1
Global end-inspiratory volume and the different dynamic and static proportions. The distribution of global end-inspiratory volumes used in this study is shown with the different proportions of dynamic (tidal volume, white bars) and static components (black bars). Pigs were grouped according to end-inspiratory volume lower (BELOW), within (WITHIN), or higher (ABOVE) than normal inspiratory capacity (vertical dashed lines)
Fig. 2
Fig. 2
Respiratory system and lung pressure-volume curve. Mean (±standard deviation) pressure-volume curve of the total respiratory system (black line) and the lung (gray line) obtained by sigmoidal fitting (see text for method). The white dots indicate the upper corner points and the white squares the average inspiratory capacity (TLC-FRC) obtained by CT scan at 45 cmH2O airway pressure. Horizontal dashed lines indicate the 95 % confidence limits of inspiratory capacity (mean ±2 standard deviations)
Fig. 3
Fig. 3
Energy calculation. Three examples of energy calculation in the following: a a pig ventilated with PEEP 0 cmH2O, b a pig ventilated with low PEEP (8 cmH2O), and c a pig ventilated at high PEEP (20 cmH2O). The energy load is composed of a static (when PEEP is higher than 0 cmH2O) and a dynamic contribution: global energy load = static energy load + dynamic energy load. Static energy load = [PEEP × PEEP volume/2] (light gray triangles). Dynamic energy load = (Peak pressure − PEEP) × TV/2 + (PEEP × TV) = [(PEEP + Peak pressure) × tidal volume / 2] (dark gray triangles (panel a) or trapezoids (panels b and c)). The dark gray trapezoids (panel b, c) are composed of a triangle (black dotted area), and a rectangle. The triangle represents the term (Peak pressure − PEEP) × TV/2, due to cyclic tidal breath; the rectangle represents the term (PEEP × TV) due to the ventilation (volume change) starting from a pressure level higher than zero (PEEP). Vertical dashed lines indicate PEEP and peak pressures; horizontal dashed lines PEEP volume and end-inspiratory volume (tidal volume is the difference between the two)
Fig. 4
Fig. 4
Outcomes in pigs according to end-inspiratory volumes. Mean(± standard deviation) for different variables. Pigs were grouped according to normalized inspiratory volume lower (BELOW), within (WITHIN), or higher (ABOVE) than normal inspiratory capacity and according to outcome: ALIVE (white bars) or DEAD (gray bars). The whole bar indicates a dynamic (coarse stack) and a static component (no pattern). A solid horizontal line represents the average reference value; medium-dashed lines represent mean ± 2 standard deviations reference values, i.e., the lower and upper limits of the variable. Statistical analysis: two-way ANOVA or on ranks, as appropriate (fixed effects: inspiratory volume and outcome). a Total end-inspiratory volume (mL/kg, whole bar) (Inspiratory volume P < 0.001, Outcome P = 0.073, Interaction = 0.067), tidal volume (mL/kg, coarse pattern) (Inspiratory volume P = 0.106, Outcome P = 0.040, Interaction P = 0.908), PEEP volume (mL/kg, no pattern) (Inspiratory volume P < 0.001, Outcome P = 0.306, Interaction P = 0.537). Reference value: inspiratory capacity (CT scan) normalized on body weight. b Total strain (whole bar) (Inspiratory volume P < 0.001, Outcome P = 0.059, Interaction P = 0.245), dynamic strain (coarse pattern) (Inspiratory volume P = 0.536, Outcome P = 0.004, Interaction P = 0.428), static strain (no pattern) (Inspiratory volume P = 0.006, Outcome P = 0.500, Interaction P = 0.438). Reference value: inspiratory capacity (CT scan) on FRC. c Absolute plateau airway pressure (whole bar) (Inspiratory volume P < 0.001, Outcome P = 0.107, Interaction P = 0.970), plateau airway pressure minus PEEP (coarse pattern) (Inspiratory volume P < 0.001, Outcome P < 0.001, Interaction P = 0.437), PEEP (no pattern) (Inspiratory volume P = 0.024, Outcome P = 0.271, Interaction P = 0.723). Reference value: airway pressure at upper inflation point (PV curve). d Total stress (whole bar) (Inspiratory volume P < 0.001, Outcome P = 0.797, Interaction P = 0.344), dynamic stress (coarse pattern) (Inspiratory volume P < 0.001, Outcome P = 0.092, Interaction P = 0.330), static stress (no pattern) (Inspiratory volume P = 0.014, Outcome P = 0.474, Interaction P = 0.756). Reference value: airway pressure reference values multiplied by the ratio of transpulmonary pressure at the upper inflation point (PV curve) to airway pressure at the upper inflation point
Fig. 5
Fig. 5
Outcomes of pigs and energy at peak airway pressure. Mean (± standard deviation) energy at peak airway pressure, expressed as joule. Pigs were grouped according to normalized inspiratory volume lower (BELOW), within (WITHIN) or higher (ABOVE) than normal inspiratory capacity. Pigs were also divided according to outcome: ALIVE (white bars) or DEAD (gray bars). The whole bar is composed of a dynamic component (coarse stack) and a static component (the stack with no pattern). A solid horizontal line indicates the average reference value of energy at 45 cmH2O airway pressure, medium-dashed lines represent mean ± 2 standard deviation reference values, i.e. the lower and the upper limits of the variable. Statistical analysis: two-way ANOVA on ranks (fixed effects: Inspiratory volume and Outcome). Total energy at peak airway pressure (entire bar) (Inspiratory volume P < 0.001, Outcome P < 0.001, Interaction = 0.804), dynamic energy at peak airway pressure (coarse pattern) (Inspiratory volume P = 0.005, Outcome P < 0.001, Interaction = 0.597), static energy at peak airway pressure (no pattern) (Inspiratory volume P = 0.002, Outcome P = 0.333, Interaction = 0.618). * P<0.05 between dead and alive pigs in the WITHIN group (see text for description)
Fig. 6
Fig. 6
Dynamic strain and increase in lung weight. Relationships between the dynamic strain and the lung weight increase. Pigs were grouped according to normalized inspiratory volume lower (BELOW), within (WITHIN) or higher (ABOVE) than normal inspiratory capacity. They were also divided according to PEEP (0 cmH2O, white dots; >0 cmH2O, black dots)

References

    1. Ashbaugh DG, Bigelow DB, Petty TL, Levine BE. Acute respiratory distress in adults. Lancet Lond Engl. 1967;2:319–323. doi: 10.1016/S0140-6736(67)90168-7. - DOI - PubMed
    1. Kumar A, Pontoppidan H, Falke KJ, et al. Pulmonary barotrauma during mechanical ventilation. Crit Care Med. 1973;1:181–186. doi: 10.1097/00003246-197307000-00001. - DOI - PubMed
    1. Dreyfuss D, Soler P, Basset G, Saumon G. High inflation pressure pulmonary edema. Respective effects of high airway pressure, high tidal volume, and positive end-expiratory pressure. Am Rev Respir Dis. 1988;137:1159–1164. doi: 10.1164/ajrccm/137.5.1159. - DOI - PubMed
    1. Muscedere JG, Mullen JB, Gan K, Slutsky AS. Tidal ventilation at low airway pressures can augment lung injury. Am J Respir Crit Care Med. 1994;149:1327–1334. doi: 10.1164/ajrccm.149.5.8173774. - DOI - PubMed
    1. Oeckler RA, Hubmayr RD (2008) Cell wounding and repair in ventilator injured lungs. Respir Physiol Neurobiol. doi:10.1016/j.resp.2008.06.019. - PMC - PubMed