. 2016 Apr;33(4):928-45.
doi: 10.1093/molbev/msv331. Epub 2015 Dec 15.

The Time Scale of Recombination Rate Evolution in Great Apes

Collaborators, Affiliations

The Time Scale of Recombination Rate Evolution in Great Apes

Laurie S Stevison et al. Mol Biol Evol. 2016 Apr.

Abstract

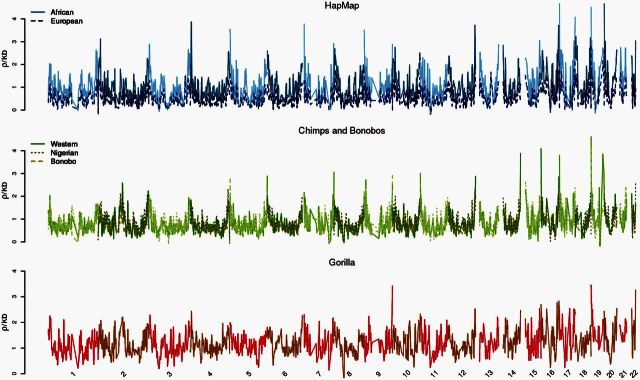
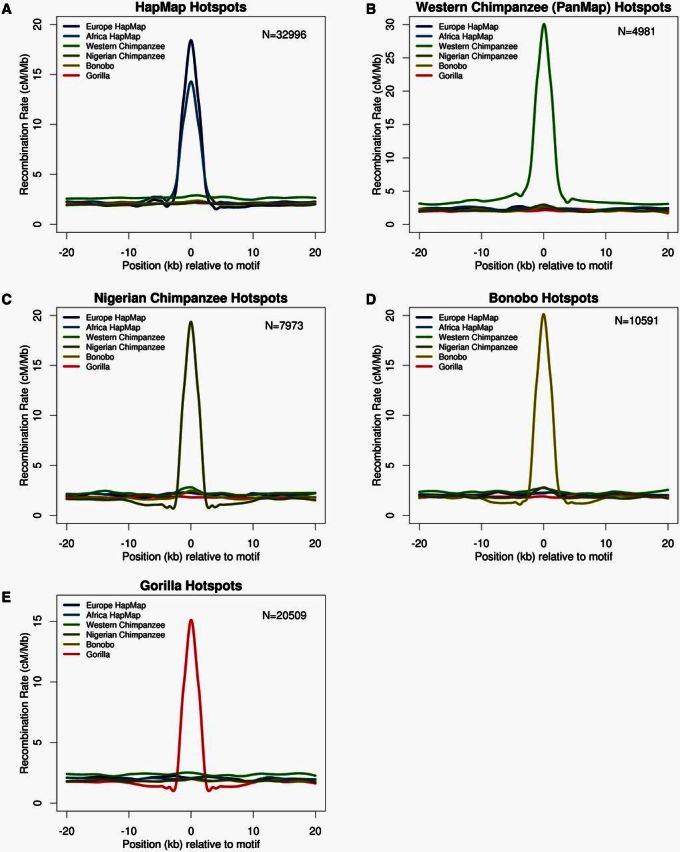
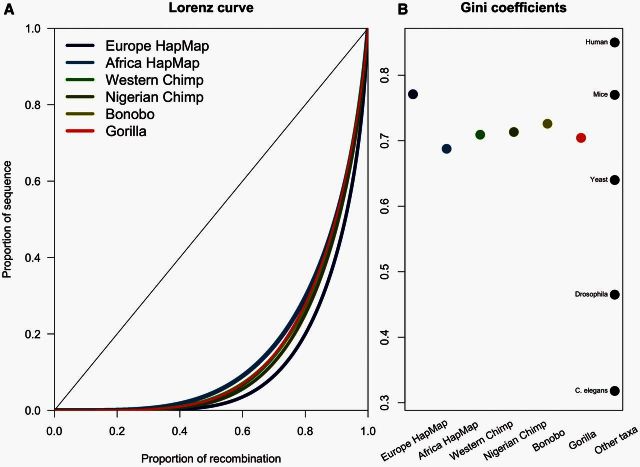
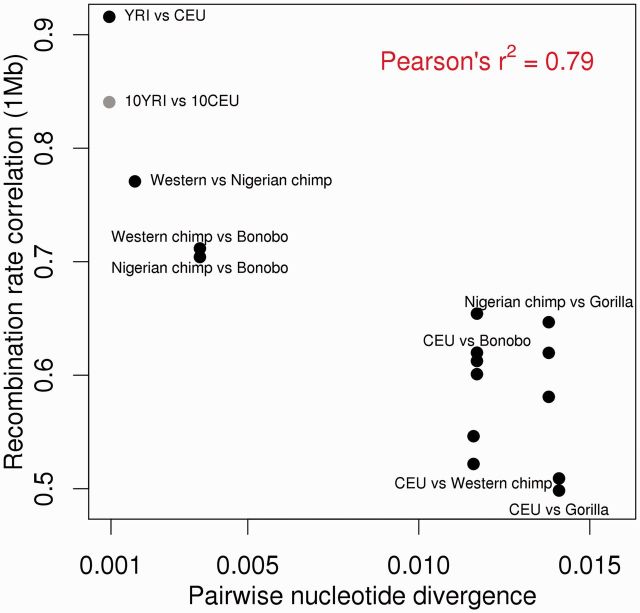
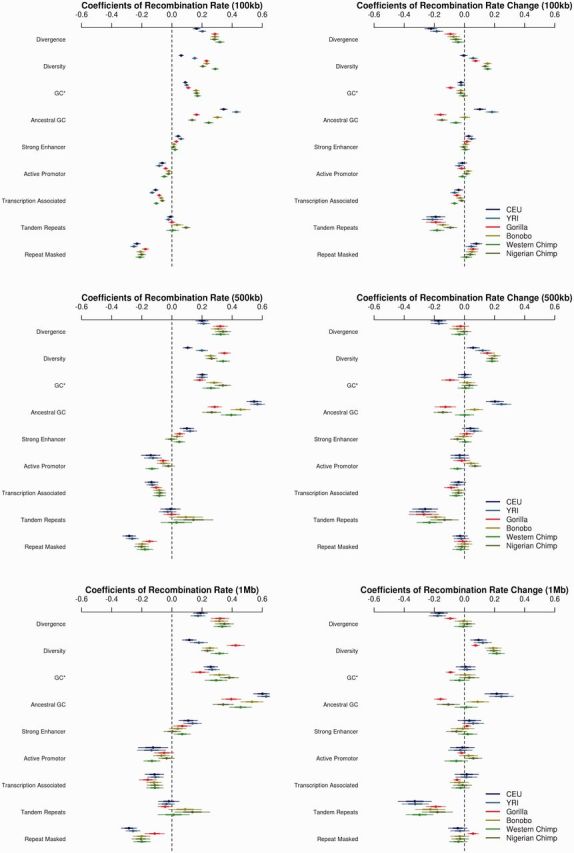
We present three linkage-disequilibrium (LD)-based recombination maps generated using whole-genome sequence data from 10 Nigerian chimpanzees, 13 bonobos, and 15 western gorillas, collected as part of the Great Ape Genome Project (Prado-Martinez J, et al. 2013. Great ape genetic diversity and population history. Nature 499:471-475). We also identified species-specific recombination hotspots in each group using a modified LDhot framework, which greatly improves statistical power to detect hotspots at varying strengths. We show that fewer hotspots are shared among chimpanzee subspecies than within human populations, further narrowing the time scale of complete hotspot turnover. Further, using species-specific PRDM9 sequences to predict potential binding sites (PBS), we show higher predicted PRDM9 binding in recombination hotspots as compared to matched cold spot regions in multiple great ape species, including at least one chimpanzee subspecies. We found that correlations between broad-scale recombination rates decline more rapidly than nucleotide divergence between species. We also compared the skew of recombination rates at centromeres and telomeres between species and show a skew from chromosome means extending as far as 10-15 Mb from chromosome ends. Further, we examined broad-scale recombination rate changes near a translocation in gorillas and found minimal differences as compared to other great ape species perhaps because the coordinates relative to the chromosome ends were unaffected. Finally, on the basis of multiple linear regression analysis, we found that various correlates of recombination rate persist throughout the African great apes including repeats, diversity, and divergence. Our study is the first to analyze within- and between-species genome-wide recombination rate variation in several close relatives.

Keywords: PRDM9; hotspots; primates; recombination.


Figures

F<sc>ig</sc>. 1.
Fig. 1.
Broad-scale comparisons of recombination rates across great apes. Genome-wide plot of recombination rate estimates for Europe and African human populations from HapMap, western chimpanzees from PanMap, and the three maps generated here, grouped within humans (N = 2), chimpanzees and bonobos (N = 3), and gorillas (N = 1) to highlight both within- and between-species differences. Alternating chromosomes are plotted in different colors to emphasize boundaries.
F<sc>ig</sc>. 2.
Fig. 2.
Hotspot rate correlation analysis. Degree of hotspot sharing and recombination rates for all maps in species-specific hotspots. Recombination rates for all maps 20 kb upstream and downstream of (A) human hotspots from HapMap, (B) western chimpanzee hotspot centers from PanMap, (C) Nigerian chimpanzee hotspot centers, (D) bonobo hotspot centers, and (E) western gorilla hotspot centers. Rates are shown in cM/Mb, and numbers of hotspots correspond to the number that mapped to hg18 genome.
F<sc>ig</sc>. 3.
Fig. 3.
Genome-wide distribution of recombination rates. Cumulative distribution or Lorenz curve of recombination rate plotted as proportion of recombination versus sequence for each recombination map (A). The diagonal represents a uniform distribution. Gini coefficients for each population map, and for comparison, other taxa reported in Kaur and Rockman (2014), including a human estimate from Kong et al. (2002) (B).
F<sc>ig</sc>. 4.
Fig. 4.
Recombination rate versus nucleotide divergence. Spearman rank correlation coefficient between all recombination maps at 1 Mb (y axis) versus the pairwise nucleotide divergence between pairs (x axis) with various comparisons labeled.
F<sc>ig</sc>. 5.
Fig. 5.
Genetic correlates of recombination rate. The predictors of recombination rate (left) and the change in recombination rate since the human–chimpanzee ancestor (right) at varying physical scales (top to bottom). Within each pane, multiple linear regression coefficient estimates (with standard errors, SEs) are shown for each of the independent variables across taxa. Larger coefficients reflect larger effects, while smaller SEs correspond to larger correlations.

References

    1. Altshuler D, Daly MJ, Lander ES. 2008. Genetic mapping in human disease. Science 322:881–888. - PMC - PubMed
    1. Altshuler D, Durbin RM, Abecasis GR, Bentley DR, Chakravarti A, Clark AG, Collins FS, De la Vega FM, Donnelly P, Egholm M, et al. 2010. A map of human genome variation from population-scale sequencing. Nature 467:1061–1073. - PMC - PubMed
    1. Arbeithuber B, Betancourt AJ, Ebner T, Tiemann-Boege I. 2015. Crossovers are associated with mutation and biased gene conversion at recombination hotspots. Proc Natl Acad Sci U S A. 112:2109–2114. - PMC - PubMed
    1. Asthana S, Noble WS, Kryukov G, Grant CE, Sunyaev S, Stamatoyannopoulos JA. 2007. Widely distributed noncoding purifying selection in the human genome. Proc Natl Acad Sci U S A. 104:12410–12415. - PMC - PubMed
    1. Auton A, Fledel-Alon A, Pfeifer S, Venn O, Segurel L, Street T, Leffler EM, Bowden R, Aneas I, Broxholme J, et al. 2012. A fine-scale chimpanzee genetic map from population sequencing. Science 336:193–198. - PMC - PubMed

Publication types