. 2015 Dec 16;88(6):1227-1239.
doi: 10.1016/j.neuron.2015.11.010. Epub 2015 Dec 6.

Enkephalin Disinhibits Mu Opioid Receptor-Rich Striatal Patches via Delta Opioid Receptors

Affiliations

Enkephalin Disinhibits Mu Opioid Receptor-Rich Striatal Patches via Delta Opioid Receptors

Matthew Ryan Banghart et al. Neuron. .

Abstract

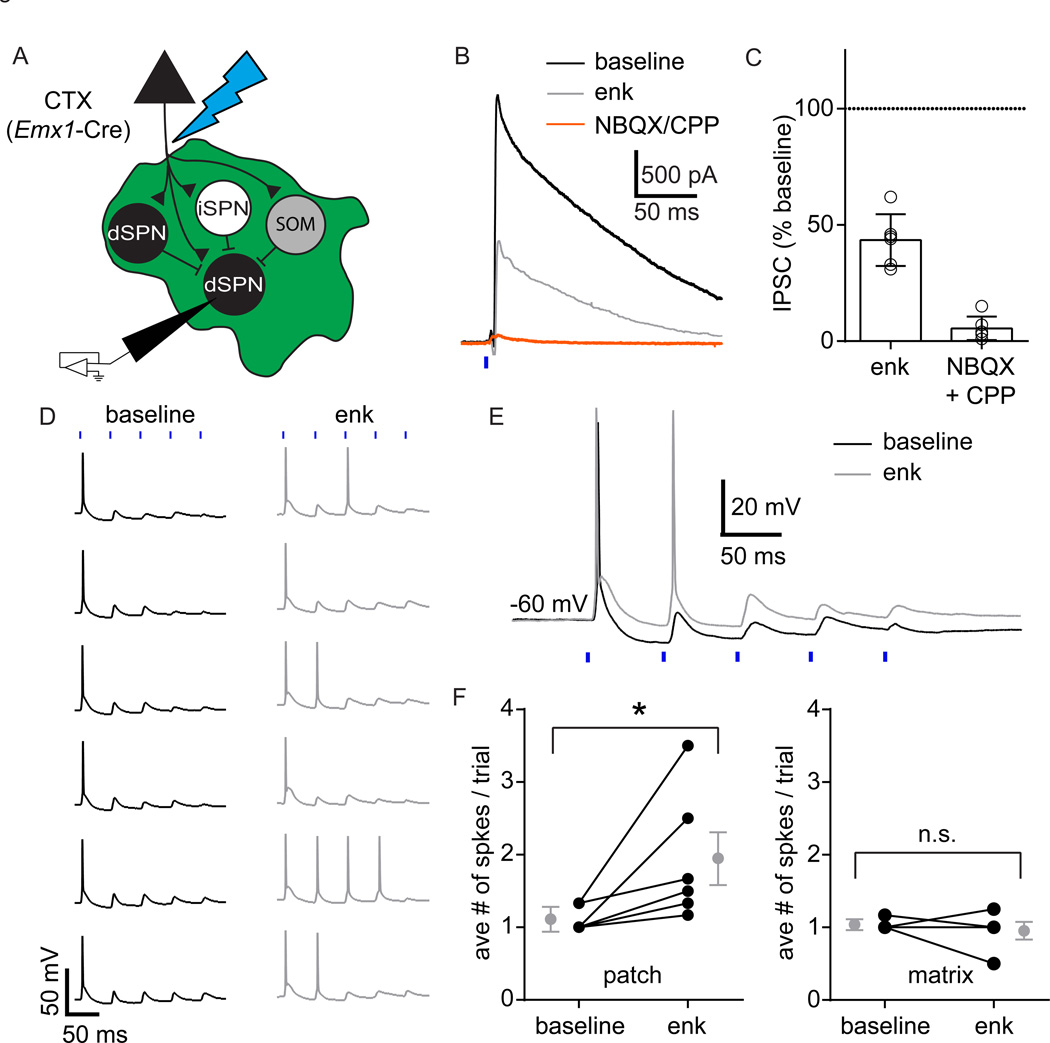
Opioid neuropeptides and their receptors are evolutionarily conserved neuromodulatory systems that profoundly influence behavior. In dorsal striatum, which expresses the endogenous opioid enkephalin, patches (or striosomes) are limbic-associated subcompartments enriched in mu opioid receptors. The functional implications of opioid signaling in dorsal striatum and the circuit elements in patches regulated by enkephalin are unclear. Here, we examined how patch output is modulated by enkephalin and identified the underlying circuit mechanisms. We found that patches are relatively devoid of parvalbumin-expressing interneurons and exist as self-contained inhibitory microcircuits. Enkephalin suppresses inhibition onto striatal projection neurons selectively in patches, thereby disinhibiting their firing in response to cortical input. The majority of this neuromodulation is mediated by delta, not mu-opioid, receptors, acting specifically on intra-striatal collateral axons of striatopallidal neurons. These results suggest that enkephalin gates limbic information flow in dorsal striatum, acting via a patch-specific function for delta opioid receptors.


Figures

Figure 1
Figure 1. Visualization of patch and matrix compartments in Pdyn-EGFP transgenic mice
(A) Fluorescence image of a coronal section of a Pdyn-EGFP (green, left) mouse immunolabeled against the mu opioid receptor (MOR) (red, middle). EGFP expression closely matches the distribution of MOR-rich patches (right). (B) Confocal fluorescence image of a striatal patch (green) in a coronal slice of a Pdyn-EGFP (green) and Drd1a-tdTomato (red) double transgenic mouse immunolabeled against the neuronal marker NeuN (blue). EGFP is expressed in patches only in dSPNs, which express tdTomato (right). (C) Quantification of Drd1a-tdTomato+ cells in patches and matrix. The percentage of NeuN+ cells expressing tdTomato was higher in patches than in the matrix. Bars graphs indicate the mean (± SEM). *p<0.05 using a two-tailed Mann-Whitney U test. (D) Quantification of cell density in patch and matrix compartments. Cell classes were immunolabeled for identification in sections from Pdyn-EGFP mice. No significant difference in the density of NeuN+ cells (left), or SOM+ interneurons (middle) was observed, whereas PV+ interneurons were more abundant in the matrix. Examples of SOM and PV immunolabeling are presented in Figure S2. *p<0.05 using a two-tailed Mann-Whitney U test.
Figure 2
Figure 2. Anatomical and functional isolation of patch and matrix compartments
(A) Confocal image fluorescence image of a neurobiotin-filled dSPN located near the border within a patch. The dendrites of this patch SPN remained within the patch. (B) Electrical stimulation with a small bipolar electrode reveals a lack of inter-compartmental inhibitory synaptic connectivity. left, IPSC amplitude dropped dramatically when the stimulating electrode was moved at equal distance from the cell body into the matrix, as depicted in the schematic. right, Representative traces (average of 3 trials) obtained with the electrode placed 70 µm away from the recorded cell in the patch (red) and matrix (purple). (C) Summary plot with the IPSC amplitudes evoked in each patch neuron by stimulation in the patch and matrix shown as connected dots. Averages across cells are shown in gray (mean ± SEM). *p<0.05, one-tailed Wilcoxon signed-rank test.
Figure 3
Figure 3. Opioid receptor distribution in SPNs as revealed by 3-color FISH
(A) Example of staining within a patch for Prodynorphin (Pdyn, green), the mu opioid receptor (Oprm1, magenta) and the D2 dopamine receptor (Drd2, white). Although there is very little co-localization of Pdyn and Drd2, Oprm1 is found with both transcripts. Large arrowheads indicate example Pdyn+ cells and small arrows indicate Drd2+ cells. Nuclear DAPI staining is omitted for clarity. (B) Example of staining within a patch for Pdyn (green), the delta opioid receptor (Oprd1, magenta) and Drd2 (white). Oprd1 is only found in cells expressing Drd2. (C) Quantification of the co-expression of Drd2, Oprm1 and Oprd1 with Pdyn. Bars represent the mean (+SEM) percentage of Pdyn+ DAPI-stained nuclei also expressing the indicated transcripts. *p<0.05 using a two-tailed Mann-Whitney U test. Oprm1, but not Oprd1, is found in cells expressing Pdyn. (D) Quantification of the co-expression of Pdyn, Oprm1 and Oprd1 with Drd2. Bars represent the mean percentage (+SEM) of Drd2+ DAPI-stained nuclei also expressing the indicated transcripts. Both Oprm1 and Oprd1 are found in cells expressing Drd2. (E) Example of staining within a patch for Pdyn (white), Oprd1 (green) Oprm1 (magenta). Oprm1 and Oprd1 are co-expressed but only in Pdyn− cells. Large arrowheads indicate example Pdyn+ cells and small arrows indicate example Oprd1+ cells. Summary data for E are presented in Figure S6C.
Figure 4
Figure 4. Enkephalin suppresses inhibition onto dSPNs and iSPNs in patches but not matrix
(A) Cell-attached recordings of action potential firing from a dSPN (left) and iSPN (right) in the absence (top) and presence (bottom) of enk (30 µM), evoked by a 2 second 473 nm blue light ramp. Action potential firing is unchanged by enk. ChR2 was targeted to dSPNs or iSPNs using the following transgenic animals: Drd1a-Cre;Pdyn-EGFP for dSPNs; Adora2A-Cre;Pdyn-EGFP for iSPNs; and Dlg3-Cre;Drd1a-tdTomato;Ai32 for either (see Figure S7A). (B) Summary data showing average number of spikes per trial evoked during the 2-second stimulus in the presence of enk normalized to baseline. Averages from each cell are shown as open circles. The superimposed bars indicate the mean (± SD). (C) Schematic illustrating the experimental configuration. Whole-cell voltage-clamp recordings of dSPNs or iSPNs were obtained in the patch or matrix compartments in acute brain slices from Pdyn-EGFP;Drd1a-tdTomato mice. Glass stimulating electrodes were placed in the same compartment within 100 µm of the recorded cell. (D) Example of electrically-evoked IPSCs recorded in the matrix (left) or patch (right) before (black) and after (gray) application of enk. Single trial examples are shown. (E) Average normalized IPSC amplitude (± SEM) over time during enk application for dSPNs in the matrix (squares) and patch (circles) compartments. IPSCs were strongly suppressed in patches but not matrix. For iSPNs, see Figure S7C. (F) Summary data showing average baseline normalized IPSCs measured in the presence of enk. Averages from individual cells are shown as open squares (matrix) and circles (patch). The superimposed bars indicate the mean ± SEM. *p<0.05 using a two-tailed Mann-Whitney U test. (G) Average normalized IPSC amplitudes (± SEM) over time for dSPNs in patches during enk application in the presence of an opioid antagonist cocktail (3 µM naloxone; 3 µM SDM25N). Enk did not suppress inhibition in the presence of opioid antagonists. (H) Example recording from a dSPN showing that the enk effect was reversed with an opioid antagonist cocktail (3 µM naloxone; 3 µM SDM25N). (I) Summary plot of the baseline-normalized average IPSCs evoked in dSPNs in the presence of enk and after reversal with opioid antagonists. The averages (±SEM) for individual neurons are shown as connected dots and across cells in gray. *p<0.05, one-tailed Wilcoxon signed-rank test.
Figure 5
Figure 5. DORs, not MORs, dominate the suppression of inhibition by enkephalin
(A) Fluorescence images of EGFP expression in coronal sections taken from Pdyn-EGFP;Oprm1−/− (left) and Pdyn-EGFP;Oprd1−/− (right) mice. In both cases patches are present and do not display gross abnormalities. (B) Average normalized IPSC amplitudes (± SEM) over time during enk application for neurons from Pdyn-EGFP;Oprm1−/− (gray) and Pdyn-EGFP/Oprd1−/− (black) mice. In both cases IPSCs were suppressed by enk. (C) Summary plot of the normalized average IPSCs in enk measured in Pdyn-EGFP;Oprm1−/− and Pdyn-EGFP;Oprd1−/− mice as well as in wild-type Pdyn-EGFP mice in the presence of the MOR agonist DAMGO, the DOR agonist SNC-80, the two combined, or enk (from Figure 4F). Although both DAMGO and SNC-80 significantly suppressed IPSCs, SNC-80 had a larger effect. The actions of co-applied SNC-80 and DAMGO were similar to enk. Averages from each cell are shown as open circles. The superimposed bars indicate the mean (± SEM). *p<0.05 using a two-tailed Mann-Whitney U test.
Figure 6
Figure 6. Optogenetic activation of striatal cell classes reveals that inhibition arising from dSPNs and iSPNs is suppressed by enkephalin in patches
(A) Synaptic inhibition originating from SOM interneurons is not suppressed by enk. Top: schematic depicting selective optogenetic activation of SOM interneurons in Sst-Cre;Pdyn-EGFP mice during whole-cell voltage-clamp recordings from dSPNs in patches. Bottom: summary plot of the normalized average IPSCs measured in enk. Averages from each cell are shown as open circles. The superimposed bars indicate the mean (± SEM). (B) Synaptic inhibition originating from dSPNs is suppressed by enk and DAMGO, but not SNC-80. Top: schematic depicting selective optogenetic activation of dSPNs in Drd1a-Cre;Pdyn-EGFP mice during whole-cell voltage-clamp recordings from dSPNs in patches. Bottom: summary plot of the normalized average IPSC measured in enk, DAMGO and SNC-80. (C) Synaptic inhibition originating from iSPNs is suppressed by enk, DAMGO, and SNC-80. Top: schematic depicting selective optogenetic activation of iSPNs in Adora2A-Cre;Pdyn-EGFP mice during whole-cell voltage-clamp recordings from dSPNs in patches. Bottom: summary plot of the normalized average IPSC measured in enk, DAMGO and SNC-80. SNC-80 had a significantly greater effect than DAMGO. *p<0.05 using a two-tailed Mann-Whitney U test.
Figure 7
Figure 7. Enkephalin disinhibits dSPNs in patches
(A) Schematic depicting optogenetic activation of the striatal microcircuit in brain slice by driving corticostriatal inputs in Emx1-Cre;Pdyn-EGFP;Drd1a-tdTomato;Ai34 mice. (B) Disynaptic inhibition in patches is suppressed by enk. Example IPSCs in the absence (baseline, black) and presence of enk (gray), and after the addition of NBQX and CPP (orange) to block excitatory transmission. (C) Summary plot of the normalized average IPSC measured in enk and NBQX+CPP. Averages from each cell are shown as open circles. The superimposed bars indicate the mean (± SEM). (D) Synaptically-driven action potentials are facilitated by enk. Example current-clamp recording from a patch dSPN that was stimulated by 5 blue light flashes (20 Hz) before (black) and after (gray) enk application. Data were acquired every 20 s. (E) Superimposed single-trial example responses to the blue light stimulus before (black) and after (gray) enk application. In this example, suppression of the co-incident IPSP by enk can be observed. (F) dSPNs are disinhibited in the patch, but not matrix compartment. Summary plots of the average number of spikes per trial during the baseline period and after enk application, recorded from cells located in the patch (left) and matrix (right) compartments. The averages (±SEM) for individual neurons are shown as connected dots and across cells in gray. *p<0.05, two-tailed Wilcoxon signed-rank test.
Figure 8
Figure 8. Summary model of enkephalin modulation of the patch microcircuit
Patches and matrix receive different cortical inputs and locally process information with different contributions from PV interneurons. Local inhibition suppresses repetitive, high frequency firing in response to cortical drive. By reducing inhibition from SPN collaterals via activation of MORs on dSPNs and iSPNs and DORs on iSPNs, enkephalin facilitates information flow through patches, but not matrix.

Comment in

References

    1. Ade KK, Wan Y, Chen M, Gloss B, Calakos N. An Improved BAC Transgenic Fluorescent Reporter Line for Sensitive and Specific Identification of Striatonigral Medium Spiny Neurons. Front. Syst. Neurosci. 2011;5:32. - PMC - PubMed
    1. Atwood BK, Kupferschmidt DA, Lovinger DM. Opioids induce dissociable forms of long-term depression of excitatory inputs to the dorsal striatum. Nat. Neurosci. 2014;17:540–548. - PMC - PubMed
    1. Bals-Kubik R, Ableitner A, Herz A, Shippenberg TS. Neuroanatomical sites mediating the motivational effects of opioids as mapped by the conditioned place preference paradigm in rats. J. Pharmacol. Exp. Ther. 1993;264:489–495. - PubMed
    1. Banghart MR, Sabatini BL. Photoactivatable neuropeptides for spatiotemporally precise delivery of opioids in neural tissue. Neuron. 2012;73:249–259. - PMC - PubMed
    1. Besson MJ, Graybiel AM, Quinn B. Co-expression of neuropeptides in the cat’s striatum: an immunohistochemical study of substance P, dynorphin B and enkephalin. Neuroscience. 1990;39:33–58. - PubMed

Publication types

LinkOut - more resources