Comparative Study
. 2015 Dec 21;25(24):3161-9.
doi: 10.1016/j.cub.2015.10.060. Epub 2015 Dec 6.

Gut Microbiome Diversity among Cheyenne and Arapaho Individuals from Western Oklahoma

Affiliations
Comparative Study

Gut Microbiome Diversity among Cheyenne and Arapaho Individuals from Western Oklahoma

Krithivasan Sankaranarayanan et al. Curr Biol. .

Abstract

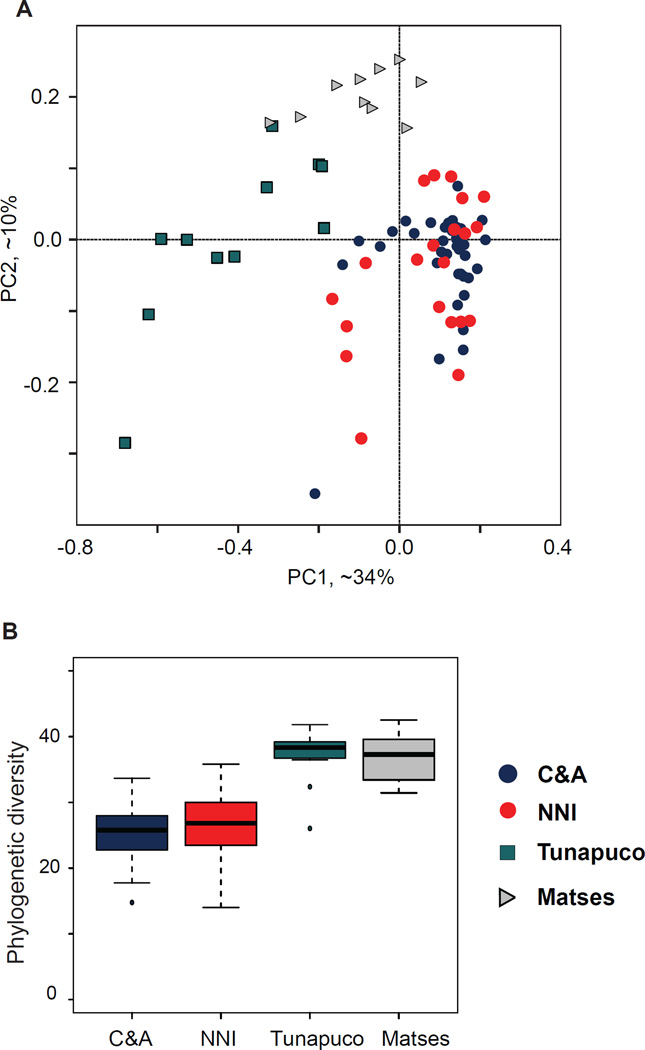
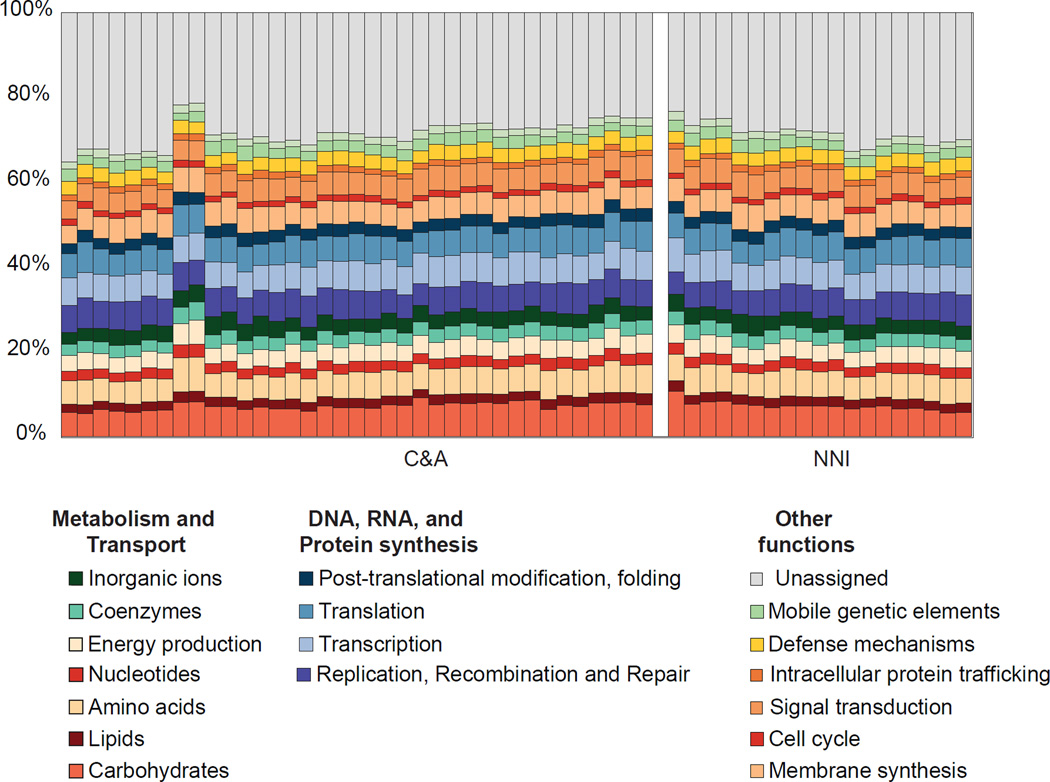
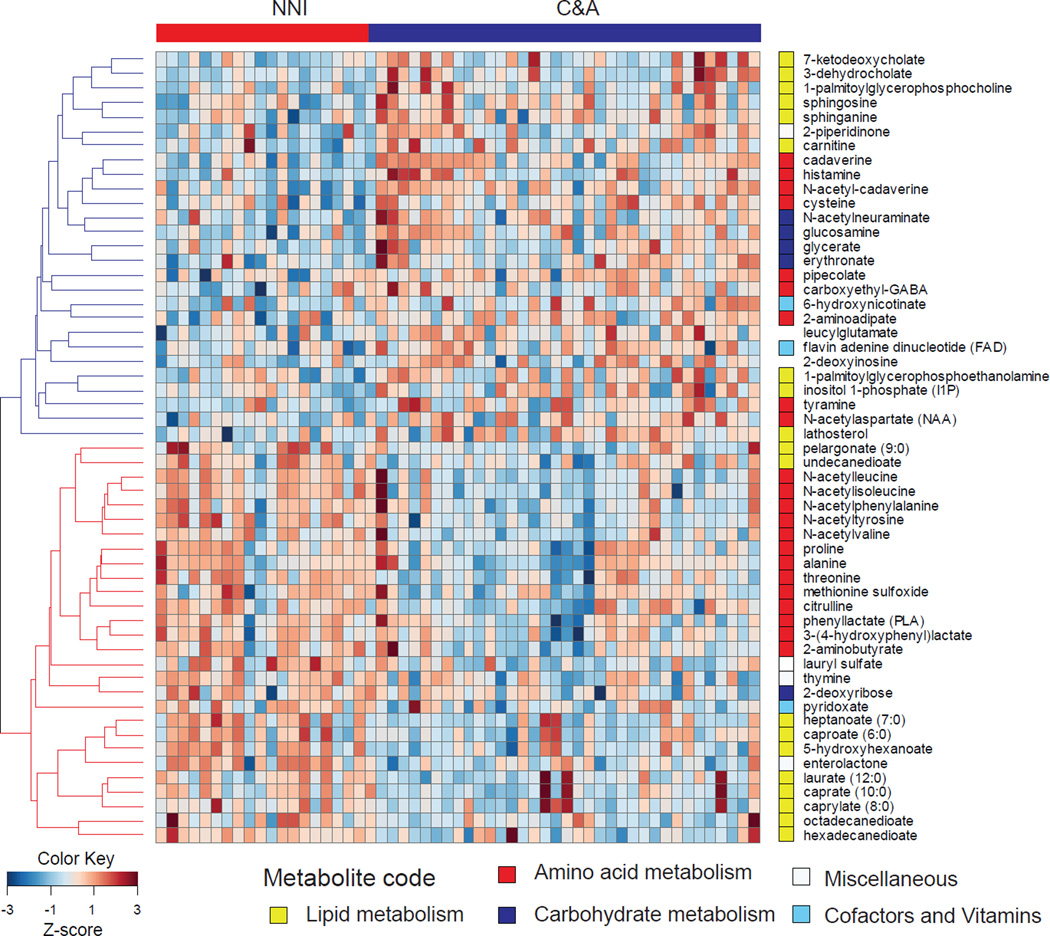
Existing studies characterizing gut microbiome variation in the United States suffer from population ascertainment biases, with individuals of American Indian ancestry being among the most underrepresented. Here, we describe the first gut microbiome diversity study of an American Indian community. We partnered with the Cheyenne and Arapaho (C&A), federally recognized American Indian tribes in Oklahoma, and compared gut microbiome diversity and metabolic function of C&A participants to individuals of non-native ancestry in Oklahoma (NNIs). While the C&A and NNI participants share microbiome features common to industrialized populations, the C&A participants had taxonomic profiles characterized by a reduced abundance of the anti-inflammatory bacterial genus Faecalibacterium, along with a fecal metabolite profile similar to dysbiotic states described for metabolic disorders. American Indians are known to be at elevated risk for metabolic disorders. While many aspects of this health disparity remain poorly understood, our results support the need to further study the microbiome as a contributing factor. As the field of microbiome research transitions to therapeutic interventions, it raises concerns that the continued exclusion and lack of participation of American Indian communities in these studies will further exacerbate health disparities. To increase momentum in fostering these much needed partnerships, it is essential that the scientific community actively engage in and recruit these vulnerable populations in basic research through a strategy that promotes mutual trust and understanding, as outlined in this study.


Conflict of interest statement

Disclosure declaration

The authors declare no conflict of interest.

Figures

Figure 1
Figure 1. Gut microbiome diversity among the C&A
(A) Phylum level taxonomic summaries. Each column represents an individual. Individuals are grouped by town. Shaded bars below the graph indicate metadata values for individuals. Dark and light shades correspond to self-reported T2D (positive/negative), Antibiotic use (positive/negative), and Sex (Female/Male) respectively. BMI status is shaded light to dark, corresponding to normal, overweight, and obese categories respectively. See also Table S1, S2 and Figure S1. (B) Relative abundance distribution of the top 15 genera commonly observed among the C&A. Error bars indicate 95% confidence intervals (C) and (D) PCoA plots generated from weighted UniFrac distance matrix. Individuals are color-coded by smoking status (C), and antibiotic use (D), with blue depicting presence, and red depicting absence. All analyses were performed on OTU tables rarefied to 10,000 reads per individual.
Figure 2
Figure 2. Microbiome diversity comparisons between C&A, and previously published data from NNI and native South American populations (Matses, Tunapuco)
[7]. All analyses were performed on OTU tables rarefied to 10,000 reads per individual. All analyses were limited to adults (>18 years of age). Individuals are color coded by population. (A) PCoA plot generated from weighted UniFrac distance matrix. The C&A and NNI individuals cluster separately from the Matses and Tunapuco. (B) Microbial richness as measured by phylogenetic diversity. The C&A and NNI have reduced microbial richness compared to the Matses and Tunapuco populations. Error bars indicate 95% confidence intervals. Phylum level taxonomic summaries are provided in Figure S2.
Figure 3
Figure 3. Summary of gut microbiome functional potential generated from COG annotation of assembled contigs
Within the C&A and NNI, individuals are hierarchically clustered. Analyses were performed on COG tables rarefied to a total contig abundance of 1,000,000 per individual. Assembly and annotation statistics are provided in Table S3.
Figure 4
Figure 4. Heatmap depicting metabolites showing significant differences between the C&A and NNI populations
Metabolites are color-coded by functional pathway. Raw metabolite data is provided in Table S4. Diet –metabolite and Taxa-metabolite correlations within the C&A are summarized in tables S5, and S6 respectively.

References

    1. Davenport ER, Mizrahi-Man O, Michelini K, Barreiro LB, Ober C, Gilad Y. Seasonal variation in human gut microbiome composition. PloS one. 2014;9:e90731. - PMC - PubMed
    1. O'Keefe SJ, Li JV, Lahti L, Ou J, Carbonero F, Mohammed K, Posma JM, Kinross J, Wahl E, Ruder E, et al. Fat, fibre and cancer risk in African Americans and rural Africans. Nat Commun. 2015;6:6342. - PMC - PubMed
    1. Lewis CM, Jr, Obregon-Tito A, Tito RY, Foster MW, Spicer PG. The Human Microbiome Project: lessons from human genomics. Trends Microbiol. 2012;20:1–4. - PMC - PubMed
    1. Fortenberry JD. The uses of race and ethnicity in human microbiome research. Trends Microbiol. 2013;21:165–166. - PubMed
    1. Tito RY, Macmil S, Wiley G, Najar F, Cleeland L, Qu C, Wang P, Romagne F, Leonard S, Ruiz AJ, et al. Phylotyping and functional analysis of two ancient human microbiomes. PLoS One. 2008;3:e3703. - PMC - PubMed

Publication types

LinkOut - more resources