

Electrocortical Dynamics in Children with a Language-Learning Impairment Before and After Audiovisual Training
- PMID: 26671710
- PMCID: PMC4829628
- DOI: 10.1007/s10548-015-0466-y
Electrocortical Dynamics in Children with a Language-Learning Impairment Before and After Audiovisual Training
Abstract
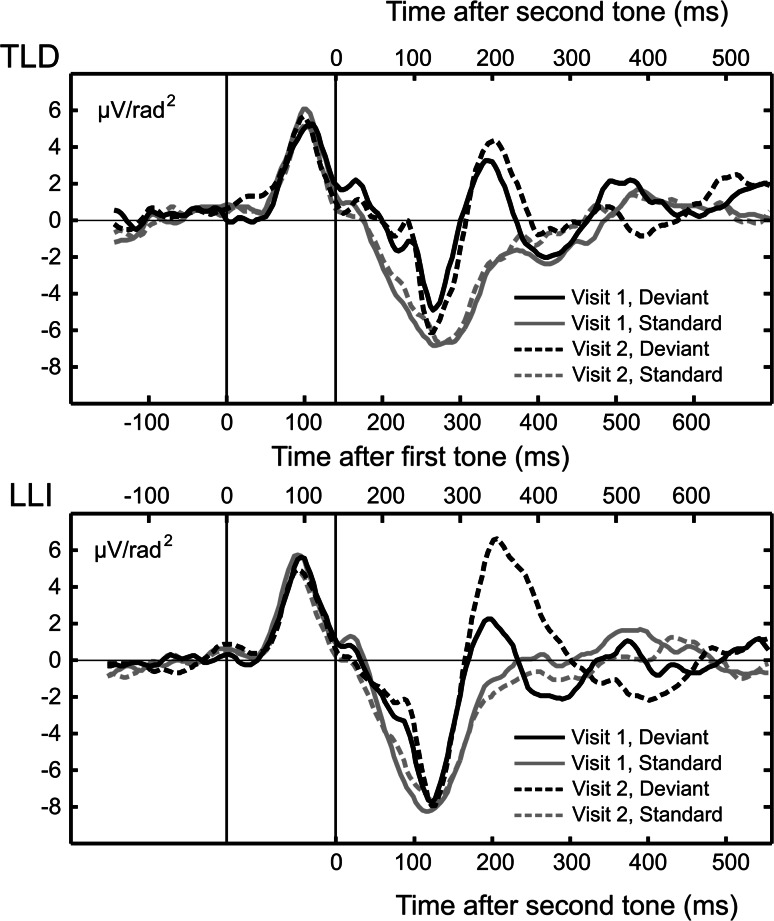
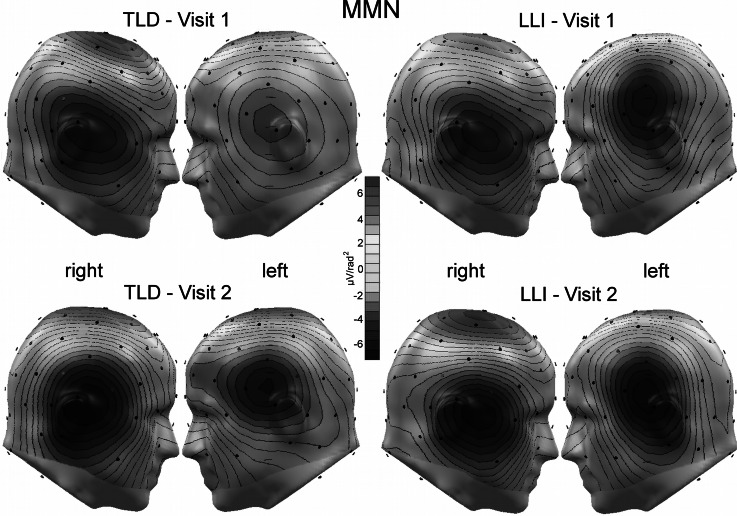
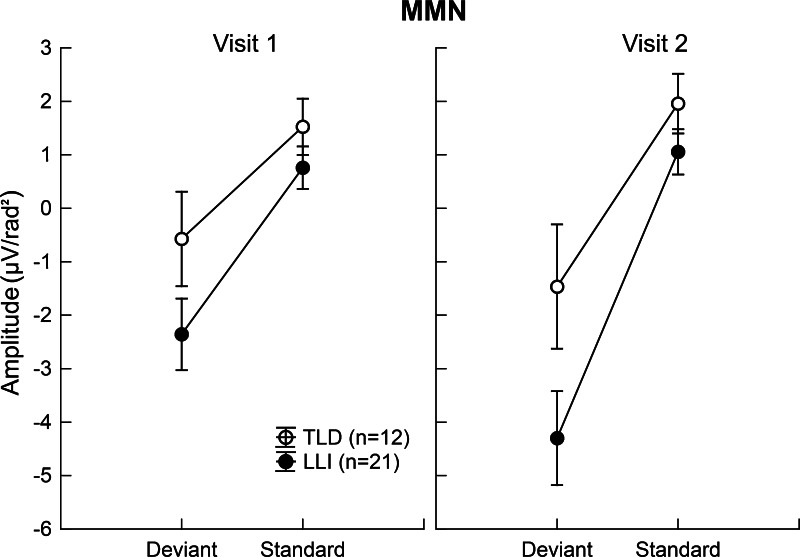
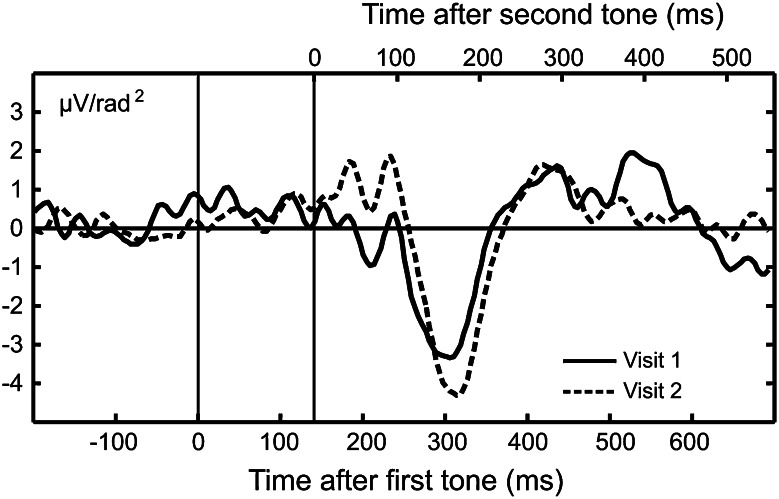
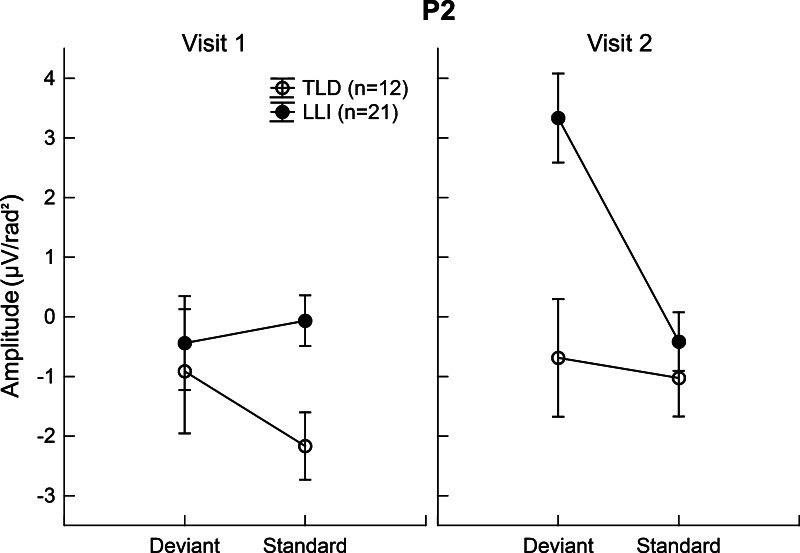
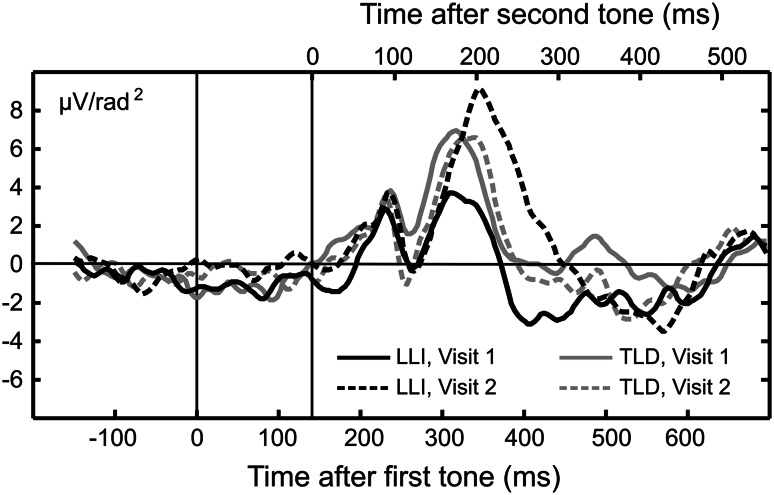
Detecting and discriminating subtle and rapid sound changes in the speech environment is a fundamental prerequisite of language processing, and deficits in this ability have frequently been observed in individuals with language-learning impairments (LLI). One approach to studying associations between dysfunctional auditory dynamics and LLI, is to implement a training protocol tapping into this potential while quantifying pre- and post-intervention status. Event-related potentials (ERPs) are highly sensitive to the brain correlates of these dynamic changes and are therefore ideally suited for examining hypotheses regarding dysfunctional auditory processes. In this study, ERP measurements to rapid tone sequences (standard and deviant tone pairs) along with behavioral language testing were performed in 6- to 9-year-old LLI children (n = 21) before and after audiovisual training. A non-treatment group of children with typical language development (n = 12) was also assessed twice at a comparable time interval. The results indicated that the LLI group exhibited considerable gains on standardized measures of language. In terms of ERPs, we found evidence of changes in the LLI group specifically at the level of the P2 component, later than 250 ms after the onset of the second stimulus in the deviant tone pair. These changes suggested enhanced discrimination of deviant from standard tone sequences in widespread cortices, in LLI children after training.
Keywords: Auditory sequential processing; Computerized training; Electroencephalography (EEG); Event-related potential (ERP); Specific language impairment (SLI).
Figures
Similar articles
-
Auditory pre-attentive processing of Chinese tones.Chin Med J (Engl). 2008 Dec 5;121(23):2429-33. Chin Med J (Engl). 2008. PMID: 19102963 Clinical Trial.
-
Processing of audiovisually congruent and incongruent speech in school-age children with a history of specific language impairment: a behavioral and event-related potentials study.Dev Sci. 2015 Sep;18(5):751-70. doi: 10.1111/desc.12263. Epub 2014 Nov 29. Dev Sci. 2015. PMID: 25440407 Free PMC article.
-
Early gamma oscillations during rapid auditory processing in children with a language-learning impairment: changes in neural mass activity after training.Neuropsychologia. 2013 Apr;51(5):990-1001. doi: 10.1016/j.neuropsychologia.2013.01.011. Epub 2013 Jan 24. Neuropsychologia. 2013. PMID: 23352997 Free PMC article.
-
Influence of musical expertise and musical training on pitch processing in music and language.Restor Neurol Neurosci. 2007;25(3-4):399-410. Restor Neurol Neurosci. 2007. PMID: 17943015 Review.
-
Time is of the Essence: A Review of Electroencephalography (EEG) and Event-Related Brain Potentials (ERPs) in Language Research.Appl Psychophysiol Biofeedback. 2017 Dec;42(4):247-255. doi: 10.1007/s10484-017-9371-3. Appl Psychophysiol Biofeedback. 2017. PMID: 28698970 Free PMC article. Review.
Cited by
-
Resting-state EEG alpha rhythm spectral power in children with specific language impairment: a cross-sectional study.J Appl Biomed. 2023 Sep;21(3):113-120. doi: 10.32725/jab.2023.013. Epub 2023 Sep 18. J Appl Biomed. 2023. PMID: 37747311
-
Training-Induced Changes in Rapid Auditory Processing in Children With Specific Language Impairment: Electrophysiological Indicators.Front Hum Neurosci. 2018 Aug 7;12:310. doi: 10.3389/fnhum.2018.00310. eCollection 2018. Front Hum Neurosci. 2018. PMID: 30131683 Free PMC article.
-
Complex mismatch negativity to tone pair deviants in long-term schizophrenia and in the first-episode schizophrenia spectrum.Schizophr Res. 2018 Jan;191:18-24. doi: 10.1016/j.schres.2017.04.044. Epub 2017 May 12. Schizophr Res. 2018. PMID: 28506707 Free PMC article.
References
-
- Benasich AA, Choudhury N, Friedman JT, Realpe-Bonilla T, Chojnowska C, Gou Z. The infant as a prelinguistic model for language learning impairments: predicting from event-related potentials to behavior. Neuropsychologia. 2006;44:396–411. doi: 10.1016/j.neuropsychologia.2005.06.004. - DOI - PMC - PubMed
-
- Benjamini Y, Hochberg Y. Controlling the false discovery rate: a practical and powerful approach to multiple testing. J R Statist Soc B. 1995;57:289–300.
Publication types
MeSH terms
Grants and funding
LinkOut - more resources
Full Text Sources
Other Literature Sources
Medical
