

Simultaneous CT-MRI Reconstruction for Constrained Imaging Geometries Using Structural Coupling and Compressive Sensing
- PMID: 26672028
- PMCID: PMC4930897
- DOI: 10.1109/TBME.2015.2487779
Simultaneous CT-MRI Reconstruction for Constrained Imaging Geometries Using Structural Coupling and Compressive Sensing
Abstract
Objective: A unified reconstruction framework is presented for simultaneous CT-MRI reconstruction.
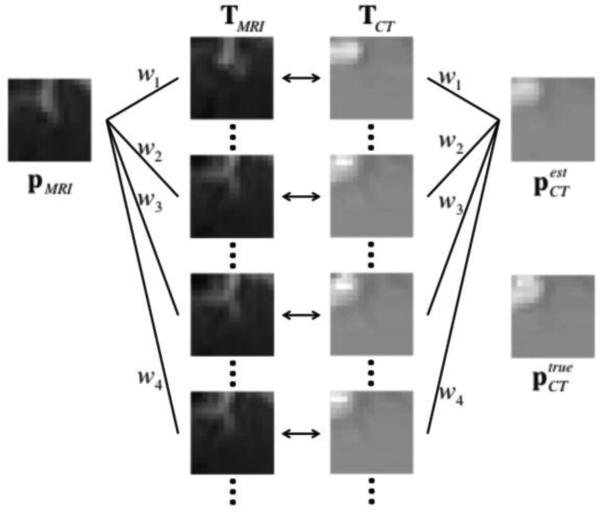
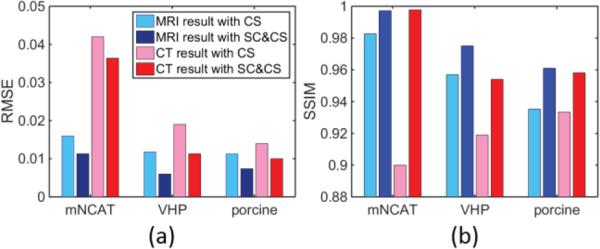
Methods: In an ideal CT-MRI scanner, CT and MRI acquisitions would occur simultaneously, and would be inherently registered in space and time. Alternatively, separately acquired CT and MRI scans can be fused to simulate an instantaneous acquisition. In this study, structural coupling and compressive sensing techniques are combined to unify CT and MRI reconstructions. A bidirectional image estimation method was proposed to connect images from different modalities. Hence, CT and MRI data serve as prior knowledge to each other for better CT and MRI image reconstruction than what could be achieved with separate reconstruction.
Significance: Combined CT-MRI imaging has the potential for improved results in existing preclinical and clinical applications, as well as opening novel research directions for future applications.
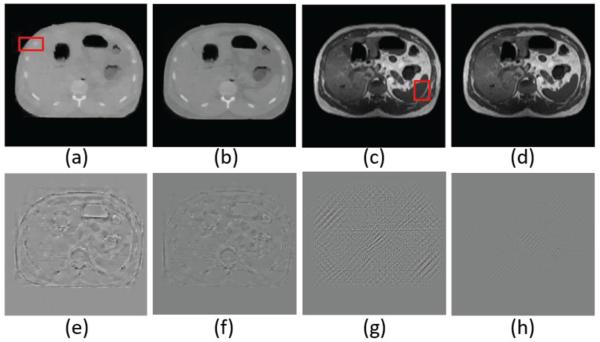
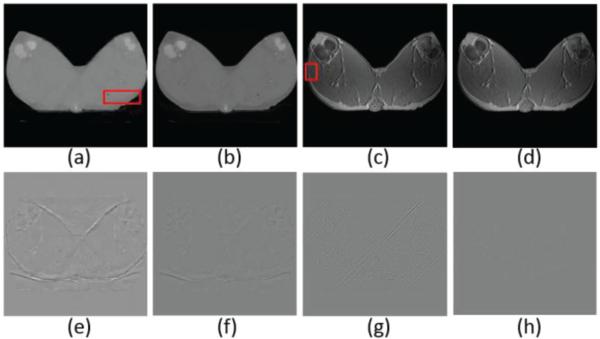
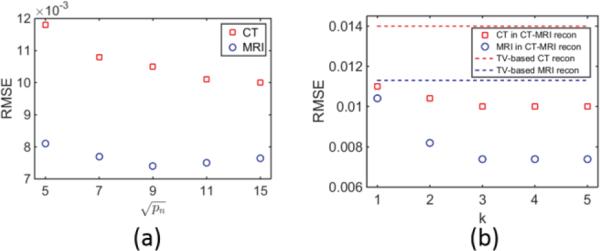
Results: Our integrated reconstruction methodology is demonstrated with numerical phantom and real-dataset-based experiments, and has yielded promising results.
Figures


Similar articles
-
Wavelet-based joint CT-MRI reconstruction.J Xray Sci Technol. 2018;26(3):379-393. doi: 10.3233/XST-17324. J Xray Sci Technol. 2018. PMID: 29562574
-
Radiation dose reduction in medical x-ray CT via Fourier-based iterative reconstruction.Med Phys. 2013 Mar;40(3):031914. doi: 10.1118/1.4791644. Med Phys. 2013. PMID: 23464329 Free PMC article.
-
Edge-oriented dual-dictionary guided enrichment (EDGE) for MRI-CT image reconstruction.J Xray Sci Technol. 2016;24(1):161-75. doi: 10.3233/XST-160540. J Xray Sci Technol. 2016. PMID: 26890909
-
CT artifact correction for sparse and truncated projection data using generative adversarial networks.Med Phys. 2021 Feb;48(2):615-626. doi: 10.1002/mp.14504. Epub 2020 Dec 30. Med Phys. 2021. PMID: 32996149 Review.
-
Picture the future: emerging imaging modalities.Clin Med (Lond). 2014 Dec;14 Suppl 6:s95-9. doi: 10.7861/clinmedicine.14-6-s95. Clin Med (Lond). 2014. PMID: 25468929 Review.
Cited by
-
In vivo pentamodal tomographic imaging for small animals.Biomed Opt Express. 2017 Feb 6;8(3):1356-1371. doi: 10.1364/BOE.8.001356. eCollection 2017 Mar 1. Biomed Opt Express. 2017. PMID: 28663833 Free PMC article.
-
Emergence of Radiomics: Novel Methodology Identifying Imaging Biomarkers of Disease in Diagnosis, Response, and Progression.SM J Clin Med Imaging. 2018;4(1):1019. Epub 2018 Mar 15. SM J Clin Med Imaging. 2018. PMID: 34109326 Free PMC article.
References
-
- Theodore W, Katz D, Kufta C, Sato S, Patronas N, Smothers P, et al. Pathology of temporal lobe foci Correlation with CT, MRI, and PET. Neurology. 1990;40:797–797. - PubMed
-
- Hanbidge AE. Cancer of the pancreas: the best image for early detection--CT, MRI, PET or US? Canadian journal of gastroenterology= Journal canadien de gastroenterologie. 2002;16:101–105. - PubMed
-
- Stefan H, Pawlik G, Böcher-Schwarz H, Biersack H, Burr W, Penin H, et al. Functional and morphological abnormalities in temporal lobe epilepsy: a comparison of interictal and ictal EEG, CT, MRI, SPECT and PET. Journal of neurology. 1987;234:377–384. - PubMed
-
- Karger CP, Hipp P, Henze M, Echner G, Höss A, Schad L, et al. Stereotactic imaging for radiotherapy: accuracy of CT, MRI, PET and SPECT. Physics in medicine and biology. 2003;48:211. - PubMed
Publication types
MeSH terms
Grants and funding
LinkOut - more resources
Full Text Sources
Other Literature Sources
Medical
