. 2016 Jan;28(1):102-29.
doi: 10.1105/tpc.15.00496. Epub 2015 Dec 15.

Pipecolic Acid Orchestrates Plant Systemic Acquired Resistance and Defense Priming via Salicylic Acid-Dependent and -Independent Pathways

Affiliations

Pipecolic Acid Orchestrates Plant Systemic Acquired Resistance and Defense Priming via Salicylic Acid-Dependent and -Independent Pathways

Friederike Bernsdorff et al. Plant Cell. 2016 Jan.

Abstract

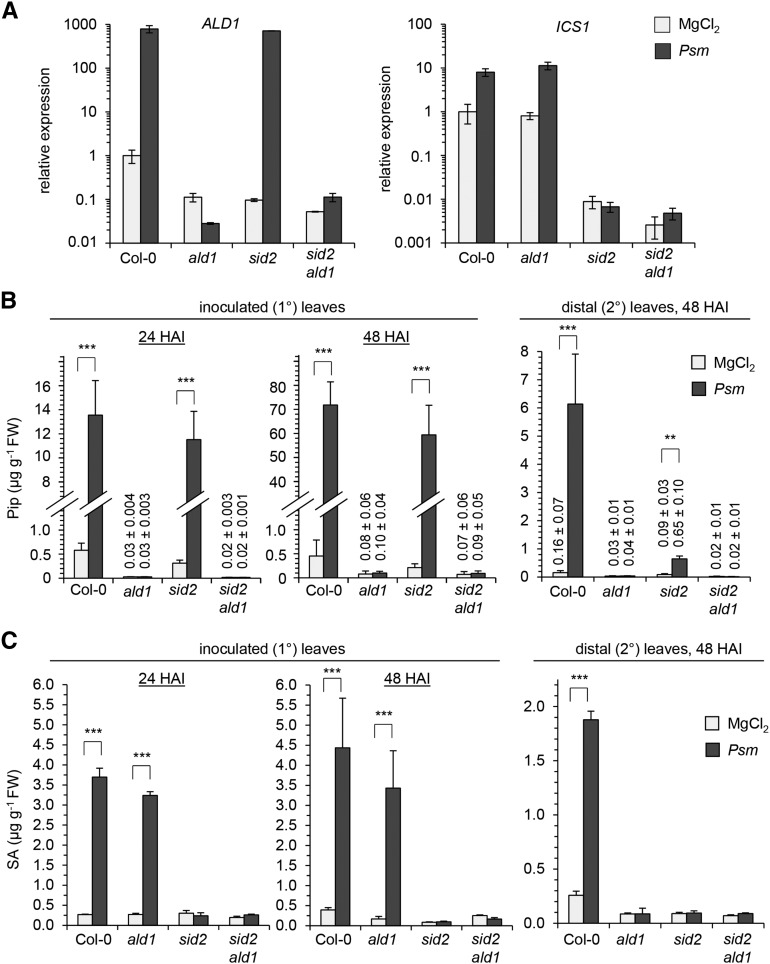
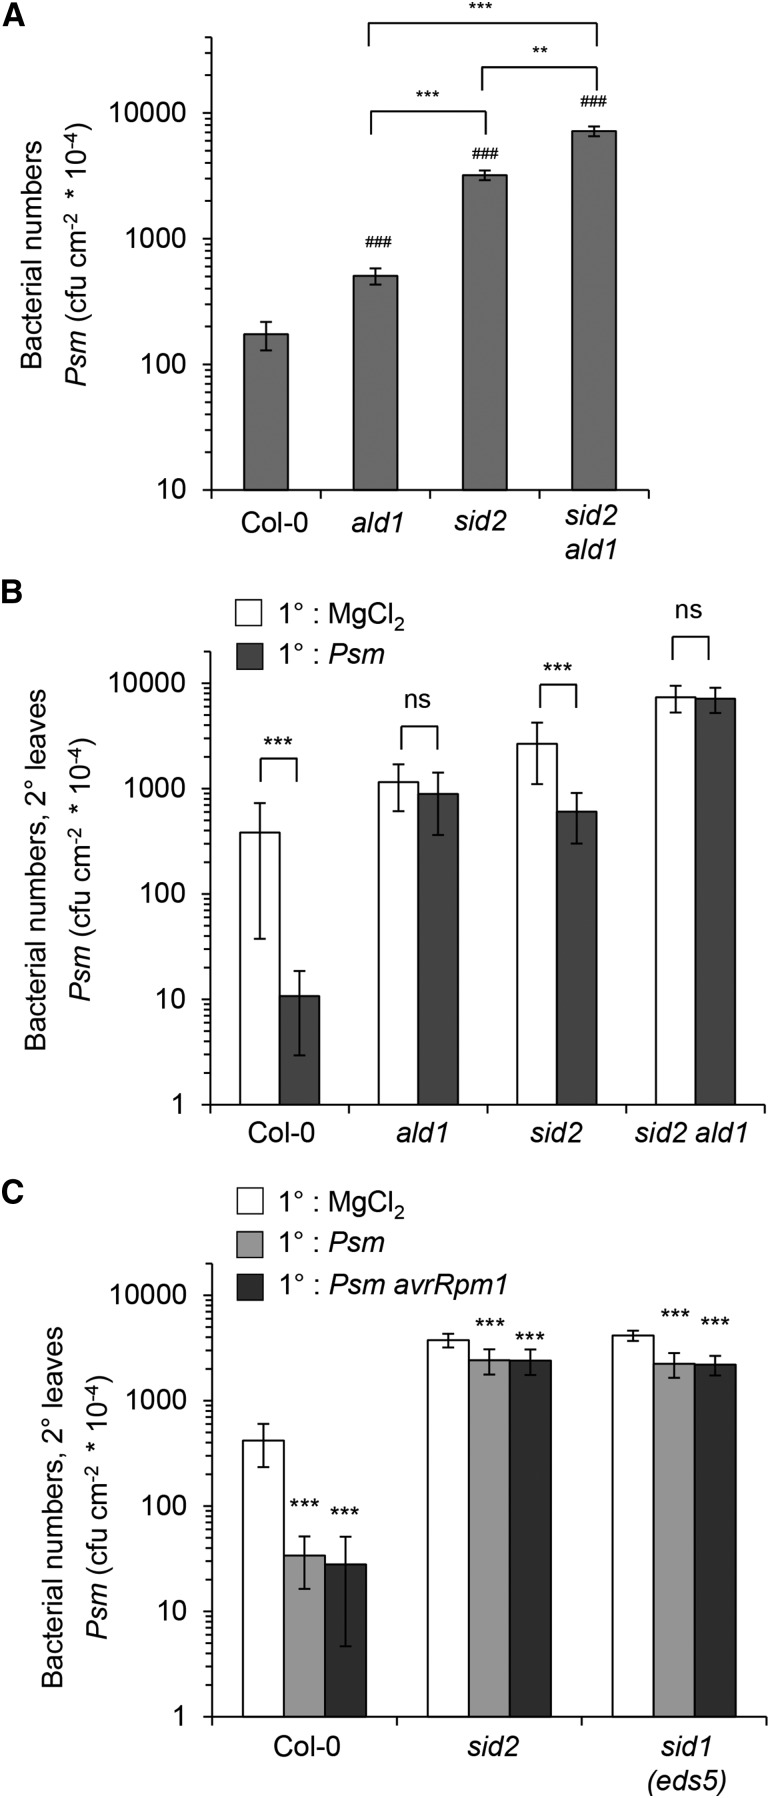
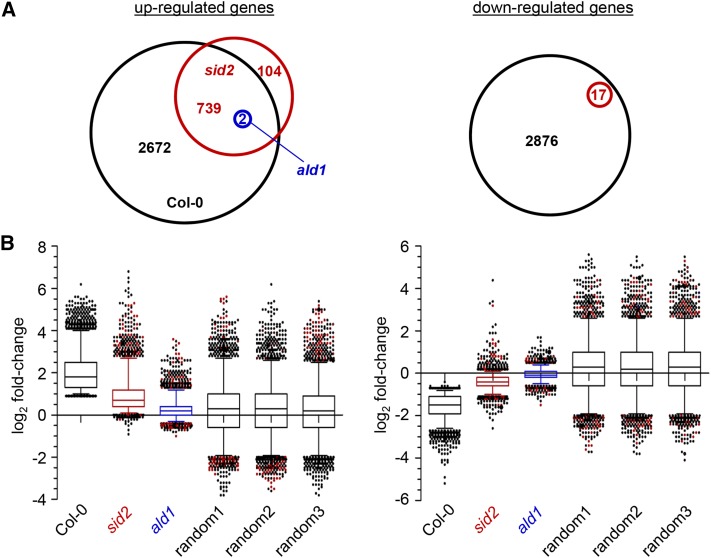
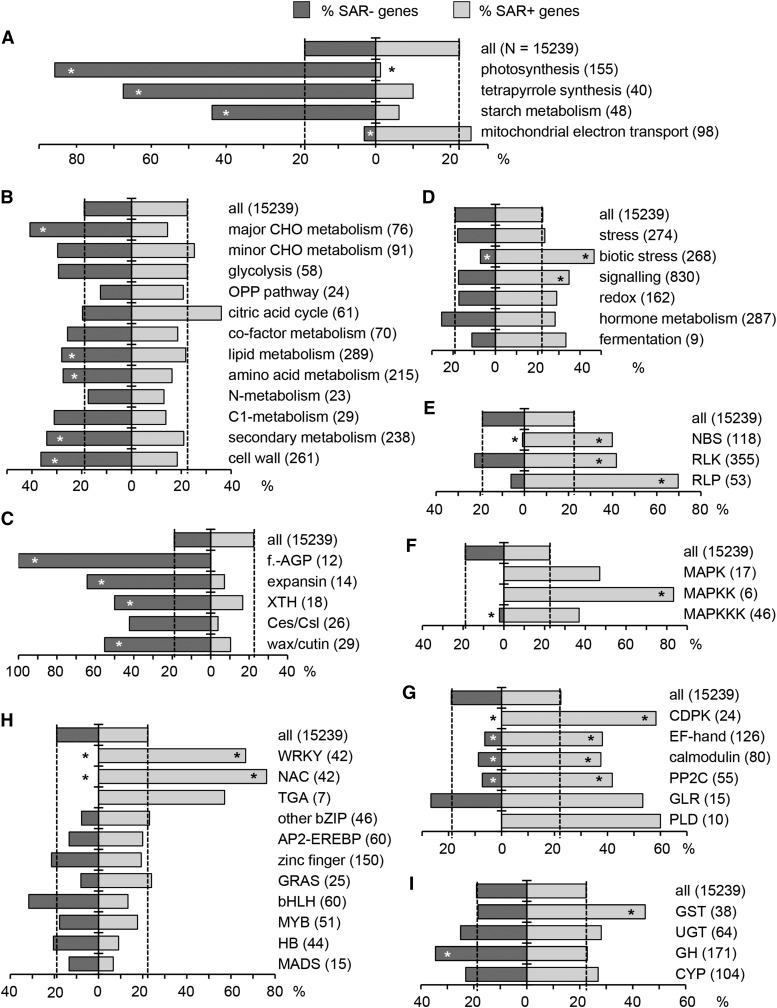
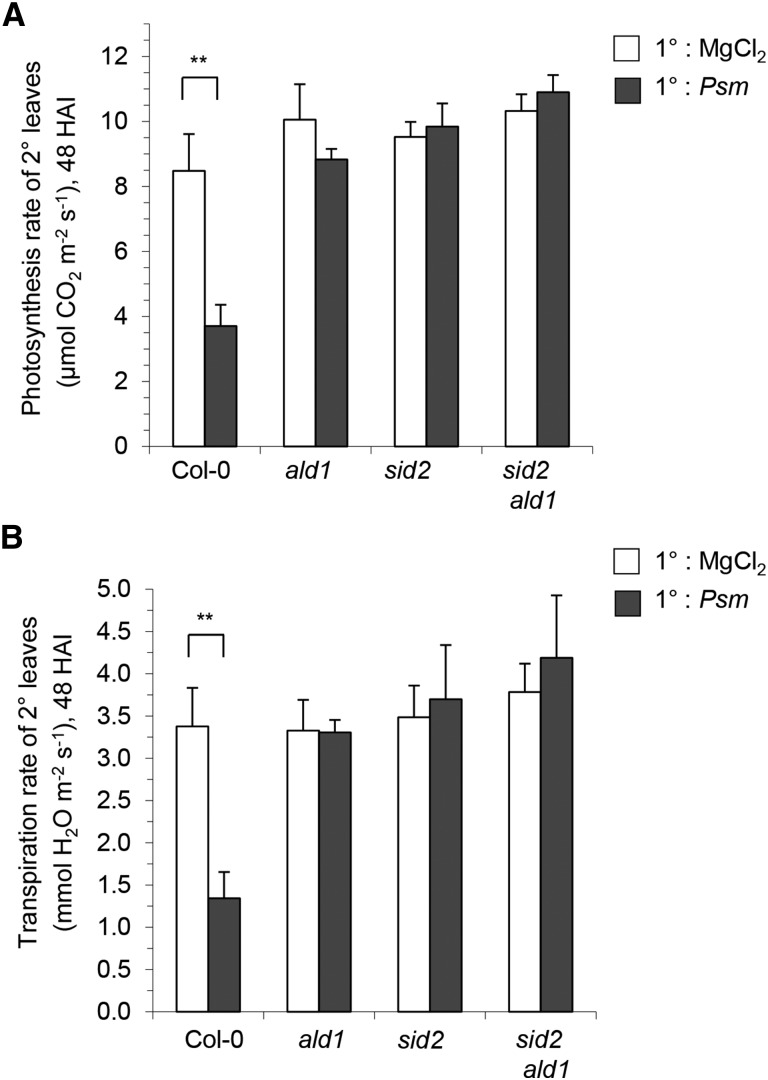
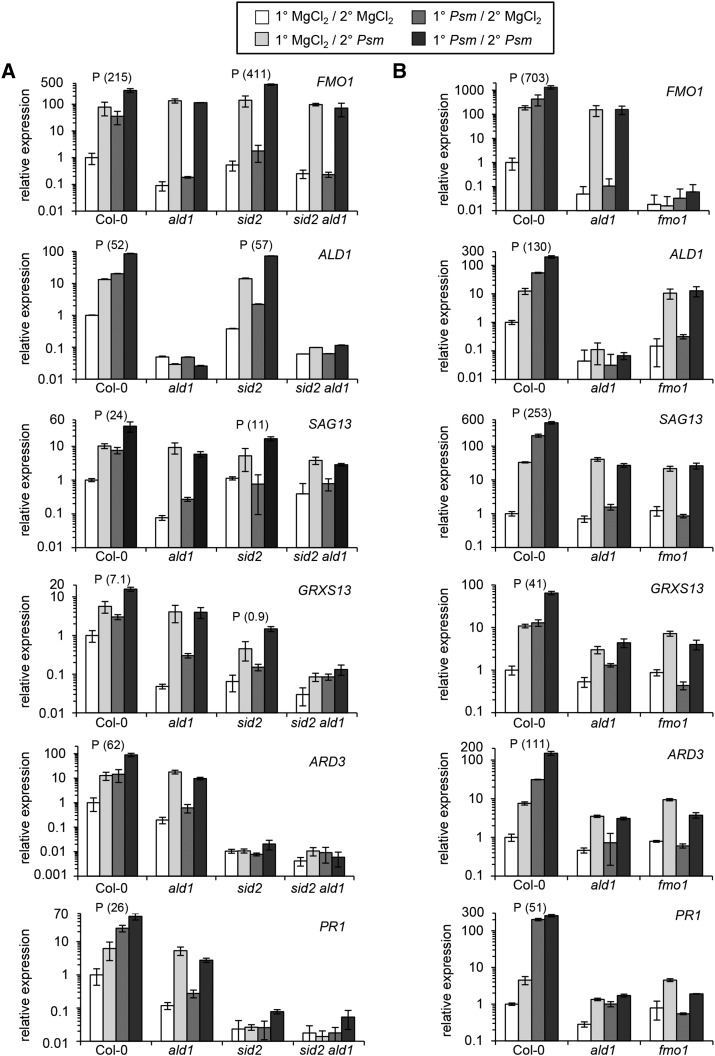
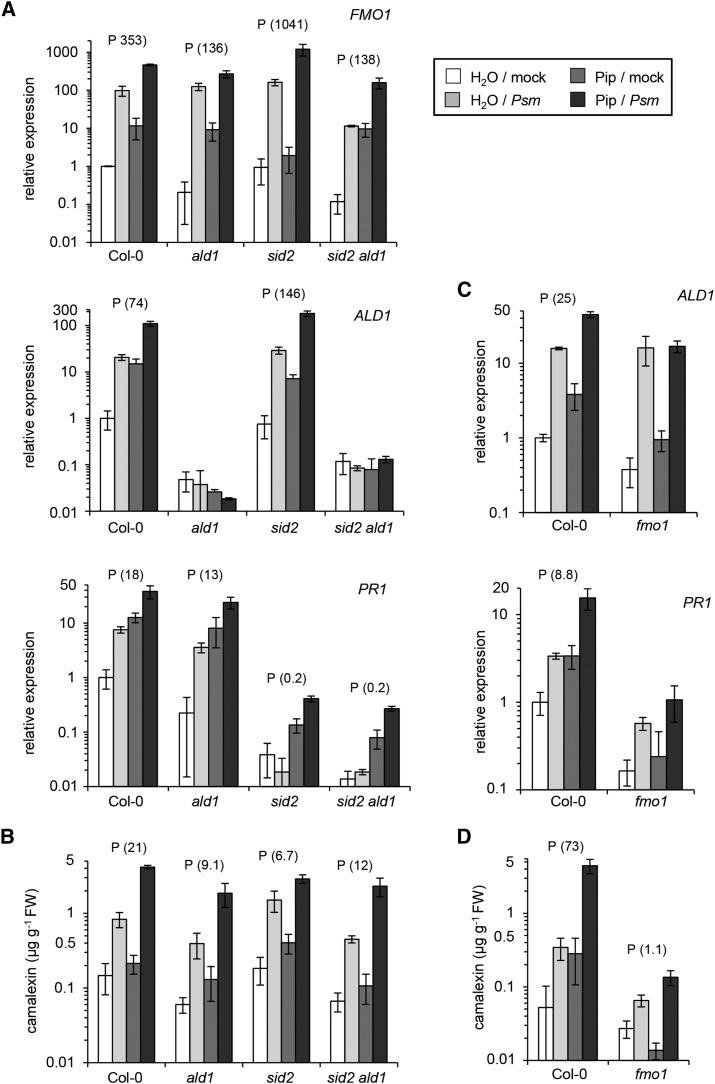
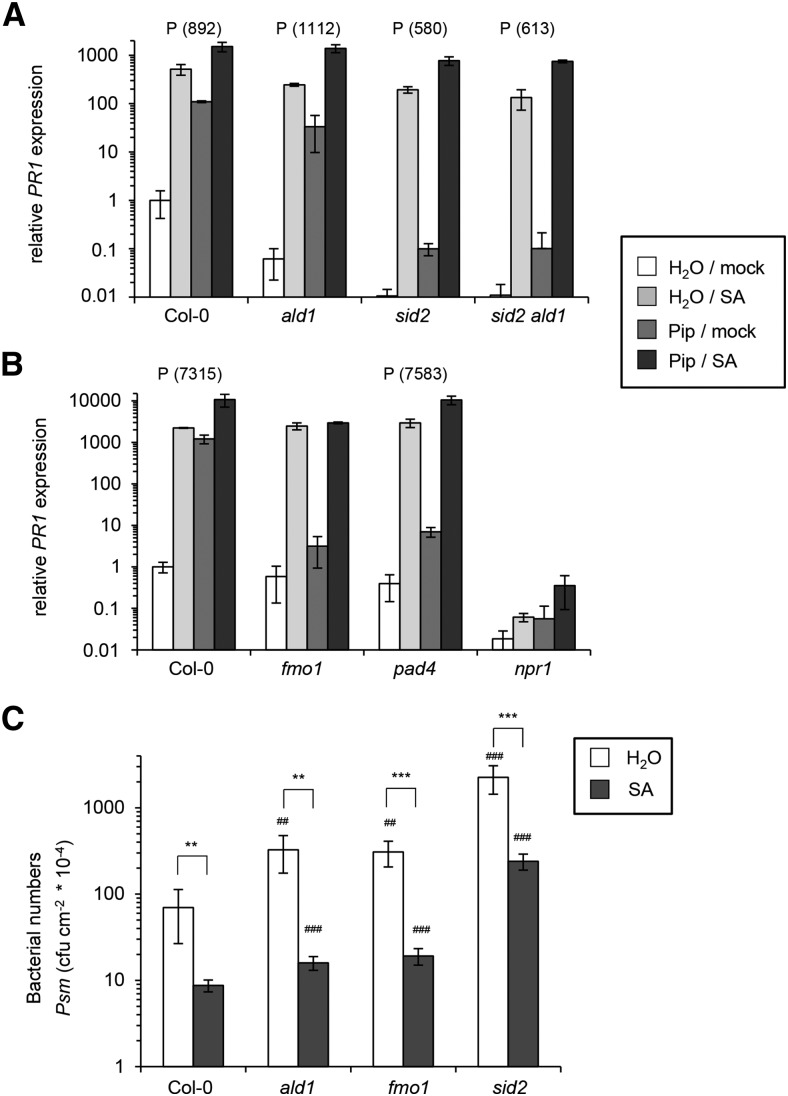
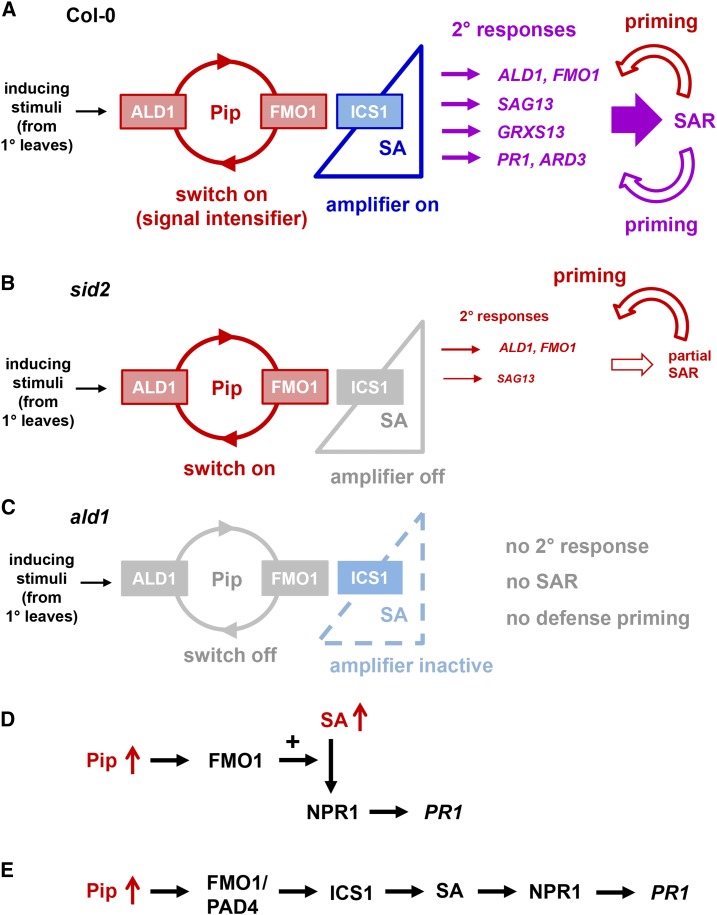
We investigated the relationships of the two immune-regulatory plant metabolites, salicylic acid (SA) and pipecolic acid (Pip), in the establishment of plant systemic acquired resistance (SAR), SAR-associated defense priming, and basal immunity. Using SA-deficient sid2, Pip-deficient ald1, and sid2 ald1 plants deficient in both SA and Pip, we show that SA and Pip act both independently from each other and synergistically in Arabidopsis thaliana basal immunity to Pseudomonas syringae. Transcriptome analyses reveal that SAR establishment in Arabidopsis is characterized by a strong transcriptional response systemically induced in the foliage that prepares plants for future pathogen attack by preactivating multiple stages of defense signaling and that SA accumulation upon SAR activation leads to the downregulation of photosynthesis and attenuated jasmonate responses systemically within the plant. Whereas systemic Pip elevations are indispensable for SAR and necessary for virtually the whole transcriptional SAR response, a moderate but significant SA-independent component of SAR activation and SAR gene expression is revealed. During SAR, Pip orchestrates SA-dependent and SA-independent priming of pathogen responses in a FLAVIN-DEPENDENT-MONOOXYGENASE1 (FMO1)-dependent manner. We conclude that a Pip/FMO1 signaling module acts as an indispensable switch for the activation of SAR and associated defense priming events and that SA amplifies Pip-triggered responses to different degrees in the distal tissue of SAR-activated plants.


Figures

Figure 1.
Figure 1.
Pip and SA Biosynthesis in Local and Systemic Tissue of Wild-Type Col-0, ald1, sid2, and sid2 ald1 Plants Inoculated with SAR-Inducing Psm. (A) Expression of ALD1 (left) and ICS1 (right) in Psm-inoculated leaves at 24 h after inoculation (HAI). Infiltration with 10 mM MgCl2 served as a mock control treatment. Transcript levels were assessed by qPCR analysis and expressed relative to the Col-0 mock control value. Data represent the mean ± sd of three biological replicate leaf samples from different plants. Each biological replicate consists of two leaves from one plant. Expression values for each biological replicate represent the mean of two technical replicates. (B) and (C) Accumulation of Pip (B) and free SA (C) in Psm-inoculated (1°) leaves at 24 and 48 HAI (left) and in distal, noninoculated (2°) leaves (right) at 48 HAI. Data represent the mean ± sd of at least three biological replicate leaf samples from different plants. Each biological replicate consists of six leaves from two plants. Asterisks denote statistically significant differences between Psm and MgCl2 samples (***P < 0.001 and **P < 0.01; two-tailed t test). Numerical values for samples with very low metabolite contents are given above the respective bars.
Figure 2.
Figure 2.
Analyses of Basal Resistance to Psm and SAR in Pip- and/or SA-Deficient Mutant Plants. (A) Basal resistance of Col-0, ald1, sid2, and sid2 ald1 plants to Psm. Three leaves per plant were inoculated with a suspension of Psm (OD600 = 0.001) and bacterial numbers quantified 3 d later. Bars represent mean values (±sd) of colony-forming units (cfu) per square centimeter from at least seven biological replicate samples (n) derived from different plants. Each biological replicate consists of three leaf discs harvested from different leaves of one plant. Number signs denote statistically significant differences from the Col-0 wild-type value (#P < 0.05, ##P < 0.01, and ###P < 0.001; two-tailed t test). Asterisks designate statistically significant differences between indicated samples. To test whether the effects of ald1 and sid2 on bacterial proliferation are additive or synergistic, a linear model was used (log10 bacterial count ∼ ald1*sid2). No significant interaction of ald1*sid2 was detected both according to the F-test and according to Akaikes information criterion (P = 0.0508, AICsynergistic = −120 AICadditive = −122.7); hence, the effect is additive. (B) SAR assay with Col-0, ald1, sid2, and sid2 ald1 plants. Lower (1°) leaves were infiltrated with either 10 mM MgCl2 or Psm (OD600 = 0.005) to induce SAR, and 2 d later, three upper leaves (2°) were challenge-infected with Psm (OD600 = 0.001). Bacterial growth in upper leaves was assessed 3 d after 2° leaf inoculation (n ≥ 7; as described in [A]). Asterisks denote statistically significant differences between Psm pretreated and mock control samples (***P < 0.001; ns, not significant, two-tailed t test). (C) Biological SAR induction upon 1° leaf inoculation with compatible Psm and incompatible Psm avrRpm1 in Col-0, sid2, and sid1 plants (n ≥ 7; as described in [A] and [B]). Asterisks denote statistically significant differences between Psm or Psm avrRpm1 (OD600 = 0.005) pretreated and mock control samples (***P < 0.001; two-tailed t test).
Figure 3.
Figure 3.
Transcriptional SAR Response in Distal Leaves of Plants Inoculated in Primary Leaves with Psm (OD600 = 0.005) at 48 HAI. Six independent SAR assays for Col-0 and three independent SAR experiments for both sid2 and ald1 were performed. Gene expression was analyzed by RNA-seq analyses of the resulting replicate samples for Psm and mock treatments at the whole-genome level. (A) Venn diagram depicting numbers of differentially regulated genes between Psm and mock treatments of Col-0 (black), sid2 (red), and ald1 (blue) (FDR < 0.01). Overlap of genes is indicated. Left: significantly upregulated genes (the Col-0 genes correspond to the SAR+ genes). Right: significantly downregulated genes (the Col-0 genes correspond to the SAR genes). Note that only two genes are differentially regulated in ald1. (B) Distribution of P/M-fold changes of SAR genes in Col-0, sid2, and ald1. Box plots depict log2-transformed P/M-fold changes. The distribution of log2 P/M-fold changes for three sets of randomly selected genes (left, 3413 genes; right, 2893 genes) is included (random a, b, and c). Left, SAR+ genes; right, SAR genes.
Figure 4.
Figure 4.
Percentage of SAR+ and SAR Genes in Defined Gene Groups Representing MapMan Metabolic Pathways, Functional Categories, or Arabidopsis Gene Families (http://www.arabidopsis.org). Dashed vertical lines illustrate the percentage of SAR+ and SAR genes in the whole, RNA-seq-covered transcriptome (28,496 genes) after threshold cutoff (15,239 genes). The number of genes in each category is given in parentheses. Asterisks on the bars indicate significant enrichment or depletion of gene categories in SAR+ (right) and SAR (left) genes (Fisher’s exact test, P < 0.01). (A), (B), and (D) MapMan metabolic pathways and functional categories. (C) Gene families involved in cell wall remodeling and wax/cutin biosynthesis. f.-AGP, fasciclin-like arabinogalactan proteins; XTH, xyloglucan endotrans-glucosylase/hydrolases; Ces/Csl, cellulose synthase/cellulose synthase-like. (E) Gene families involved in the perception of microbial structures and early defense signal transduction. NBS, nucleotide binding site-containing resistance proteins; RLP, receptor-like proteins. (F) MAPK cascade members. MAPKK, MAPK kinase; MAPKKK, MAPK kinase kinase. (G) Other gene categories involved in defense signaling. CDPK, calcium-dependent protein kinases; EF-hand, EF-hand-containing proteins; calmodulin, calmodulin binding proteins; GLR, glutamate receptor-like family; PLD, phospholipase D family. (H) Main transcription factor families. WRKY, WRKY domain family; NAC, NAM-ATAF1,2-CUC2 transcription factors; TGA, TGACG motif binding factor; bZIP, basic leucine zipper; AP2-EREBP, APETALA2 and ethylene-responsive element binding proteins; zinc finger, zinc finger superfamily; GRAS, GRAS family; bHLH, basic helix-loop-helix; MYB, MYB family; HB, homeobox-leucine zipper; MADS, MADS box. (I) Genes for different enzyme classes. GST, glutathione S-transferases; UGT, UDP-dependent glycosyltransferases; GH, glycosyl hydrolases; CYP, cytochrome P450 superfamily.
Figure 5.
Figure 5.
Photosynthesis and Transpiration Rates in 2° Leaves of 1° Leaf-Inoculated Col-0, ald1, sid2, and sid2 ald1 Plants. (A) CO2 uptake rates as a measure of photosynthetic capacity at 48 h after Psm inoculation or MgCl2 infiltration measured in distal, untreated leaves of Col-0, sid2, ald1, and sid2 ald1 plants, as determined by IRGA. Data represent the mean ± sd of four biological replicates (CO2 uptake rate of four distal leaves from different plants). (B) Rates of transpiration (water loss) in distal leaves, determined as described above by IRGA. Asterisks denote statistically significant differences between Psm-treated and mock control plants (**P < 0.01; two-tailed t test).
Figure 6.
Figure 6.
SAR-Associated Priming of Defense-Related Gene Expression Fully Depends on a Functional Pip/FMO1 Module but Is Only Partially SA Dependent. (A) SAR priming assays for Col-0, ald1, sid2, and sid2 ald1 plants. (B) SAR priming assays for Col-0, ald1, and fmo1 plants (independent experiment). The priming assay consisted of an inductive Psm inoculation or mock (MgCl2) treatment of 1° leaves, followed by a Psm challenge or mock treatment of 2° leaves 48 h later. Gene expression in 2° leaves was assessed 10 h after the second treatment (Supplemental Figure 9A). A particular defense response was defined as primed if the differences between the (1°-Psm/2°-Psm) and the (1°-Psm/2°-MgCl2) values were significantly larger than the differences between the (1°-MgCl2/2°-Psm) and the (1°-MgCl2/2°-MgCl2) values (two-sided Mann-Whitney U test, α = 0.005) (Supplemental Figure 9B). A P above the bars for a particular genotype indicates priming. Expression of three partially SA-independent SAR+ genes (FMO1, ALD1, and SAG13; Table 1) and three SA-dependent SAR+ genes (GRXS13, ARD3, and PR1) were monitored. Transcript levels were assessed by quantitative real-time PCR analysis and are given as means ± sd of three biological replicates. Each biological replicate involves two technical replicates. The transcript levels are expressed relative to the respective Col-0 mock control value. Note that the graphs use a base 10 logarithmic scale for the y axes to ensure recognizability of both high and low values. Graphs with a linear scale for the y axes, which more clearly illustrate differences between challenge-infected 1° mock-treated and 1° Psm-induced plants, are depicted in Supplemental Figure 10. As a measure of the gain of a response due to priming, we calculated the prgain (response gain due to priming) for each genotype with activated priming according to the formula given in Supplemental Figure 9C. prgain values are given in parentheses behind the priming indicator P and allow estimates about quantitative differences of the strength of priming between genotypes. The higher the prgain value, the stronger the priming. The data sets depicted in (A) and (B) are derived from independent experiments.
Figure 7.
Figure 7.
SAR-Associated Priming of Camalexin and SA Biosyntheses Requires a Functional Pip/FMO1 Module, and SAR Priming of Camalexin Production Is SA Dependent. (A) SAR priming assays for Col-0, ald1, sid2, and sid2 ald1 plants. Camalexin levels and total SA levels were determined as defense outputs. Values represent the mean ± sd of three biological replicates from different plants. Each biological replicate consists of six leaves from two plants. A P above the bars for a particular genotype indicates priming in this genotype. The prgain values are given in parentheses. Details of the priming assessments are described in the legends of Figure 6 and Supplemental Figure 9. (B) SAR priming assays for camalexin and total SA production in Col-0, ald1, and fmo1 plants, as described in (A). Note that the graphs use a logarithmic scale for the y axes. The same graphs with linear scaling are depicted in Supplemental Figure 11. The data sets depicted in (A) and (B) originate from independent experiments.
Figure 8.
Figure 8.
Exogenous Pip Confers Defense Priming in a FMO1-Dependent and Partially SA-Independent Manner. (A) Pip-induced priming of gene expression (FMO1, ALD1, and PR1) in Col-0, ald1, sid2, and sid2 ald1 plants, as determined by qPCR analysis. Plants were supplied with 10 mL of 1 mM Pip (≡ dose of 10 µmol) or with 10 mL of water (control treatment) via the root system and leaves challenge-inoculated with Psm or mock-infiltrated 1 d later. Defense responses in leaves were determined 10 h after the challenge treatment. Values represent the mean ± sd of three biological replicates from different plants. Each biological replicate consists of two leaves from one plant and involves two technical replicates. A P above the bars for a particular genotype indicates defense priming in this genotype, as assessed in analogy to SAR priming. The prgain values are given in parentheses (see legend to Figure 6 and Supplemental Figure 9). (B) Pip-induced priming for camalexin production in Col-0, ald1, sid2, and sid2 ald1 plants. Values represent the mean ± sd of three biological replicates from different plants. Each biological replicate consists of six leaves from two plants. (C) Pip-induced priming assays in Col-0 and fmo1 plants, monitoring ALD1 and PR1 expression. Sampling as outlined in (A). The data sets depicted in (A) and (C) originate from independent experiments. (D) Pip-induced priming assays in Col-0 and fmo1 plants, monitoring camalexin accumulation. Sampling is outlined in (B). The data sets depicted in (B) and (D) originate from independent experiments. Note that the graphs use a logarithmic scale for the y axes. The same graphs with linear scaling are depicted in Supplemental Figure 12.
Figure 9.
Figure 9.
Pip Amplifies SA-Induced PR1 Expression in a FMO1-Dependent Manner and Exogenous SA Enhances Basal Resistance in ald1, fmo1, and sid2. (A) and (B) Plants were pretreated with Pip (or water) as described in the legend to Figure 8, and 1 d later 0.5 mM SA (SA) or water (mock) was infiltrated into leaves. PR1 expression in leaves was monitored 4 h after the SA (mock) treatment by qPCR analysis. Values represent the mean ± sd of three biological replicates from different plants. Each biological replicate consists of two leaves from one plant and involves two technical replicates. PR1 transcript levels are expressed relative to the water/mock value of Col-0. The data sets depicted in (A) and (B) originate from independent experiments. A P above the bars for a particular genotype indicates priming of SA responses in this genotype, as assessed in analogy to SAR priming. The prgain values are given in parentheses (see legend to Figure 6 and Supplemental Figure 9). Note that the graphs use a logarithmic scale for the y axes. The same graphs with linear scaling are depicted in Supplemental Figure 14. (A) Col-0, ald1, sid2, and sid2ald1. (B) Col-0, fmo1, pad4, and npr1. (C) Basal resistance to Psm infection of Col-0, ald1, fmo1, and sid2 plants is enhanced by exogenous SA. Three leaves per plant were preinfiltrated with 0.5 mM SA or water, and 4 h later, the same leaves were challenged with Psm (OD600 = 0.001). Bacterial growth was assayed 3 d later as outlined in the legend to Figure 2A. Asterisks denote statistically significant differences between SA- and water-pretreated plants (**P < 0.01 and ***P < 0.001; two-tailed t test). Number signs above bars of mutant values denote statistically significant differences from the respective Col-0 wild-type value (##P < 0.01 and ###P < 0.001; two-tailed t test).
Figure 10.
Figure 10.
Summary of the Roles of Pip, FMO1, and SA in Arabidopsis SAR and Associated Defense Priming, and Modes of the Synergistic Interplay between Pip and SA. (A) to (C) Regulation of the SAR transcriptional response, SAR establishment, and SAR-associated defense priming by Pip, FMO1, and SA. (A) The situation in wild-type plants. The full SAR and priming responses are established by elevated levels of ALD1-generated Pip, the action of FMO1 downstream of Pip, and ICS1-synthesized SA in 2° leaf tissue. The Pip/FMO1 module acts as an indispensable switch for SAR activation, and SA amplifies Pip-dependent responses to different degrees. (B) The situation in sid2 mutant plants. In the absence of functional ICS1 and elevated SA, the Pip/FMO1 module is sufficient to induce a set of partially SA-independent responses to a certain level and trigger a moderate SAR response. Notably, an intact Pip/FMO1 module is also capable to prime plants for enhanced activation of partially SA-independent responses in the absence of SA elevations (bent red arrow). (C) The situation in ald1 and fmo1 mutant plants. Functional ICS1 alone is not sufficient for SAR activation. Without Pip elevations or functional FMO1, SA biosynthesis is not activated. Failure of both Pip and SA elevations prevents the establishment of a primed state. Without the Pip/FMO1 module, inducing stimuli from 1° leaves are either not transduced into a meaningful response in 2° leaves or too weak to induce a noticeable response. (D) and (E) Two modes of synergistic interplay between the immune signals Pip and SA. (D) Elevated Pip levels amplify SA-induced PR1 expression. This amplification response is mediated by FMO1 but does not depend on PAD4. (E) Elevated Pip levels induce PR1 expression via ICS1-triggered SA production. This signaling mode of Pip depends on both FMO1 and PAD4.

Similar articles

Cited by

References

    1. Acharya B.R., Raina S., Maqbool S.B., Jagadeeswaran G., Mosher S.L., Appel H.M., Schultz J.C., Klessig D.F., Raina R. (2007). Overexpression of CRK13, an Arabidopsis cysteine-rich receptor-like kinase, results in enhanced resistance to Pseudomonas syringae. Plant J. 50: 488–499. - PubMed
    1. Aliferis K.A., Faubert D., Jabaji S. (2014). A metabolic profiling strategy for the dissection of plant defense against fungal pathogens. PLoS One 9: e111930. - PMC - PubMed
    1. Alonso J.M., et al. (2003). Genome-wide insertional mutagenesis of Arabidopsis thaliana. Science 301: 653–657. - PubMed
    1. Attaran E., Zeier T.E., Griebel T., Zeier J. (2009). Methyl salicylate production and jasmonate signaling are not essential for systemic acquired resistance in Arabidopsis. Plant Cell 21: 954–971. - PMC - PubMed
    1. Bartsch M., Gobbato E., Bednarek P., Debey S., Schultze J.L., Bautor J., Parker J.E. (2006). Salicylic acid-independent ENHANCED DISEASE SUSCEPTIBILITY1 signaling in Arabidopsis immunity and cell death is regulated by the monooxygenase FMO1 and the Nudix hydrolase NUDT7. Plant Cell 18: 1038–1051. - PMC - PubMed

Publication types

MeSH terms