. 2015 Dec;27(12):3425-38.
doi: 10.1105/tpc.15.00371. Epub 2015 Dec 15.

Systemic Immunity Requires SnRK2.8-Mediated Nuclear Import of NPR1 in Arabidopsis

Affiliations

Systemic Immunity Requires SnRK2.8-Mediated Nuclear Import of NPR1 in Arabidopsis

Hyo-Jun Lee et al. Plant Cell. 2015 Dec.

Abstract

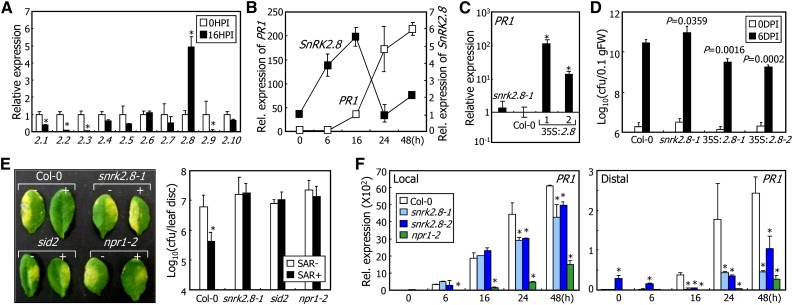
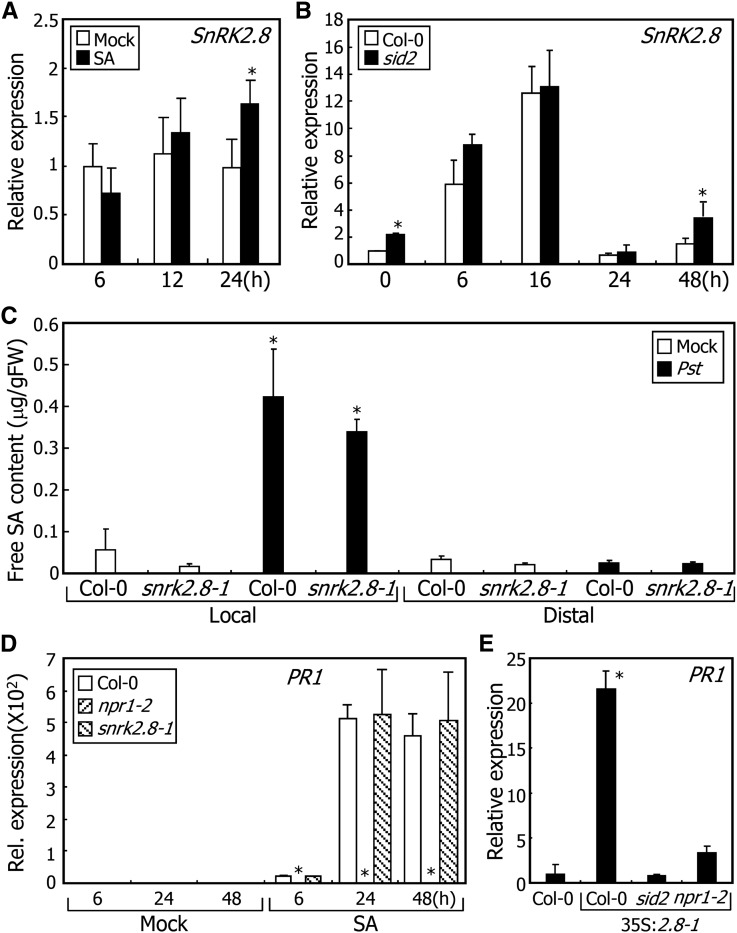
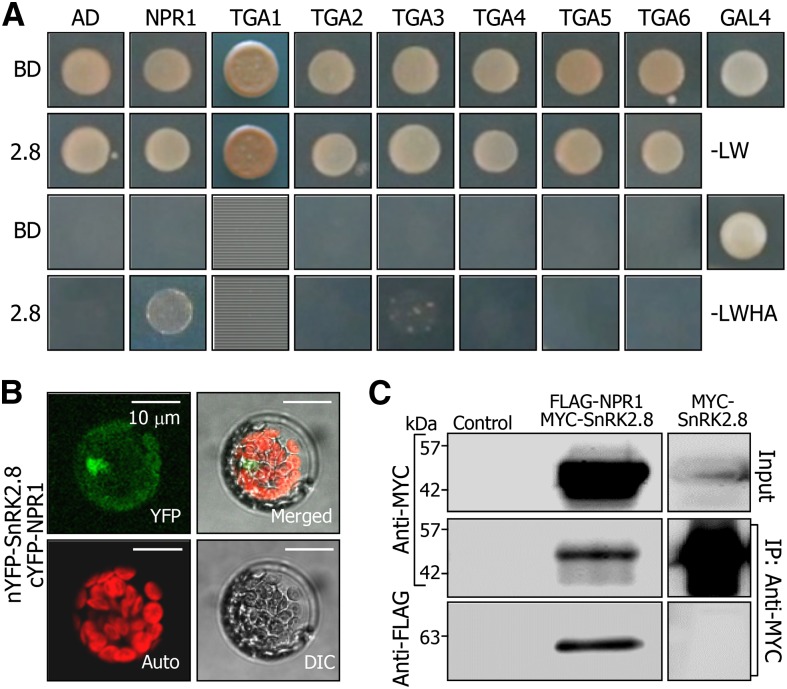
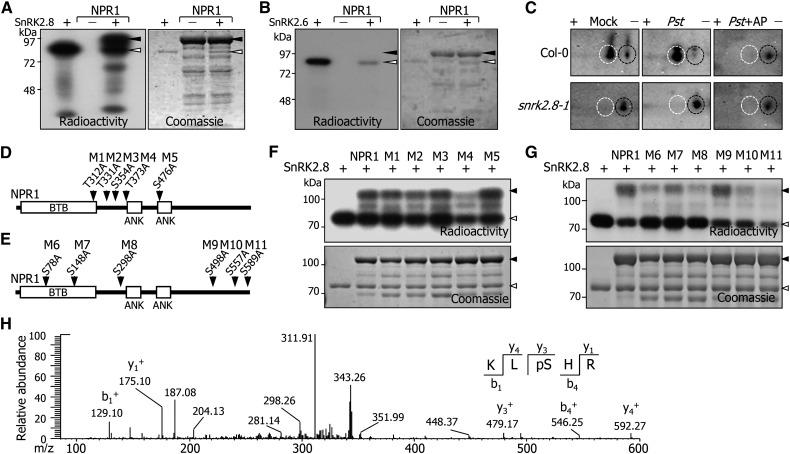
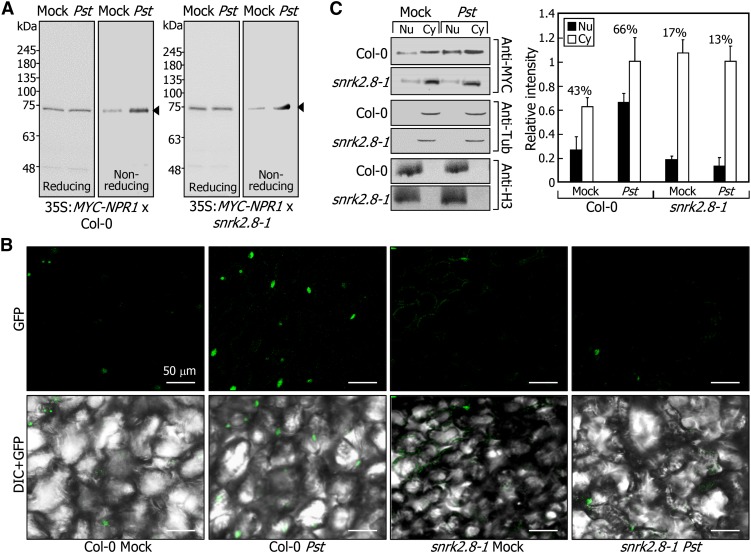
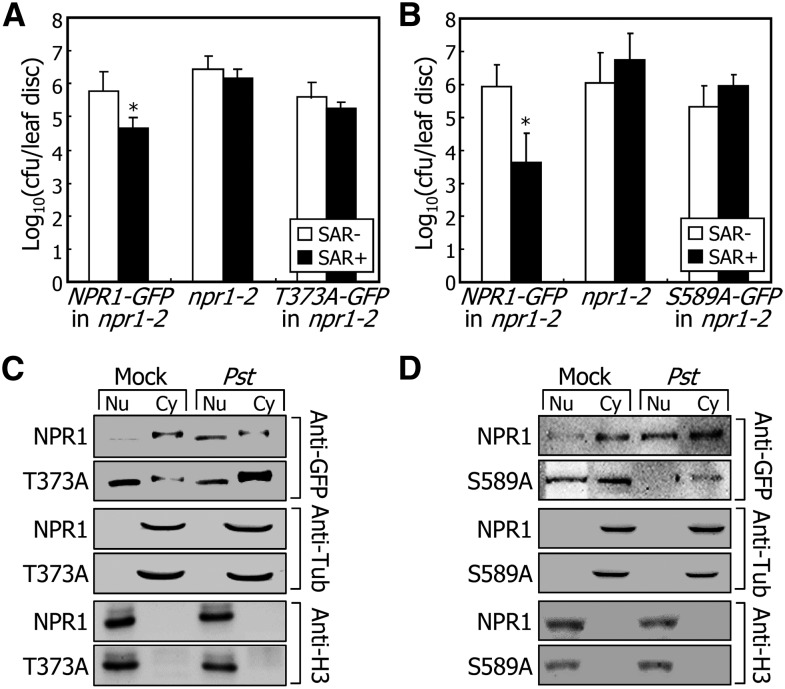
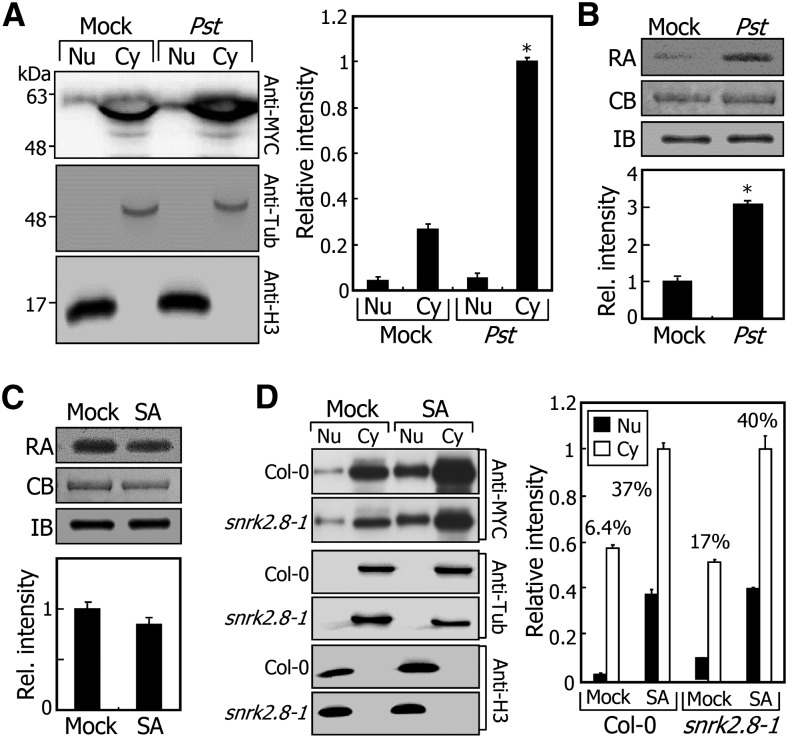
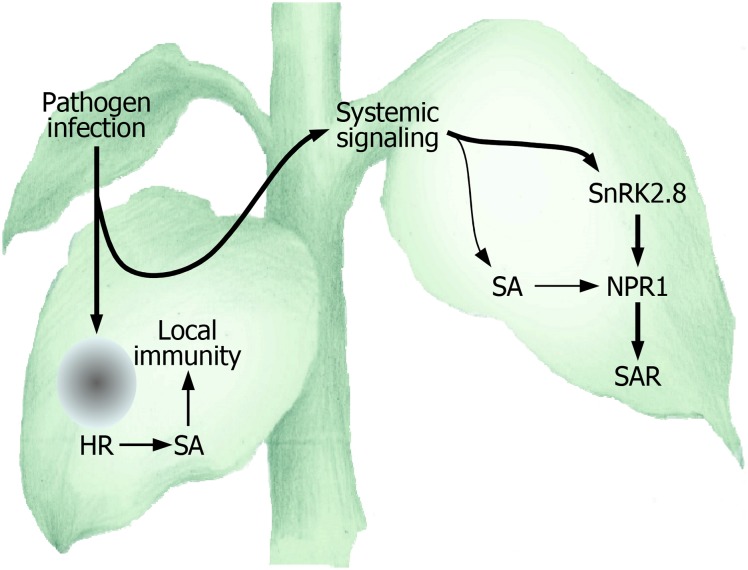
In plants, necrotic lesions occur at the site of pathogen infection through the hypersensitive response, which is followed by induction of systemic acquired resistance (SAR) in distal tissues. Salicylic acid (SA) induces SAR by activating NONEXPRESSER OF PATHOGENESIS-RELATED GENES1 (NPR1) through an oligomer-to-monomer reaction. However, SA biosynthesis is elevated only slightly in distal tissues during SAR, implying that SA-mediated induction of SAR requires additional factors. Here, we demonstrated that SA-independent systemic signals induce a gene encoding SNF1-RELATED PROTEIN KINASE 2.8 (SnRK2.8), which phosphorylates NPR1 during SAR. The SnRK2.8-mediated phosphorylation of NPR1 is necessary for its nuclear import. Notably, although SnRK2.8 transcription and SnRK2.8 activation are independent of SA signaling, the SnRK2.8-mediated induction of SAR requires SA. Together with the SA-mediated monomerization of NPR1, these observations indicate that SA signals and SnRK2.8-mediated phosphorylation coordinately function to activate NPR1 via a dual-step process in developing systemic immunity in Arabidopsis thaliana.


Figures

Figure 1.
Figure 1.
SnRK2.8 Mediates SAR. Four-week-old plants grown in soil were used for pathogen infection and gene expression analysis. Transcript levels were examined by RT-qPCR. Biological triplicates were averaged and statistically treated using Student’s t test (*P < 0.01). Bars indicate sd of the mean. (A) Effects of pathogen infection on SnRK transcription. Col-0 plants were infected with Pst DC3000/avrRpt2 cells. Total RNA was extracted from distal leaves. A group of SnRK2 genes is represented on the x axis. HPI, hours postinfection. (B) Transcription kinetics of SnRK2.8 and PR1 genes in distal leaves. The 4th and 5th leaves were pressure-infiltrated with Pst DC3000/avrRpt2 cells, and two upper leaves were harvested at each time point after infection. (C) PR1 transcription in snrk2.8-1 mutant and 35S:2.8 transgenic plants. The 4th and 5th leaves of uninfected plants were used for total RNA extraction. (D) Bacterial cell growth in snrk2.8-1 mutant and 35S:2.8 transgenic plants. Plants were spray-inoculated with Pst DC3000 cells and incubated for 6 d before counting bacterial cells. Three measurements were averaged and statistically treated using Student's t test. P values were annotated. Bars indicate sd of the mean. cfu, colony-forming units; DPI, days postinfection. (E) SAR induction in snrk2.8-1 mutant. Halves of the 4th and 5th leaves were pressure-infiltrated with 10 mM MgCl2 (−) or Pst DC3000/avrRpt2 cells (+) and incubated for 2 d. Two upper leaves were infiltrated with Pst DC3000 cells and incubated for 3 d before taking photographs (left panel) and counting bacterial cells (right panel). (F) PR1 transcription in the local and distal leaves of snrk2.8 mutants. Pathogen infection was conducted as described in (A). Infected leaves (local) and two upper leaves (distal) were used for gene expression analysis.
Figure 2.
Figure 2.
SnRK2.8-Mediated Induction of SAR Requires SA. In (A) and (D), 2-week-old plants grown on MS-agar plates were used for gene expression analysis. Transcript levels were examined by RT-qPCR. Biological triplicates were averaged and statistically treated (t test, *P < 0.01). Bars indicate sd. (A) Effects of SA on SnRK2.8 transcription. Plants were treated with 0.5 mM SA for the indicated periods before harvesting whole-plant materials. (B) Kinetics of SnRK2.8 transcription in distal leaves. The 4th and 5th leaves of 4-week-old plants grown in soil were pressure-infiltrated with Pst DC3000/avrRpt2 cells, and two upper leaves were harvested at the indicated time points for total RNA extraction. (C) SA accumulation after pathogen infection. Col-0 plant and snrk2.8-1 mutant were infected with Pst DC3000/avrRpt2 cells as described in (B). Local and distal leaves were harvested 24 h after infection for SA extraction. Five measurements were averaged and statistically treated (t test, *P < 0.01). (D) SA-mediated induction of PR1 transcription in snrk2.8-1 mutant. Plants were treated with 0.5 mM SA for the indicated periods. (E) Effects of SnRK2.8 overexpression on PR1 transcription in sid2 and npr1-2 backgrounds. The 4th and 5th leaves of 4-week-old plants were harvested for gene expression analysis.
Figure 3.
Figure 3.
SnRK2.8 Interacts with NPR1. (A) Interaction of SnRK2.8 with NPR1 in yeast cells. Yeast cell growth on selective media lacking Leu, Trp, His, and Ade (-LWHA) represents positive interaction. (B) BiFC. Partial YFP constructs were fused to SnRK2.8 or NPR1, and the fusions were coexpressed transiently in Arabidopsis protoplasts. YFP signals were visualized by DIC and fluorescence microscopy. (C) Co-IP. MYC-SnRK2.8 and FLAG-NPR1 fusion constructs were coexpressed transiently in tobacco leaves. The input represents 10% of the protein extract. Control, protein extract without transient expression. IP, immunoprecipitation.
Figure 4.
Figure 4.
SnRK2.8 Phosphorylates NPR1. (A) In vitro phosphorylation assay. Recombinant SnRK2.8 and NPR1 proteins were prepared as MBP fusions in E. coli cells. MBP-SnRK2.8 (0.5 μg) and 5 μg of MBP-NPR1 were used. Black arrowheads indicate MBP-NPR1, and white arrowheads indicate MBP-SnRK2.8. (B) SnRK2.6 does not phosphorylate NPR1. Phosphorylation assays in vitro using recombinant SnRK2.6 and NPR1 proteins were performed as described in (A). Black arrowheads indicate MBP-NPR1, and white arrowheads indicate MBP-SnRK2.6. (C) In vivo phosphorylation assay by two-dimensional electrophoresis. A MYC-NPR1 fusion was overexpressed in Col-0 and snrk2.8-1 plants. The 4th and 5th leaves of 4-week-old plants grown in soil were pressure-infiltrated with Pst DC3000/avrRpt2 cells, and uninfiltrated leaves were harvested 24 h after infiltration. NPR1 proteins were detected by immunoblot assays using an anti-MYC antibody. Black circles indicate NPR1, and white circles indicate phosphorylated NPR1. AP, alkaline phosphatase; (+) and (−) indicate low and high pH, respectively. (D) and (E) Protein structure of NPR1. M1 to M11 indicate the mutations of putative SnRK2.8 target residues. BTB, BTB/POZ core motif; ANK, ankyrin-repeat motif. (F) and (G) In vitro phosphorylation assays on mutated NPR1 proteins. Phosphorylation assays in vitro using recombinant SnRK2.8 and mutated NPR1 proteins were performed as described in (A). Black and white arrowheads indicate NPR1 and SnRK2.8, respectively. (H) LC-MS/MS spectrum of the peptide containing phosphorylated S589. Eight micrograms of recombinant MBP-NPR1 protein was phosphorylated by 4 μg of MBP-SnRK2.8, as described in (A). “b” and “y” indicate peptide fragment ions retaining charges at the N and C terminus, respectively. The subscript numbers indicate their positions in the identified peptide. The superscript “+” indicates singly protonated ions. The phosphorylated Ser is denoted as pS. LC-MS/MS was performed with three independent reactions, and only Ser-589 phosphorylation was detected.
Figure 5.
Figure 5.
SnRK2.8 Promotes the Nuclear Import of NPR1. (A) SnRK2.8 does not affect the monomerization of NPR1. The MYC-NPR1 fusion was overexpressed driven by the CaMV 35S promoter in either Col-0 (left panel) or snrk2.8-1 (right panel). The 4th and 5th leaves of 4-week-old plants were pressure-infiltrated with Pst DC3000/avrRpt2 cells, and two upper leaves were harvested. Protein extracts were resuspended in loading buffer with or without β-mercaptoethanol (reducing or nonreducing, respectively). Arrowheads indicate NPR1 monomers. (B) Nucleo-cytoplasmic distribution of NPR1 in the snrk2.8-1 mutant. The NPR1-GFP gene fusion was overexpressed driven by the CaMV 35S promoter in Col-0 and snrk2.8-1 plants. Plants were infected as described in (A). Distal leaves were visualized by DIC and fluorescence microscopy (left panel). (C) Effects of pathogen infection on the nucleo-cytoplasmic distribution of NPR1. The MYC-NPR1 fusion was overexpressed in Col-0 or snrk2.8-1, as described above. Plants were infected as described in (A), and two upper leaves were harvested 24 h after infection for cell fractionation. NPR1 proteins were immunologically detected using an anti-MYC antibody (left panel). Antitubulin and anti-H3 antibodies were used for the detection of cytoplasmic and nuclear markers, respectively. Blots were quantitated using the ImageJ software (right panel). Band intensities of nuclear fractions were divided by those of cytoplasmic fractions to obtain relative values. Three blots were averaged and statistically treated (t test, *P < 0.01). Bars indicate sd. The relative intensity of pathogen-treated cytoplasmic fraction was set to 1. Percentage indicates the ratio of nuclear to cytoplasmic distribution. Nu, nuclear fraction; Cy, cytoplasmic fraction.
Figure 6.
Figure 6.
SnRK2.8-Mediated Phosphorylation Is Important for the Nuclear Import of NPR1. (A) and (B) SAR induction in npr1-2 mutant expressing T373A-GFP or S589A-GFP gene fusions. Four-week-old plants grown in soil were used for pathogen infection. Thr-373 (A) or Ser-589 (B) of NPR1 was mutated to alanine and overexpressed driven by the CaMV 35S promoter in npr1-2 mutant. Bacterial cell counting was performed as described in Figure 1E. Four measurements were averaged and statistically treated using Student's t test (*P < 0.01). Bars indicate sd. (C) and (D) Nucleo-cytoplasmic distribution of T373A-GFP and S589A-GFP in pathogen-infected plants. Plants used were identical to those described in (A) and (B). The 35S:T373A-GFP (C) and 35S:S589A-GFP (D) transgenic plants were infected as described in Figure 5A. The α-tubulin and Η3 proteins were immunologically detected as described in Figure 5C. NPR1-GFP, T373A-GFP, and S589A-GFP proteins were detected using an anti-GFP antibody.
Figure 7.
Figure 7.
SnRK2.8-Mediated Nuclear Import of NPR1 Is Not Directly Linked with SA. In (A) to (C), band intensities of three blots were averaged and statistically analyzed (t test, *P < 0.01). Bars indicate sd. (A) Nucleo-cytoplasmic distribution of SnRK2.8 in pathogen-infected plants. A MYC-SnRK2.8 gene fusion was overexpressed driven by the CaMV 35S promoter in Col-0 plant. Plants were infected as described in Figure 5A. MYC-SnRK2.8, α-tubulin, and Η3 proteins were detected as described in Figure 5C. (B) Elevation of SnRK2.8 activity after pathogen infection. Four-week-old 35S:MYC-SnRK2.8 transgenic plants grown in soil were infected with Pst DC3000/avrRpt2 cells. Two upper leaves were harvested 24 h after infection for immunoprecipitation of MYC-SnRK2.8 proteins. Five micrograms of recombinant MBP-NPR1 proteins was mixed with immunoprecipitated MYC-SnRK2.8 proteins and incubated as described in Figure 4A. MBP-NPR1 and MYC-SnRK2.8 proteins in the reaction mixtures were detected by Coomassie blue staining (CB) and immunoblot hybridization (IB), respectively (upper panel). Band intensities were quantitated using the ImageJ software (lower panel). Relative radioactivity (RA) to the amount of MYC-SnRK2.8 protein was displayed. (C) Effects of SA on SnRK2.8 activity. Two-week-old 35S:MYC-SnRK2.8 transgenic plants grown on MS-agar plates were treated with 0.5 mM SA as described in Figure 2A. Whole plants were harvested 24 h after SA treatment for immunoprecipitation of MYC-SnRK2.8 proteins. Five micrograms of recombinant MBP-NPR1 proteins was mixed with immunoprecipitated MYC-SnRK2.8 proteins and incubated as described in Figure 4A. MBP-NPR1 and MYC-SnRK2.8 proteins were immunologically detected and quantitated as described in (B). (D) Nucleo-cytoplasmic distribution of NPR1 in SA-treated plant cells. Two-week-old plants grown on MS-agar plates were treated with 0.5 mM SA for 24 h. Whole plants were used for cell fractionation. MYC-NPR1, α-tubulin, and Η3 proteins were immunologically detected as described in Figure 5C.
Figure 8.
Figure 8.
SnRK2.8 Is Required for NPR1 Activation during SAR. SnRK2.8 modulates the nuclear import of NPR1 in inducing SAR. In this signaling network, the SnRK2.8-mediated NPR1 activation is integrated with SA signaling to ensure SAR to occur in distal tissues. The signaling steps examined or elucidated in this work are indicated by bold arrows.

Comment in

Similar articles

Cited by

References

    1. Berger S., Sinha A.K., Roitsch T. (2007). Plant physiology meets phytopathology: plant primary metabolism and plant-pathogen interactions. J. Exp. Bot. 58: 4019–4026. - PubMed
    1. Block A., Alfano J.R. (2011). Plant targets for Pseudomonas syringae type III effectors: virulence targets or guarded decoys? Curr. Opin. Microbiol. 14: 39–46. - PMC - PubMed
    1. Bolton M.D. (2009). Primary metabolism and plant defense--fuel for the fire. Mol. Plant Microbe Interact. 22: 487–497. - PubMed
    1. Boudsocq M., Barbier-Brygoo H., Laurière C. (2004). Identification of nine sucrose nonfermenting 1-related protein kinases 2 activated by hyperosmotic and saline stresses in Arabidopsis thaliana. J. Biol. Chem. 279: 41758–41766. - PubMed
    1. Boyle P., Le Su E., Rochon A., Shearer H.L., Murmu J., Chu J.Y., Fobert P.R., Després C. (2009). The BTB/POZ domain of the Arabidopsis disease resistance protein NPR1 interacts with the repression domain of TGA2 to negate its function. Plant Cell 21: 3700–3713. - PMC - PubMed

Publication types

MeSH terms

LinkOut - more resources