. 2016 Jan 15;196(2):573-85.
doi: 10.4049/jimmunol.1501406. Epub 2015 Dec 16.

Selective ORAI1 Inhibition Ameliorates Autoimmune Central Nervous System Inflammation by Suppressing Effector but Not Regulatory T Cell Function

Affiliations

Selective ORAI1 Inhibition Ameliorates Autoimmune Central Nervous System Inflammation by Suppressing Effector but Not Regulatory T Cell Function

Ulrike Kaufmann et al. J Immunol. .

Abstract

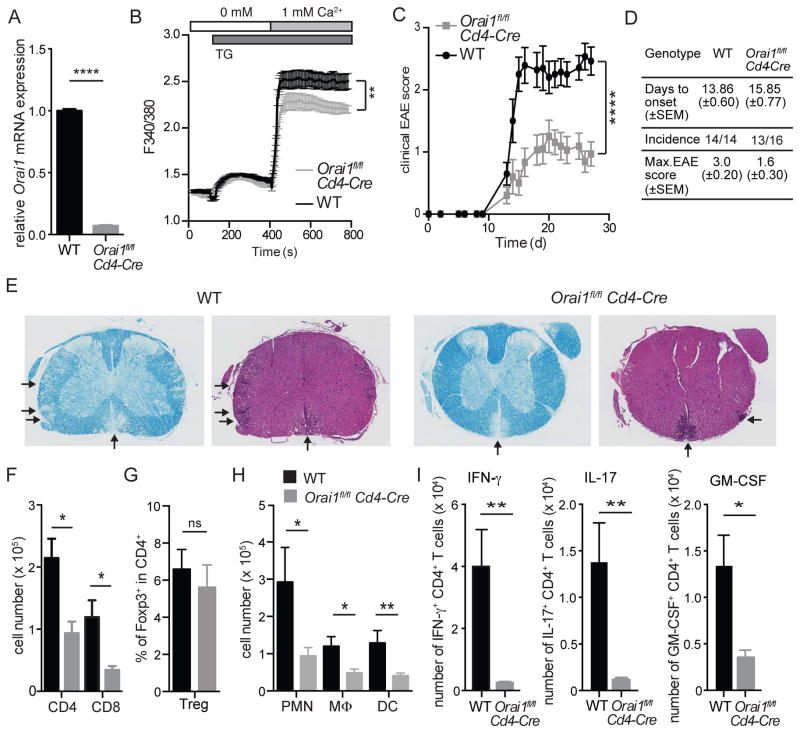
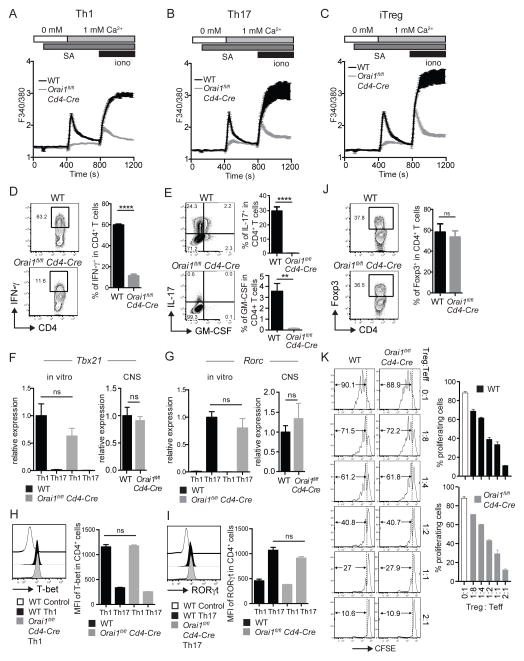
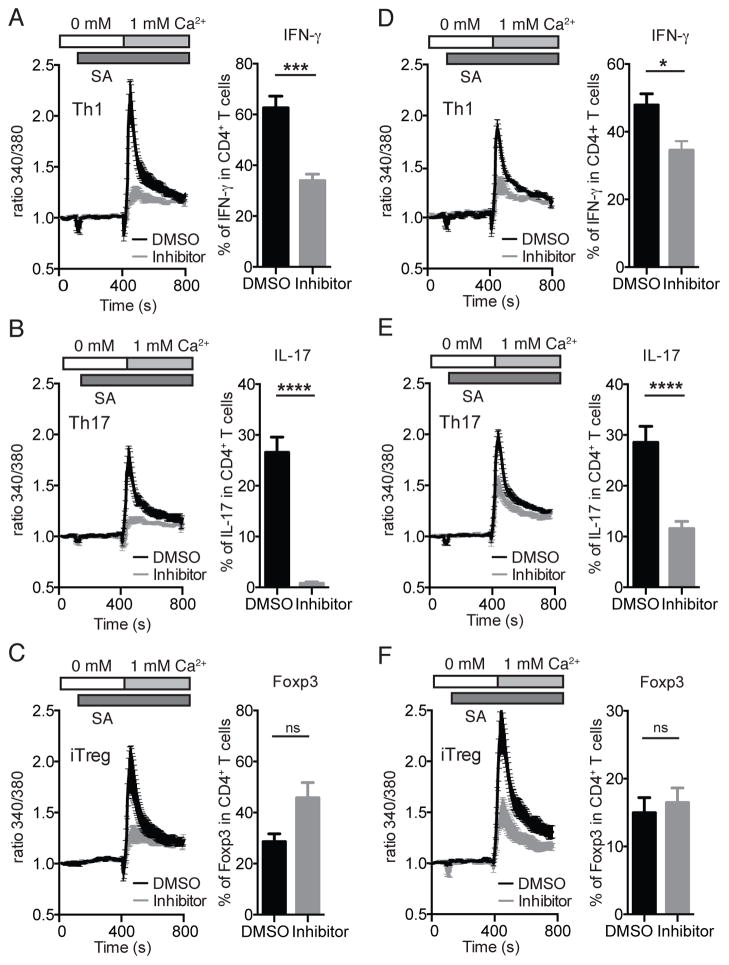
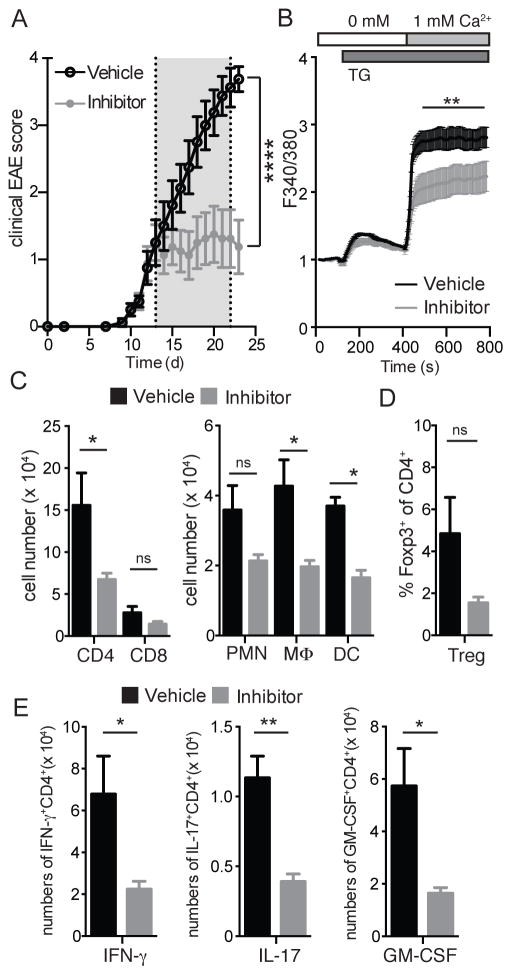
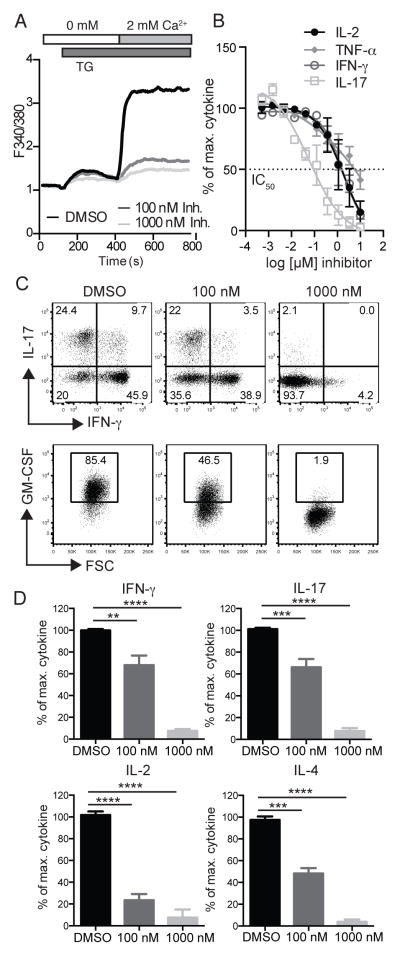
The function of CD4(+) T cells is dependent on Ca(2+) influx through Ca(2+) release-activated Ca(2+) (CRAC) channels formed by ORAI proteins. To investigate the role of ORAI1 in proinflammatory Th1 and Th17 cells and autoimmune diseases, we genetically and pharmacologically modulated ORAI1 function. Immunization of mice lacking Orai1 in T cells with MOG peptide resulted in attenuated severity of experimental autoimmune encephalomyelitis (EAE). The numbers of T cells and innate immune cells in the CNS of ORAI1-deficient animals were strongly reduced along with almost completely abolished production of IL-17A, IFN-γ, and GM-CSF despite only partially reduced Ca(2+) influx. In Th1 and Th17 cells differentiated in vitro, ORAI1 was required for cytokine production but not the expression of Th1- and Th17-specific transcription factors T-bet and RORγt. The differentiation and function of induced regulatory T cells, by contrast, was independent of ORAI1. Importantly, induced genetic deletion of Orai1 in adoptively transferred, MOG-specific T cells was able to halt EAE progression after disease onset. Likewise, treatment of wild-type mice with a selective CRAC channel inhibitor after EAE onset ameliorated disease. Genetic deletion of Orai1 and pharmacological ORAI1 inhibition reduced the leukocyte numbers in the CNS and attenuated Th1/Th17 cell-mediated cytokine production. In human CD4(+) T cells, CRAC channel inhibition reduced the expression of IL-17A, IFN-γ, and other cytokines in a dose-dependent manner. Taken together, these findings support the conclusion that Th1 and Th17 cell function is particularly dependent on CRAC channels, which could be exploited as a therapeutic approach to T cell-mediated autoimmune diseases.


Conflict of interest statement

Conflict of interest statement: S.F. is a cofounder of Calcimedica; R.S., K.G., and H.J.M are full-time employees of Amgen, Inc.; The remaining authors (U.K., P.J.S., L.K. and D.U.) declare no conflict of interest.

Figures

Figure 1
Figure 1. Experimental autoimmune encephalomyelitis (EAE) is ameliorated in Orai1fl/fl Cd4-Cre mice
(A) RNA from wildtype and Orai1fl/fl Cd4-Cre was isolated from CD4+ T cells and relative mRNA expression was measured by RT PCR. (B) SOCE was measured in Fura2-AM loaded freshly isolated CD4+ T cells from wildtype and Orai1fl/fl Cd4-Cre mice after stimulation with thapsigargin (TG) followed by readdition of 1 mM Ca2+ to the extracellular medium. (C) Clinical EAE scores in WT and Orai1fl/fl Cd4-Cre mice injected with MOG35-55 in CFA. (D) Summary of EAE with days to onset (±SEM), incidence of EAE and maximal EAE scores (±SEM). (E) H&E and Luxol fast blue staining of spinal cords from WT and Orai1fl/fl Cd4-Cre mice at 27 after EAE induction. Arrows indicate infiltrating cells and demyelination, respectively. Shown is one histological stain representative of 4 mice per group and 6 examined levels of spinal cord per mouse. (F–I) Cells were isolated from the spinal cord (CNS) of WT and Orai1fl/fl Cd4-Cre mice at day 27 after EAE induction and analyzed by flow cytometry. (F–H) Absolute numbers of CD4+ and CD8+ T cells (F), frequencies of Foxp3+ CD4+ T cells (G) and absolute numbers of CD11b+ Gr-1+ polymorphonuclear cells (PMN), CD11b+ CD11c- Gr-1- macrophages and CD11c+ Gr-1- dendritic cells in the CNS (H). (I) Cytokine production of T cells isolated from the CNS was analyzed by flow cytometry after stimulation with PMA and ionomycin in the presence of Brefeldin A for 6 h. Shown are absolute numbers of CD4+ T cells expressing IFN-γ, IL-17 or GM-CSF. Data in panels A and B represent the average ± SEM of 3 mice per group. Data in panels C–D and F–H represent the average ± SEM of 14–16 mice per group. Statistical analysis of EAE scores (starting at the first clinical signs of EAE) was performed using a Mann-Whitney test (panel C); data in panels B, F–H were analyzed using an unpaired Student’s t test. * p < 0.01, ** p < 0.001.
Figure 2
Figure 2. Lack of ORAI1 attenuates SOCE and severely inhibits the function of Th1 and Th17 but not iTreg cells
Naïve CD4+ T cells from spleen and LNs of WT and Orai1fl/fl Cd4-Cre mice were stimulated with anti-CD3/CD28 and cultured for 3 days in vitro under Th1, Th17 and iTreg polarizing conditions. (A–C) SOCE was measured in Fura2-AM loaded cells after stimulation with anti-CD3-Biotin and crosslinking with streptavidin followed by readdition of 1 mM Ca2+ to the extracellular medium. (D, E) Frequencies of IFN-γ+, IL-17+ and GM-CSF+ CD4+ T cells measured after stimulation with PMA and ionomycin for 6 h in the presence of Brefeldin A. Bar graphs represent the average ± SEM from 4 independent experiments with one mouse per group. (F, G) Relative mRNA expression of Tbx21 and Rorc in Th1 and Th17 cells cultured in vitro (left) and in lymphocytes isolated from the spinal cord of WT and Orai1fl/fl Cd4-Cre mice on day 27 after immunization with MOG35-55 peptide in CFA (right). Tbx21 and Rorc mRNA levels were analyzed by real-time PCR (and normalized to Hprt1 (left panels) or CD4 in right panels). Bar graphs represent the average ± SEM of 4–6 mice per group. (H, I) Flow cytometric analysis of T-bet and RORγt in Th1 and Th17 polarized cells. WT control in the left panel are Th17 polarized cells and WT control in the right panel are Th1 polarized cells. Bar graphs represent the average ± SEM from 3 mice per group. (J) Frequencies of Foxp3+ CD4+ iTreg cells after 3 days in vitro without restimulation. Bar graphs represent the average ± SEM from 4 independent experiments with one mouse per group. (K) ORAI1 is not required for iTreg function. WT or Orai1fl/fl Cd4-Cre iTreg cells that had been differentiated for 3 days in vitro were coincubated at different ratios with CFSE-labeled, anti-CD3-stimulated CD4+ T cells and splenocytes from WT mice. Proliferation of CD4+ T cells was assessed after 3 days in culture by CFSE dilution and flow cytometry. Shown is one representative experiment done in triplicates of two independent experiments. No statistically significant difference of proliferation was detected between T cells incubated with WT and Orai1-deficient Treg cells at different ratios by one-way ANOVA. Statistical analysis in D-J was performed using an unpaired Student’s t test. ** p < 0.01, **** p < 0.0001.
Figure 3
Figure 3. Inducible deletion of Orai1 gene in T cells during ongoing EAE ameliorates disease severity
(A,B) In vitro deletion of Orai1 in CD4+ T cells isolated from Orai1fl/fl Cre-ERT2, WT and Orai1fl/fl Cd4-Cre control mice. Cells were stimulated with anti-CD3/CD28 for 3 days in the presence of 1 μM tamoxifen (TAM) and analyzed for SOCE after stimulation with thapsigargin and addition of 1 mM Ca2+ (A) and Orai1 mRNA expression by RT PCR (B). (C–F) For passive induction of EAE, Orai1fl/fl Cre-ERT2 and WT mice were immunized with MOG peptide. T cells were isolated from spleen and LNs 12 days later and restimulated in vitro with MOG peptide in the presence of IL-23 for 3 days. 4 × 10⁶ CD4+ T cells were transferred i.v. into sublethally irradiated CD45.1 recipient mice. After EAE symptoms developed, recipient mice were injected with tamoxifen or vehicle control from day 10–14 after T cell transfer. (C) Clinical EAE scores. (D–F) Absolute numbers of CD4+ and CD8+ T cells (D) as well as CD11b+ Gr-1+ polymorphonuclear cells (PMN), CD11b+ CD11c- Gr-1- macrophages and CD11c+ Gr-1- dendritic cells (E) in the CNS 18 days after adoptive transfer. (F) Frequencies of CD4+ IFN-γ+ and CD4+ IL-17+ T cells isolated from the CNS and restimulated in vitro with PMA and ionomycin for 6h. Data represent the average ± SEM of 3–4 mice per group. Statistical analysis of Orai1 expression in B was performed using a one-way ANOVA test. Statistical analysis of EAE scores (days 10–18) in C was performed using a Mann-Whitney test. Data in panels D–F were analyzed using an unpaired Student’s t test. * p < 0.05, ** p < 0.005, **** p < 0.0001.
Figure 4
Figure 4. The function of Th1 and Th17 but not iTreg cells is blocked by selective CRAC channel inhibitor
CD4+ T cells isolated from the spleen and LNs of WT were stimulated with anti-CD3/CD28 for 3 days in vitro under Th1, Th17 and iTreg polarizing conditions. The CRAC channel inhibitor AMG1 (100 nM) or vehicle (DMSO) was added on day 0 and was present throughout T cell differentiation (day 0–3) (A–C) or added on day 3 immediately before Ca2+ measurements (D–F, left panels) or restimulation to measure cytokine production (D–F, right panels). For Ca2+ measurements (left panels), CD4+ T cells were loaded with Fura2-AM, incubated with Biotin-labeled anti-CD3 and activated by CD3 crosslinking with streptavidin in Ca2+ free extracellular buffer. To induce SOCE, extracellular [Ca2+] was raised to 1 mM. For cytokine production, CD4+ T cells were stimulated with PMA and ionomycin for 6 h. For analysis of Foxp3 expression, CD4+ T cells were left unstimulated. Data represent the average ± SEM of 3–8 mice per group. Statistical analysis was performed using an unpaired Student’s t test. * p < 0.05, ** p < 0.01, *** p < 0.0005, **** p < 0.0001.
Figure 5
Figure 5. Progression and severity of EAE are attenuated by treatment of mice with CRAC channel inhibitor
(A) Clinical EAE score in WT mice injected with MOG35-55 in CFA. Mice were treated with 6 mg/kg of the CRAC channel inhibitor AMG1 or vehicle control for 10 days starting when EAE scores were ≥ 1. Graphs represent the average ± SEM of 8 mice per group. (B) Ca2+ influx was measured in splenocytes isolated at the end of 10 day treatment with inhibitor or vehicle. Cells were loaded with Fura2-AM and stimulated with 1 μM thapsigargin (TG) in Ca2+ free buffer, followed by readdition of 1 mM extracellular Ca2+ to induce SOCE. (C) Absolute numbers of CD4+ and CD8+ T cells and CD11b+ Gr-1+ polymorphonuclear (PMN) cells, CD11b+ CD11c- Gr-1- macrophages and CD11c+ Gr-1- DC isolated from the CNS of mice at day 23 after EAE induction and analyzed by flow cytometry. (D) Frequencies of CD4+Foxp3+ Treg cells in the CNS at day 23 after EAE induction. (E) Expression of IFN-γ, IL-17 and GM-CSF by CD4+ T cells isolated from the CNS at day 23 after EAE induction and stimulated with PMA and ionomycin for 6 h. Data represent the average ± SEM of 8 mice per group. Statistical analysis of EAE scores in A (days 13–23) was performed using a Mann-Whitney test; data in panels B–E were analyzed using an unpaired Student’s t test. * p < 0.01, ** p < 0.001.
Figure 6
Figure 6. Suppression of SOCE and cytokine production in human T cells by CRAC channel inhibitor
(A) Human CD4+ T cells from healthy donors were cultured for 12 days in vitro and following incubated with 100 nM and 1000 nM of AMG1 for 2 h and analyzed for SOCE by stimulation with 1 μM Thapsigargin. Ca2+ traces are representative of 3 repeat experiments. (B) Human whole blood from healthy donors was treated with different concentrations of AMG1 (0.5 nM – 10 μM) and analyzed for cytokine production by immunoassay after 24 h stimulation with PMA and ionomycin. Data represent the average ± SEM of 2 experiments. (C, D) Sorted human CD4+ CCR6+ T cells from a healthy donor were stimulated with anti-CD3/CD28 coated beads and expanded in IL-2 containing medium for 12 days. Cells were treated with 100 nM and 1000 nM of AMG1 1 h before and during restimulation with PMA and ionomycin for 4 h in the presence of GolgiStop. Cytokine expression was analyzed in CD4+ CCR6+ T cells by flow cytometry. Data in D represent the average ± SEM of 4 repeat experiments. Statistical analysis of data in D was performed using one-way ANOVA test. ** p < 0.005, *** p < 0.001, **** p < 0.0001.

References

    1. Ben-Nun A, Wekerle H, Cohen IR. The rapid isolation of clonable antigen-specific T lymphocyte lines capable of mediating autoimmune encephalomyelitis. Eur J Immunol. 1981;11:195–199. - PubMed
    1. Kuchroo VK, Anderson AC, Waldner H, Munder M, Bettelli E, Nicholson LB. T cell response in experimental autoimmune encephalomyelitis (EAE): role of self and cross-reactive antigens in shaping, tuning, and regulating the autopathogenic T cell repertoire. Annu Rev Immunol. 2002;20:101–123. - PubMed
    1. Ando DG, Clayton J, Kono D, Urban JL, Sercarz EE. Encephalitogenic T cells in the B10.PL model of experimental allergic encephalomyelitis (EAE) are of the Th-1 lymphokine subtype. Cell Immunol. 1989;124:132–143. - PubMed
    1. Traugott U, Lebon P. Interferon-gamma and Ia antigen are present on astrocytes in active chronic multiple sclerosis lesions. J Neurol Sci. 1988;84:257–264. - PubMed
    1. Langrish CL, Chen Y, Blumenschein WM, Mattson J, Basham B, Sedgwick JD, McClanahan T, Kastelein RA, Cua DJ. IL-23 drives a pathogenic T cell population that induces autoimmune inflammation. J Exp Med. 2005;201:233–240. - PMC - PubMed

Publication types

MeSH terms