. 2015 Dec 15;13(10):2107-17.
doi: 10.1016/j.celrep.2015.11.010. Epub 2015 Dec 7.

Direct In Vivo Manipulation and Imaging of Calcium Transients in Neutrophils Identify a Critical Role for Leading-Edge Calcium Flux

Affiliations

Direct In Vivo Manipulation and Imaging of Calcium Transients in Neutrophils Identify a Critical Role for Leading-Edge Calcium Flux

Rebecca W Beerman et al. Cell Rep. .

Abstract

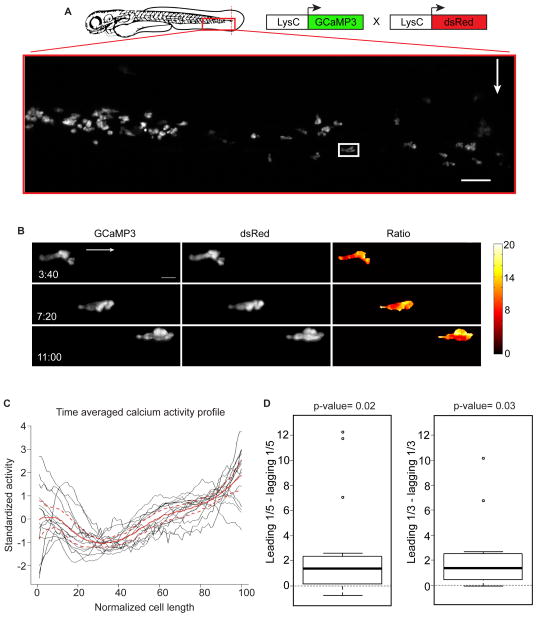
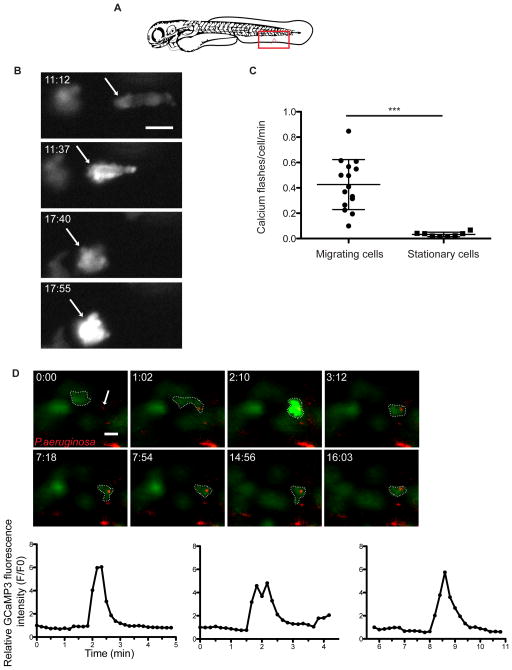
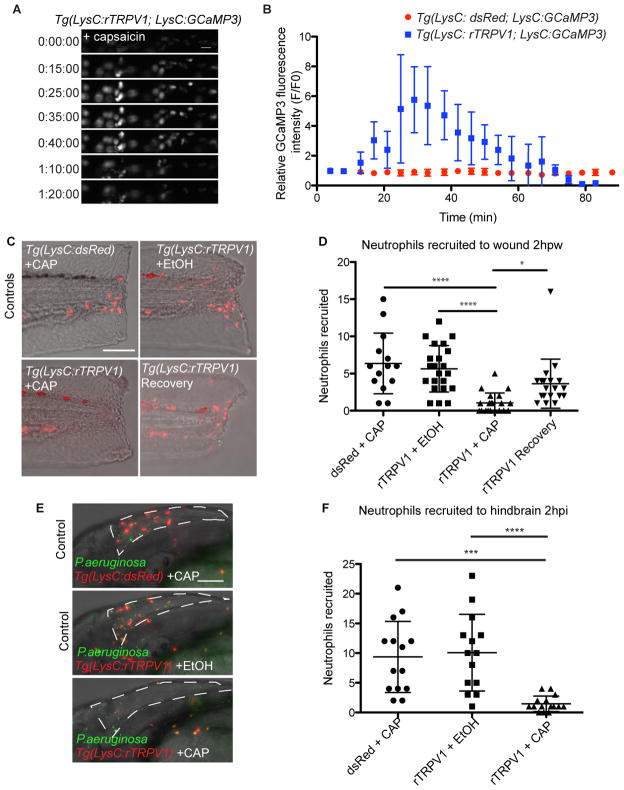
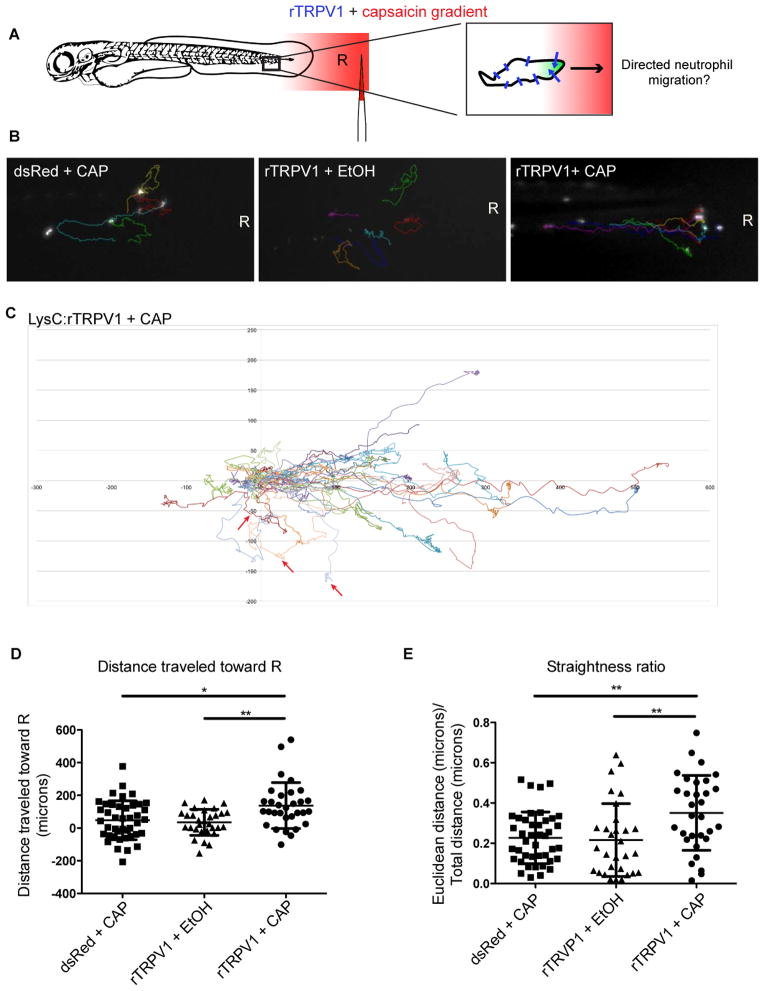
Calcium signaling has long been associated with key events of immunity, including chemotaxis, phagocytosis, and activation. However, imaging and manipulation of calcium flux in motile immune cells in live animals remain challenging. Using light-sheet microscopy for in vivo calcium imaging in zebrafish, we observe characteristic patterns of calcium flux triggered by distinct events, including phagocytosis of pathogenic bacteria and migration of neutrophils toward inflammatory stimuli. In contrast to findings from ex vivo studies, we observe enriched calcium influx at the leading edge of migrating neutrophils. To directly manipulate calcium dynamics in vivo, we have developed transgenic lines with cell-specific expression of the mammalian TRPV1 channel, enabling ligand-gated, reversible, and spatiotemporal control of calcium influx. We find that controlled calcium influx can function to help define the neutrophil's leading edge. Cell-specific TRPV1 expression may have broad utility for precise control of calcium dynamics in other immune cell types and organisms.


Figures

Figure 1
Figure 1. Calcium is enriched at the leading edge of migrating neutrophils in vivo
(A) Illustration of a caudal fin amputation (red dotted line) in a double transgenic larva Tg(LysC:GCaMP3; LysC:dsRed) with the field of view in the red box. White arrow indicates fin amputation and white box highlights the neutrophil in the still frames in (B). Scale bar is 50 μm. (B) Maximum-intensity projections from time-lapse experiments with light-sheet fluorescence microscopy follow a single neutrophil migrating toward wound, displaying image data from each channel (GCaMP3 or dsRed) and resulting ratiometric image (GCaMP3/dsRed). Arrow indicates overall direction of migration. t=0 corresponds to 40 min post wounding. Scale bar is 10μm. (C) Time-averaged calcium activity profile across the length of a migrating neutrophil (normalized relative to direction of migration: 0 is the lagging edge and 100 is the leading edge). Each neutrophil is graphed in black (n=15, from 4 animals) with the mean profile (red line), bound by 95% confidence intervals (dashed red lines). (D) Left box plot shows the difference between the average calcium signal at the leading and lagging edge (one-fifth of the length) for each neutrophil examined in (C). Middle line is the median, the box is the middle 50%, the upper and lower bars indicate data range, with outliers as dots. Calculations were also repeated using the leading and lagging one-third of each cell (right box plot). Hypothesis that the average difference was positive was tested using a one sample t-test. See also Figures S1–S3, and Movie S1.
Figure 2
Figure 2. Neutrophils undergo whole-cell calcium flux at sites of injury and upon phagocytosis of bacteria
(A) Cartoon of a ventral fin wound (red notch) and field of view during imaging (red square). (B) Fluorescent images from a time-lapse following GCaMP3 expression in a neutrophil migrating toward a ventral fin wound in a Tg(LysC:GCaMP3) larva. t=0 corresponds to 5 min post wounding. Arrow highlights a single neutrophil as it periodically flashes during migration toward a ventral wound. (C) Mean number of whole-cell calcium flashes per cell per min during first hr post wounding in migrating neutrophils and stationary neutrophils. Error bars are mean ± s.d. Mann-Whitney test ***, p<0.0001. (n=15 cells from 5 larvae for migrating cells and n=8 cells from 4 larvae for stationary cells). (D) Still frames from time-lapse capturing calcium flash upon LysC:GCaMP3 neutrophil (green) phagocytosis of P. aeruginosa (red). Dotted line surrounds the phagocytic neutrophil in each frame and the arrow highlights bacteria that will be phagocytosed. t=0 corresponds to 30 min post infection. Scale bars are 10 μm. Graphs quantify the increase in relative fluorescence intensity from GCaMP3 (F/F0) during phagocytosis of PAO1. (Left graph corresponds to the panels above and the center and right graphs correspond to additional examples shown in Movie S2, parts 3 and 4, respectively). See also Movie S2.
Figure 3
Figure 3. Regulated calcium flux is required for neutrophil recruitment
Time-lapse experiment shows no change in GCaMP3 fluorescence in neutrophils from control Tg(LysC:dsRed; LysC:GCaMP3) larva after addition of capsaicin, and increased GCaMP3 fluorescence in neutrophils from Tg(LysC:rTRPV1; LysC:GCaMP3) larva. (A) Selected still frames show GCaMP fluorescence in Tg(LysC:rTRPV1; LysC:GCaMP3) larva during extended exposure to capsaicin. t=0 corresponds to 5 min after addition of capsaicin. Scale bar is 20 μm. (B) Quantification of the relative GCaMP fluorescence intensity (F/F0) during extended capsaicin treatment (n=5 neutrophils for each larva). Error bars are mean ± s.d. See also Movie S3. (C–F) Tg(LysC:rTRPV1; LysC:GCaMP3) or Tg(LysC:dsRed; LysC:GCaMP3) larvae were wounded (C, D) or infected with P. aeruginosa in the hindbrain (E, F) and briefly pulsed with capsaicin (CAP) or soaked in ethanol (EtOH) for 2 hr before neutrophil recruitment was quantified. Recovery Tg(LysC:rTRPV1; LysC:GCaMP3) larvae were pulsed with CAP before wounding, followed by EtOH soak for 2 hr to assess neutrophil recovery after capsaicin treatment (C, D). (C) Representative maximum-intensity projections show red-fluorescent neutrophils merged with brightfield at 2hr post wounding. (E) Representative maximum-intensity projections show red-fluorescent neutrophils and green-fluorescent P. aeruginosa at 2hr post infection within the hindbrain ventricle outlined by white dashed line. Scale bars are 100μm. (D, F) Graphs display the number of neutrophils recruited for each larva. Error bars are mean ± s.d. Kruskal-Wallis test followed by Dunn’s Multiple Comparison test: ****, adjusted p<0.0001, ***, adjusted p=0.0002, and *, adjusted p=0.014. Each experiment was carried out at least twice.
Figure 4
Figure 4. A capsaicin gradient directs rTRPV1-neutrophil motility
(A) Injecting capsaicin (red) into surrounding agarose generates an intracellular calcium gradient (green) in neutrophils expressing rTRPV1 channels (blue lines). R indicates the reference point, defined as the initial point source of the gradient. Three experimental groups were imaged: Tg(LysC:dsRed; LysC:GCaMP3) larvae in a capsaicin gradient (dsRed+CAP), Tg(LysC:rTRPV1; LysC:GCaMP3) larvae in an ethanol gradient (rTRPV1+EtOH), or capsaicin gradient (rTRPV1+CAP). (B) Last frames from Movie S4 show the tracks of individual neutrophils from each experimental group (quantified in D, E) relative to the reference point R at the focal point of the gradient. (C) (x,y) coordinates for each neutrophil at every frame tracked within the Tg(LysC:rTRPV1) larvae exposed to a capsaicin gradient visually illustrate the directed motion toward the source. The track for each cell was normalized such that the starting (x,y) position was (0,0) for every cell. All units are μm. One larva from the rTRPV1 + CAP group was assessed after exposure to a ventrally-centered gradient along the bottom of the animal and the three tracked cells from that animal are highlighted with red arrows. (D, E) Graphs show the final distance traveled toward the reference point (D), and straightness ratio (E) for tracked neutrophils. Error bars are mean ± s.d. (D) Kruskal-Wallis test followed by Dunn’s multiple comparison test: *, adjusted p=0.012 and **, adjusted p value= 0.0075. (E) One-way ANOVA followed Tukey’s multiple comparisons test: **, adjusted p value= 0.0052 for dsRed+ CAP versus rTRPV1+CAP and **, adjusted p value= 0.005 for rTRPV1+ EtOH versus rTRPV1+CAP. For each group: n≥30 cells from ≥10 larvae. See also Figure S4 and Movie S4.
Figure 5
Figure 5. Inhibition of calcium channels disrupts neutrophil directionality during recruitment
(A–D) After caudal fin amputation, Tg(LysC:GFP) or Tg(LysC:dsRed) larvae were immediately treated with vehicle alone (control) or 20μM SKF 96365 (SKF), followed by quantification of neutrophil recruitment 3 hr post wounding (A, B). (A) Error bars are mean ± s.d. Mann-Whitney test **** p<0.0001 (B) Groups of larvae were placed in control treatments for 10, 20, or 30 minutes before replacement of media with SKF for the remainder. Error bars are mean ± s.d. One-way ANOVA followed by Tukey’s multiple comparisons test ***, p<0.001. Each experiment was carried out at least twice. (C, D) Immediately after wounding, larvae were mounted in agarose, immersed with either control or SKF, and then imaged with time-lapse microscopy. (C) For the neutrophils tracked, graphs show their total distance traveled, average velocity, and straightness ratio. Total distance and straightness ratio error bars are mean ± s.d. and average velocity error bars are mean ± s.e.m. t-test ***, p=0.0002. For each group: n=8 cells from 2–3 larvae. (D) Final frames from Movie S5 show the tracks of individual neutrophils (quantified in C) near the amputated fin (approximated by the white line). See also Movie S5.

Comment in

References

    1. Ahrens MB, Orger MB, Robson DN, Li JM, Keller PJ. Whole-brain functional imaging at cellular resolution using light-sheet microscopy. Nat Methods. 2013;10:413–420. - PubMed
    1. Boucek MM, Snyderman R. Calcium influx requirement for human neutrophil chemotaxis: inhibition by lanthanum chloride. Science. 1976;193:905–907. - PubMed
    1. Brannon MK, Davis JM, Mathias JR, Hall CJ, Emerson JC, Crosier PS, Huttenlocher A, Ramakrishnan L, Moskowitz SM. Pseudomonas aeruginosa Type III secretion system interacts with phagocytes to modulate systemic infection of zebrafish embryos. Cellular microbiology. 2009;11:755–768. - PMC - PubMed
    1. Cambier CJ, Takaki KK, Larson RP, Hernandez RE, Tobin DM, Urdahl KB, Cosma CL, Ramakrishnan L. Mycobacteria manipulate macrophage recruitment through coordinated use of membrane lipids. Nature. 2014;505:218–222. - PMC - PubMed
    1. Caterina MJ, Schumacher MA, Tominaga M, Rosen TA, Levine JD, Julius D. The capsaicin receptor: a heat-activated ion channel in the pain pathway. Nature. 1997;389:816–824. - PubMed

Publication types

LinkOut - more resources