. 2015 Dec 22;13(11):2440-2455.
doi: 10.1016/j.celrep.2015.11.022. Epub 2015 Dec 8.

The Msi Family of RNA-Binding Proteins Function Redundantly as Intestinal Oncoproteins

Affiliations

The Msi Family of RNA-Binding Proteins Function Redundantly as Intestinal Oncoproteins

Ning Li et al. Cell Rep. .

Abstract

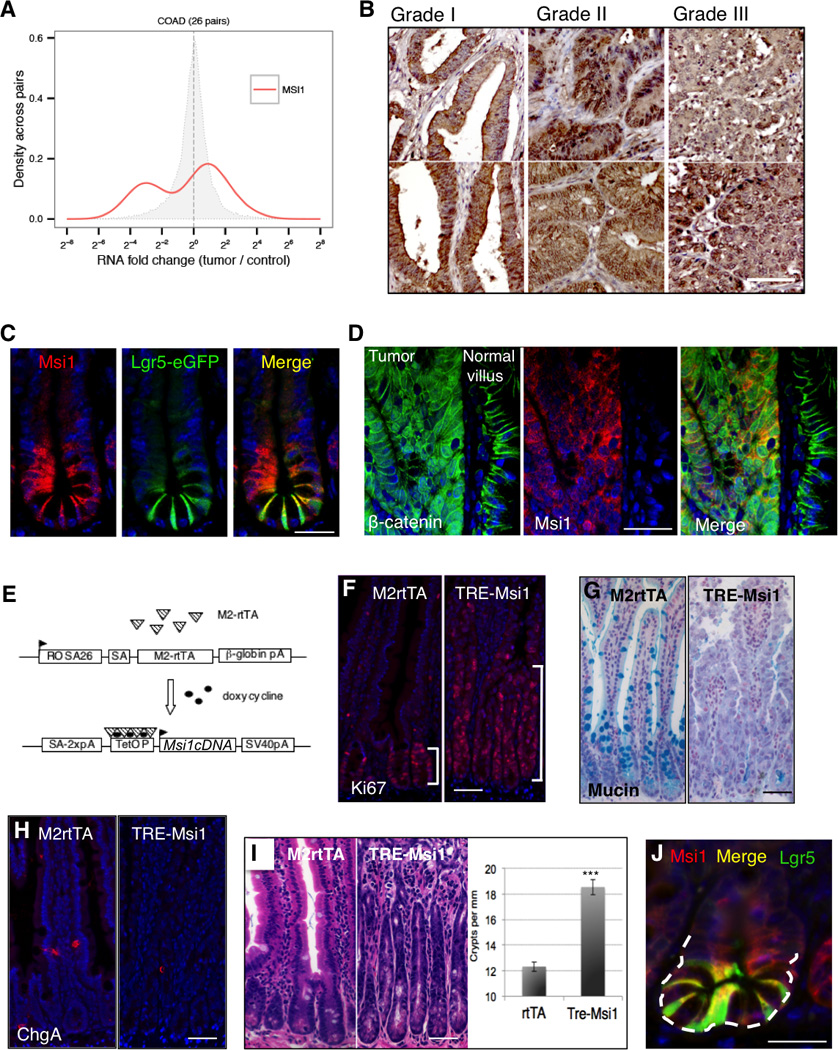
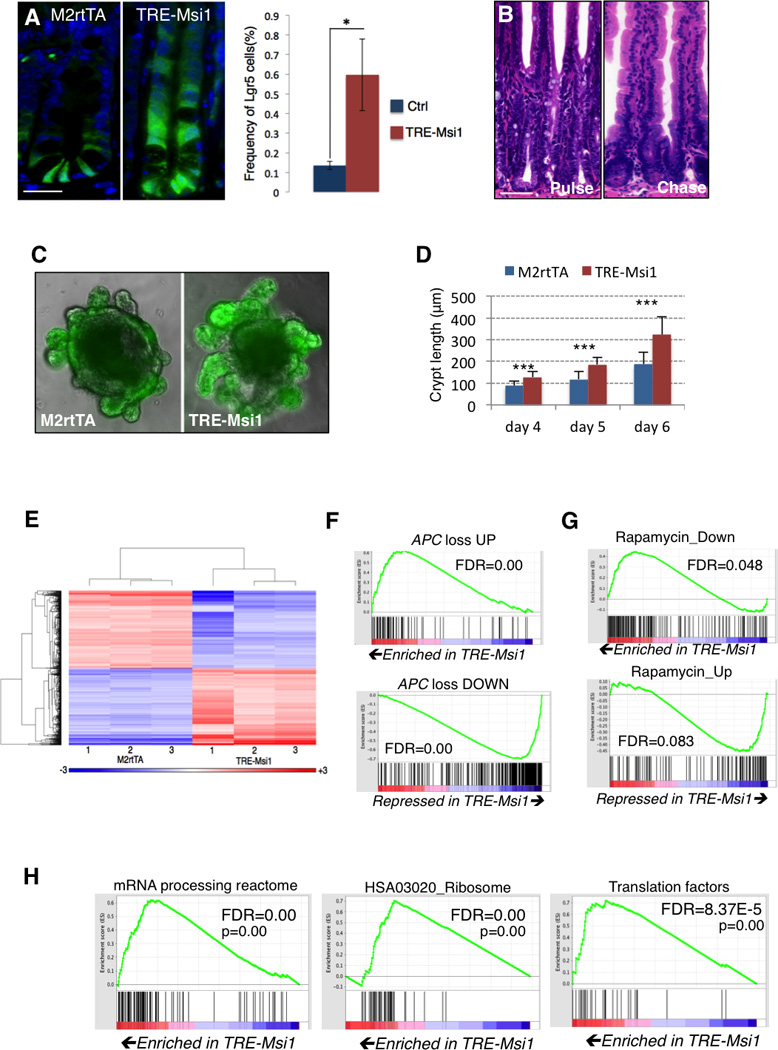
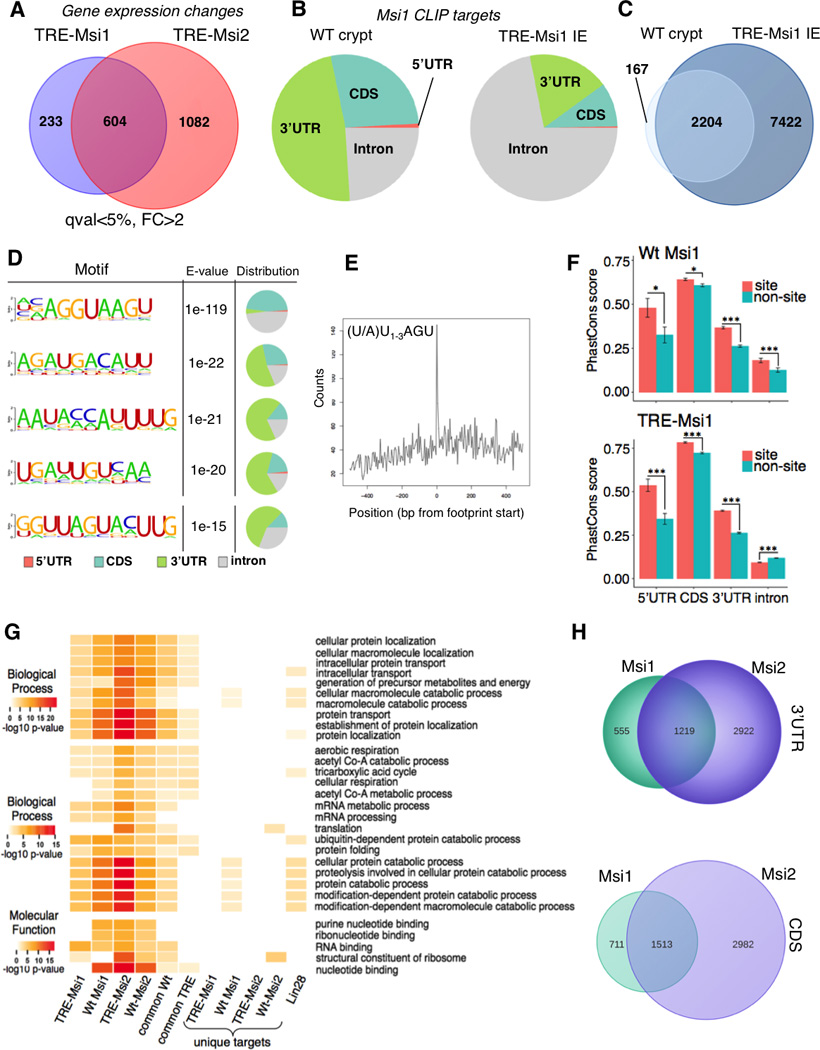
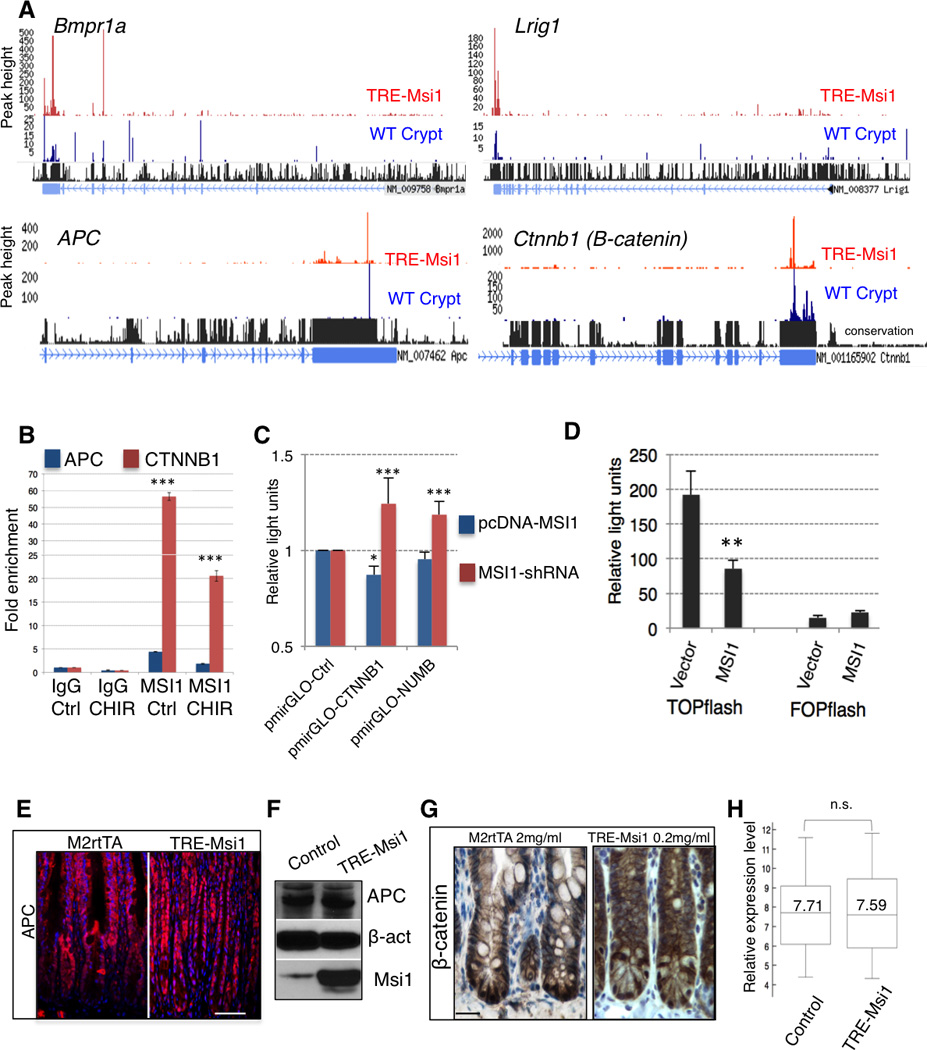
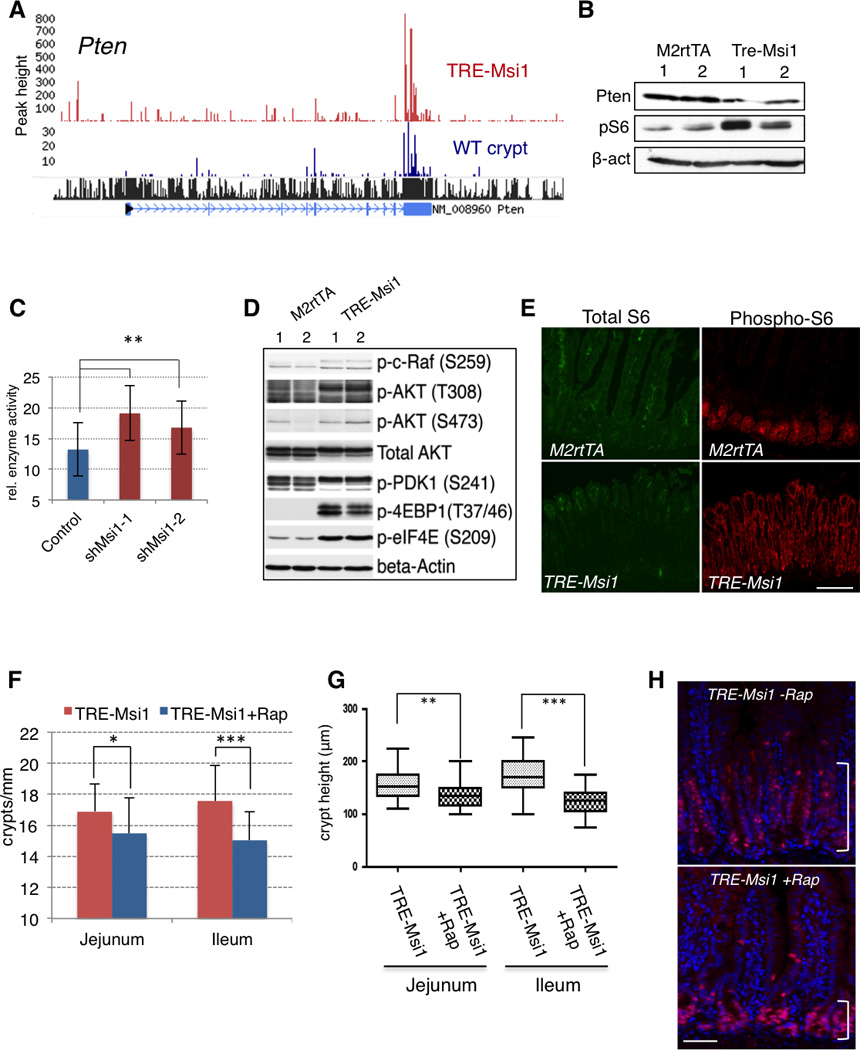
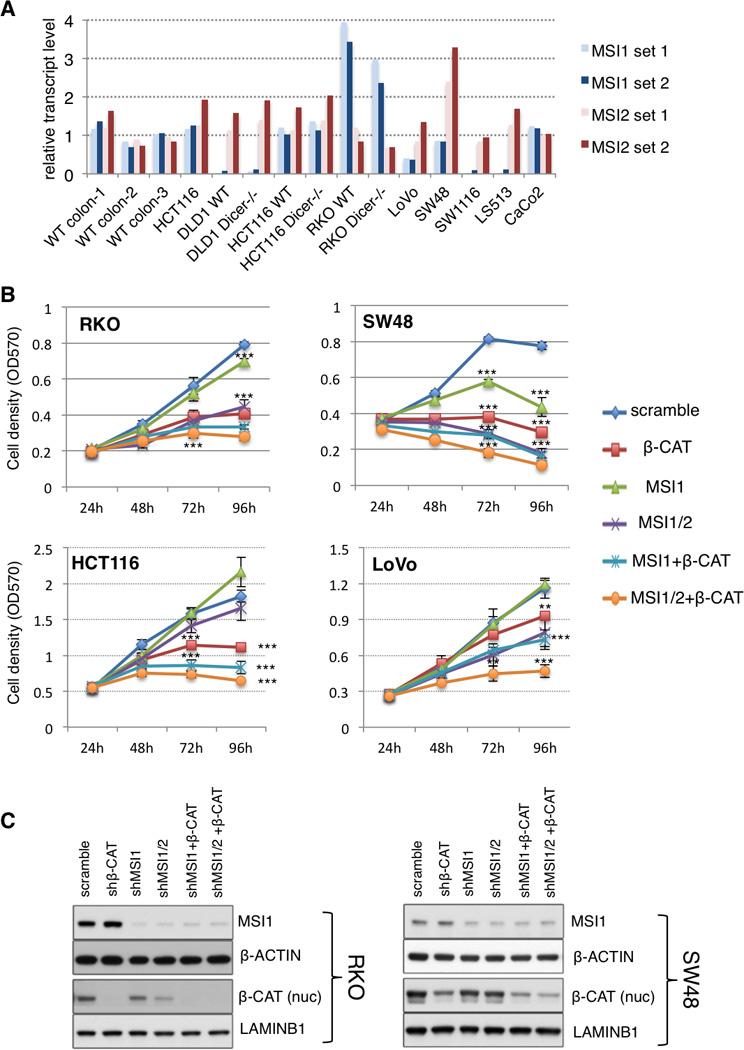
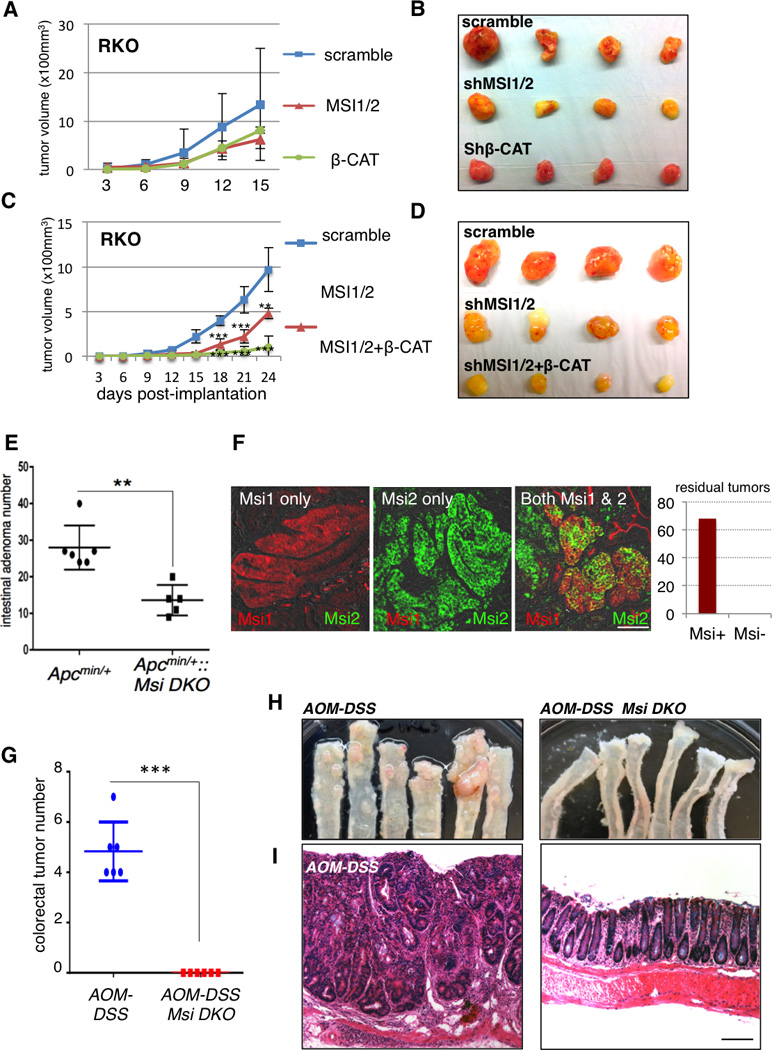
Members of the Msi family of RNA-binding proteins have recently emerged as potent oncoproteins in a range of malignancies. MSI2 is highly expressed in hematopoietic cancers, where it is required for disease maintenance. In contrast to the hematopoietic system, colorectal cancers can express both Msi family members, MSI1 and MSI2. Here, we demonstrate that, in the intestinal epithelium, Msi1 and Msi2 have analogous oncogenic effects. Further, comparison of Msi1/2-induced gene expression programs and transcriptome-wide analyses of Msi1/2-RNA-binding targets reveal significant functional overlap, including induction of the PDK-Akt-mTORC1 axis. Ultimately, we demonstrate that concomitant loss of function of both MSI family members is sufficient to abrogate the growth of human colorectal cancer cells, and Msi gene deletion inhibits tumorigenesis in several mouse models of intestinal cancer. Our findings demonstrate that MSI1 and MSI2 act as functionally redundant oncoproteins required for the ontogeny of intestinal cancers.


Figures

Figure 1
Figure 1. MSI1 is expressed in colorectal cancers and is sufficient to transform the epithelium
A. MSI1 expression in matched tumor/control sample pairs from TCGA colorectal adenocarcinoma (COAD) RNA-Seq (total of 26 patients). The distribution of MSI1 fold changes in tumor/control pairs for 26 individuals is plotted in red (intra-individual comparison). The distribution of MSI1 fold changes between control/control comparisons for 26 pairs of healthy individuals is plotted in grey (inter-individual comparison). B. Immunohistochemical staining for MSI1 in graded human colorectal cancer sections (scale=100µm). C. Immunofluorescence staining of Msi1 (red) in stem cells of the intestinal crypt costained for the crypt base columnar stem cell marker Lgr5 in Lgr5-eGFP-IRES-CreER knockin mice (green) (scale=50µm). D. Immunofluorescence for β-catenin and Msi1 in an adenoma resulting from APC LOH in the APCmin/+ mouse and normal villi adjacent to the adenoma (scale=100µm). E. Design of doxycycline (Dox)-inducible Msi1 knockin mice harboring a modified reverse tetracycline transactivator (M2rtTA) at the ROSA26 locus and the Msi1 cDNA under control of the tetracycline-responsive element-minimal CMV promoter (TRE/TetOP) targeted to safe-haven chromatin downstream of the Col1a1 locus. F. Immunofluorescence staining for Ki-67 marking proliferative cells in the intestinal crypts of control (M2rtTA) and TRE-Msi1 mice 48 hours after Dox induction. G. Alcian blue staining for goblet cell Mucin. H. Immunofluorescence staining for the enteroendocrine marker Chromogranin-A. (scale in F–H=100µm). I. Histological sections showing extension of crypt height and increased crypt fission in TRE-Msi1 mice (quantified at right, n=3 mice)(***: p<0.0005, Student’s t-test). J. A crypt undergoing fission in Lgr5-eGFP-IRES-CreER knockin mice costained for Msi1 (red) and GFP (green) (scale=50µm). See also Supplemental Figure 1.
Figure 2
Figure 2. Msi1 induction expands the progenitor cell compartment and drives APC loss and RNA metabolism gene expression programs
A. Msi1 induction in TRE-Msi1::Lgr5- eGFP-CreER mice results in an upward expansion of Lgr5-eGFP+ cells and an increase in the absolute frequency of Lgr5-eGFP+ cells, quantified by flow cytometry (right, n=3 mice per group, *p<0.05, Student’s t-test) (scale=50µm). B. TRE-Msi1 epithelium transformed by Dox induction for 48hrs revert to a phenotypically normal state persisting 2 months after Dox withdrawal (scale=100µm). C–D. In vitro culture of intestinal organoids derived from TREMsi1:: Lgr5-eGFP-CreER crypts followed by Dox induction in vitro. Crypt bud length is quantified in D (***: p<0.0005, Student’s t-test). E. Heatmap and hierarchical clustering of transcriptome profiles performed on the intestinal epithelium of 3 control (M2rtTA) and 3 TREMsi1 mice treated with Dox for 24 hours. F–H. Gene Set Enrichment Analysis (GSEA) of the TRE-Msi1 transcriptome identifies activation of genes induced by acute APC deletion in the intestinal epithelium (APC loss up) and suppression of genes downregulated after APC deletion (APC loss down) (F), along with an anti-correlation between the Msi1-induced transcriptome profile and the Peng_Rapamycin UP/DOWN gene sets (G), and an enrichment of expression of mRNA processing, ribosomal and translation factors upon Msi1 induction (H). FDR=False Discovery Rate. See also Supplemental Tables 1 and 2.
Figure 3
Figure 3. Msi1 and Msi2 have overlapping RNA-binding targets
A. Venn diagram showing the degree of overlap in gene expression changes driven by Msi1 versus Msi2 induction in transcriptome profiles of the TRE-Msi1 and TRE-Msi2 intestinal epithelium. B. Distribution of Msi1-RNA binding events for endogenous Msi1 in wildtype crypts (left) and induced Msi1 in TRE-Msi1 intestinal epithelium (right). C. Venn diagram showing the degree of overlap in Msi1 RNA binding targets wildtype crypts and in TRE-Msi1 intestinal epithelium. D. Msi1 binding motif identification and distribution in wildtype intestinal crypts. The fifth motif represents the motif previously identified by selex in vitro. E. Position of the canonical Msi1 recognition motif previously identified in vitro within CLIP-Seq reads containing that motif. F. PhastCons analysis of conservation of Msi1 binding sites in the indicated regions of Msi1 target transcripts. Error bars represent 95% confidence intervals *: p<0.05, **: p<0.005, ***: p<0.0005. G. Gene ontology analyses for biological processes and molecular functions that are significantly enriched in Msi1/TRE-Msi1 or Msi2/TRE-Msi2 CLIP datasets, as well as for gene sets common to both wildtype or ectopic Msi1 and Msi2, or targets unique to Msi1/TREMsi1 or Msi2/TRE-Msi2, as well as targets bound by an unrelated RNA binding protein Lin28b. H. Venn diagrams showing overlap in transcripts bound by endogenous Msi1 and Msi2 in wildtype crypts. See also Supplemental Figures 2–4, and Supplemental Tables 3–6.
Figure 4
Figure 4. Effects of Msi1 on Wnt pathway activity
A. CLIP-Seq tracks showing endogenous (WT) and ectopically induced Msi1 binding target transcripts. B. CLIP-qRT-PCR analysis of endogenous MSI1 binding to 3'UTRs of APC and CTNNB1 (β-CATENIN) in HEK293 cells in the absence (Ctrl) or presence of the GSK3β inhibitor CHIR99021 (CHIR) (n=3). ***: p< 0.0005, Student’s t-test. C. Luciferase reporter assays in HEK293 cells upon lentiviral shRNA-knockdown of MSI1 (using pSico) or MSI1 overexpression (using pcDNA), shown for constructs containing the CTNNB1 and NUMB 3’UTRs (n=3) (*: p<0.05, ***: p< 0.0005, Student’s t-test). D. Luciferase reporter assays in HCT116 cells for canonical Wnt pathway activation using the TOPflash reporter with multimerized β-catenin/TCF binding sites upstream of luciferase or the control FOPflash reporter with mutated binding sites and empty vector or MSI1 overexpression (n=3) (**: p<0.005, Student’s t-test). E. Immunofluorescence staining of APC protein in control (M2rtTA) and TRE-Msi1 mice 48 hours after dox administration (scale=100µm). F. Immunoblotting for APC in control (M2rtTA) and TRE-Msi1 epithelium. G. Immunohistochemical staining for transcriptionally active (nuclear) β-catenin in crypts of control (M2rtTA) and TRE-Msi1 transformed intestine (scale=100µm). H. Box plot showing expression levels of known direct β-catenin target genes (full gene list in methods) in total intestinal epithelium from control (M2rtTA) and TRE-Msi1 mice (n=3).
Figure 5
Figure 5. Msi1 functions through the PDK-Akt-mTORC1 axis
A. CLIP-Seq track showing Msi1 binding to the 3’UTR of the Pten tumor suppressor mRNA. B. Immunoblotting for Pten and S6 phosphorylation upon Msi1 induction in the intestinal epithelium. C. PTEN enzymatic activity measured by immunoprecipitation followed by ELISA upon knockdown of MSI1 in 293T cells (**: p< 0.005, Student’s t-test). D. Immunoblot analysis of the PI3K-AKT-mTORC1 pathway downstream of Pten in the intestinal epithelium of two control and two TRE-Msi1 mice treated with Dox for 24 hours. E. Immunofluorescence for phosphorylation of S6 by the mTORC1 target S6 kinase in control and TRE-Msi1 transformed intestinal epithelium (scale=200µm). F–H. Rapamycin treatment rescues TRE-Msi1-induced transformation of the intestinal epithelium. Mice treated with Rapamycin for 3 days prior to Dox administration exhibit decreased crypt fission (F) and a block in crypt height expansion (G) (*: p< 0.05, **: p< 0.005, ***: p< 0.0005, Student’s t-test). H. Immunofluorescence staining for Ki67 of Dox-induced TRE-Msi1 mice with or without Rapamycin treatment (scale=100µm). Brackets indicate the height of the crypt proliferative zone. See also Supplemental Figure 5.
Figure 6
Figure 6. MSI1 and MSI2 promote human colorectal cancer cell growth
A. Expression of MSI1 and MSI2 in three wildtype human colon biopsies and a panel of colorectal cancer cell lines, interrogated with two distinct primer sets for each MSI gene. HCT116 and HCT116 WT are the same cell line, procured from distinct sources (see methods). B. Growth of human colorectal cancer cell lines upon shRNA-knockdown of MSI1, MSI1 & MSI2, MSI1 & β-CATENIN, and MSI1&2 & β-CATENIN (**: p< 0.005, ***: p< 0.0005, Student’s t-test). C. Immunoblotting validating knockdown of MSI1 and transcriptionally active (nuclear) β-CATENIN in RKO and SW48 cells. Of note, β-CATENIN knockdown does not affect MSI1 levels, and MSI1 knockdown does not significantly affect nuclear β-CATENIN levels. See also Supplemental Figure 6.
Figure 7
Figure 7. MSI1/Msi1 and MSI2/Msi2 cooperate to promote tumor growth in vivo
A, B. Growth of RKO cell xenografts upon MSI or β-CATENIN shRNA knockdown (A), with tumors shown after dissection upon termination of the experiment (B). C, D. Growth of RKO cell xenografts upon combined knockdown of MSI proteins alone or with β-CATENIN knockdown (C), with tumors shown after dissection upon termination of the experiment (D). (**: p< 0.005, ***: p< 0.0005., Student’s t-test). E. Frequency of intestinal adenomas in APCmin/+ mice with or without deletion of Msi gene deletion in Msi1/2flox/flox::Villin-CreER::APCmin/+ mice (**: p< 0.005, Student’s t-test, n=5–6 mice per group). F. Representative immunofluorescence micrographs of residual tumors in Msi1/2flox/flox::Villin-CreER::APCmin/+ mice showing Msi1 (red), Msi2 (green), or Msi1/2 expression (scale=100µm). The graph at right depicts number of residual tumors in Msi1/2flox/flox::Villin-CreER::APCmin/+ that were either positive or negative for Msi immunoreactivity (100%, or 68/68 total residual tumors scored positive). G. Frequency of inflammation-driven colorectal adenomas/adenocarcinomas in mice treated with the AOMDSS protocol, with or without prior Msi gene deletion in Msi1/2flox/flox::Villin-CreER mice. (***: p< 0.0005, student’s t-test, n=6 mice per group). H. Photographs of distal colon resected from control (left) and Msi1/2 double knockout (right) mice at the end of the AOM-DSS protocol. I. Representative hematoxylin-eosin histological section of a colorectal adenocarcinoma resulting from AOM-DSS treatment in control mice (left). In contrast, mice lacking Msi gene function exhibited normal colon morphology after the AOM-DSS protocol (right) (scale=200µm). Supplemental Figure 7.

References

    1. Ahmed D, Eide PW, Eilertsen IA, Danielsen SA, Eknaes M, Hektoen M, Lind GE, Lothe RA. Epigenetic and genetic features of 24 colon cancer cell lines. Oncogenesis. 2013;2:e71. - PMC - PubMed
    1. Barker N, van Es JH, Kuipers J, Kujala P, van den Born M, Cozijnsen M, Haegebarth A, Korving J, Begthel H, Peters PJ, et al. Identification of stem cells in small intestine and colon by marker gene Lgr5. Nature. 2007;449:1003–1007. - PubMed
    1. Battelli C, Nikopoulos GN, Mitchell JG, Verdi JM. The RNA-binding protein Musashi-1 regulates neural development through the translational repression of p21WAF-1. Mol Cell Neurosci. 2006;31:85–96. - PubMed
    1. Cambuli FM, Correa BR, Rezza A, Burns SC, Qiao M, Uren PJ, Kress E, Boussouar A, Galante PA, Penalva LO, et al. A Mouse Model of Targeted Musashi1 Expression in Whole Intestinal Epithelium Suggests Regulatory Roles in Cell Cycle and Stemness. Stem cells. 2015 - PMC - PubMed
    1. Chi SW, Zang JB, Mele A, Darnell RB. Argonaute HITS-CLIP decodes microRNA-mRNA interaction maps. Nature. 2009;460:479–486. - PMC - PubMed

Publication types

MeSH terms

Substances