. 2015 May 4;13(1):dose-response.14-034.Socol.
doi: 10.2203/dose-response.14-034.Socol. eCollection 2015 Jan-Mar.

Atomic Bomb Survivors Life-Span Study: Insufficient Statistical Power to Select Radiation Carcinogenesis Model

Affiliations

Atomic Bomb Survivors Life-Span Study: Insufficient Statistical Power to Select Radiation Carcinogenesis Model

Yehoshua Socol et al. Dose Response. .

Abstract

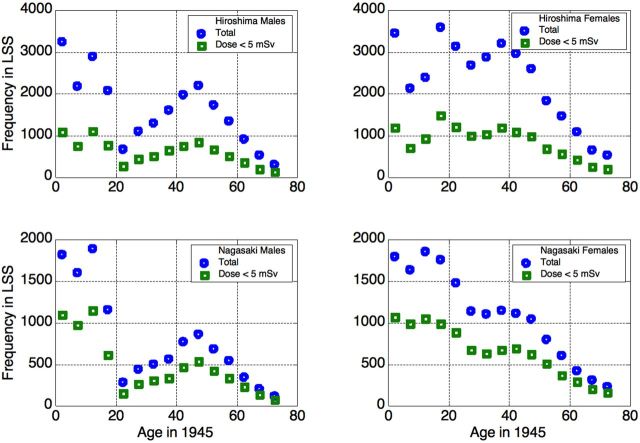
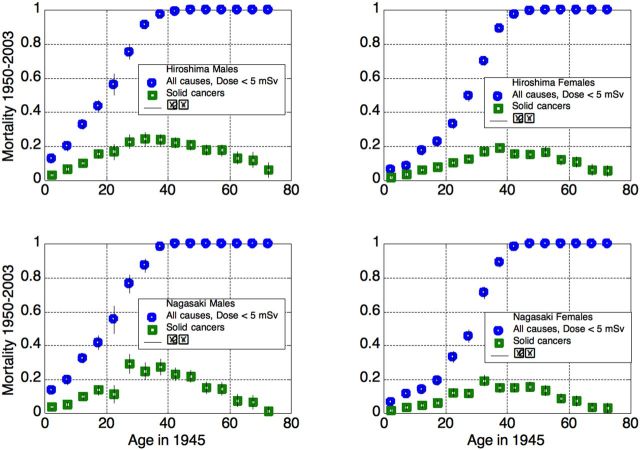
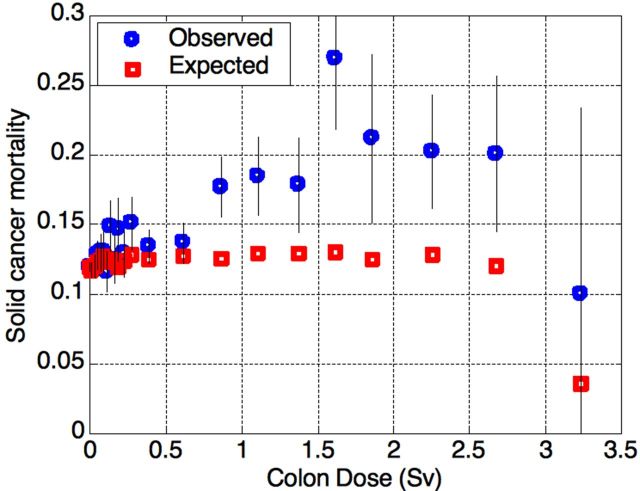
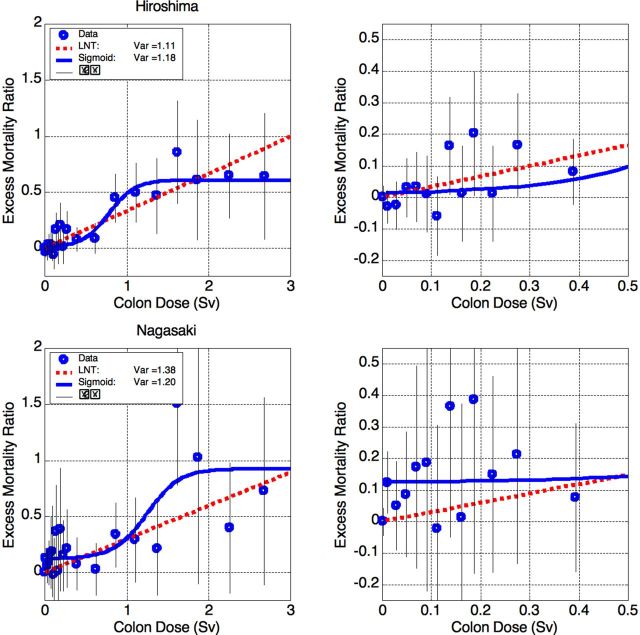
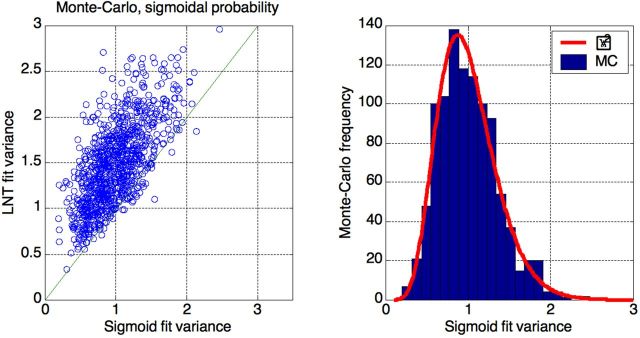
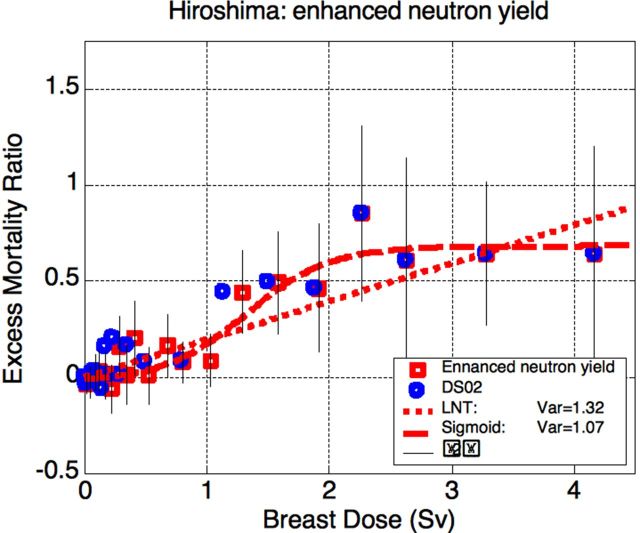
The atomic bomb survivors life-span study (LSS) is often claimed to support the linear no-threshold hypothesis (LNTH) of radiation carcinogenesis. This paper shows that this claim is baseless. The LSS data are equally or better described by an s-shaped dependence on radiation exposure with a threshold of about 0.3 Sievert (Sv) and saturation level at about 1.5 Sv. A Monte-Carlo simulation of possible LSS outcomes demonstrates that, given the weak statistical power, LSS cannot provide support for LNTH. Even if the LNTH is used at low dose and dose rates, its estimation of excess cancer mortality should be communicated as 2.5% per Sv, i.e., an increase of cancer mortality from about 20% spontaneous mortality to about 22.5% per Sv, which is about half of the usually cited value. The impact of the "neutron discrepancy problem" - the apparent difference between the calculated and measured values of neutron flux in Hiroshima - was studied and found to be marginal. Major revision of the radiation risk assessment paradigm is required.

Keywords: carcinogenesis; low-dose radiation; risk; threshold.


Figures

Figure 1.
Figure 1.
Age distributions in the LSS cohort: the entire cohort (squares) and survivors with dose < 5 mSv (circles).
Figure 2.
Figure 2.
Total and solid cancer mortality in unexposed or nearly-unexposed (up to 5 mSv) cohort members, 1950–2003.
Figure 3.
Figure 3.
Observed and expected solid cancer mortality (MR) in the LSS cohort, as a function of the exposure 1950-2003. The highest-dose category contains only 20 survivors, and was therefore excluded from the further analysis due to poor statistics.
Figure 4.
Figure 4.
Excess Mortality Ratio (EMR) for solid cancer mortality in Hiroshima and Nagasaki survivors. Left: full data, right: zoomed at low doses. Both functional descriptions – linear (LNTH) and sigmoidal (s-shaped) – yield nearly equal mismatch Var.
Figure 5.
Figure 5.
Excess Mortality Ratio (EMR) for all solid cancers in Hiroshima (top) and Nagasaki (bottom). Left: full data, right: zoomed at low doses. The data are described well by both LNTH and sigmoid. Nagasaki data are somewhat better described by the sigmoidal shape, but the difference is insignificant. The problem of 12% bias is addressed in the text.
Figure 6.
Figure 6.
Monte-Carlo simulations of the Hiroshima data fit by two curves (sigmoid and LNT). Left: sigmoidal (a priori) data are well-described a posteriori by LNT (y-axis: average Var ~ 1.5). The sigmoidal description is better (x-axis: average Var ~ 1), but dispersion of the fit quality is prohibitively high to exclude LNTH. Right: sigmoid fit variance distribution is well described by scaled χ2 function with 16 degrees of freedom.
Figure 7.
Figure 7.
Relative cancer risk (ERR or EMR) vs. dose (colon or breast). Ozasa et al. (2012) report excess solid cancer risk as ERR/(colon dose)=0.42 Sv–1 (42% per Sievert, red squares). For the same data, EMR/(breast dose) =0.24 Sv–1 (24% per Sievert, blue circles).
Figure 8.
Figure 8.
Breast vs. colon dose for the Hiroshima survivors. Infants: less than 3 years at exposure; children: 3–15 years.
Figure 9.
Figure 9.
Left: re-calculation of the breast dose with enhanced neutron yield. Right: resulting multiplication factor for the breast dose.
Figure 10.
Figure 10.
Results for increased neutron yield in Hiroshima. Breast dose is used for reference since colon is heavily shielded from neutrons by the body. The sigmoid yields somewhat better fit than LNTH, but the difference is insignificant. For the sigmoid model of carcinogenesis, effective threshold is at about 0.5 Sv (breast).

References

    1. Cullings HM, Levenson ZB, Funamoto S., Teranishi S. 2006. Changes in Atomic Bomb Survivors’ Dosimetry with the New Dosimetry System DS02. Jap. J. Health Phys. 41(4):261–271.
    1. Doss M. 2012. Evidence Supporting Radiation Hormesis in Atomic Bomb Survivor Cancer Mortality Data. Dose Response. 10:584–592 - PMC - PubMed
    1. Feinendegen LE, Pollycove M, Sondhaus CA. 2004. Responses to low doses of ionizing radiation in biological systems. Nonlinearity in Biol. Toxicol. Med. 2: 143–171 - PMC - PubMed
    1. Feinendegen LE, Pollycove M, Neumann RD. 2013. Hormesis by low dose radiation effects: Low-dose cancer risk modeling must recognize up-regulation of protection. In: Baum RP. (Ed.) Therapeutic Nuclear Medicine, Springer 2013, 500 p. ISBN 978-3-540-36718-5 - PMC - PubMed
    1. Fornalski KW, Dobrzyński L., Janiak MK. 2011. A Stochastic Markov Model of Cellular Response to Radiation, Dose-Response 9:477–496 - PMC - PubMed

LinkOut - more resources