

Daily transcriptome changes reveal the role of nitrogen in controlling microcystin synthesis and nutrient transport in the toxic cyanobacterium, Microcystis aeruginosa
- PMID: 26673568
- PMCID: PMC4681089
- DOI: 10.1186/s12864-015-2275-9
Daily transcriptome changes reveal the role of nitrogen in controlling microcystin synthesis and nutrient transport in the toxic cyanobacterium, Microcystis aeruginosa
Abstract
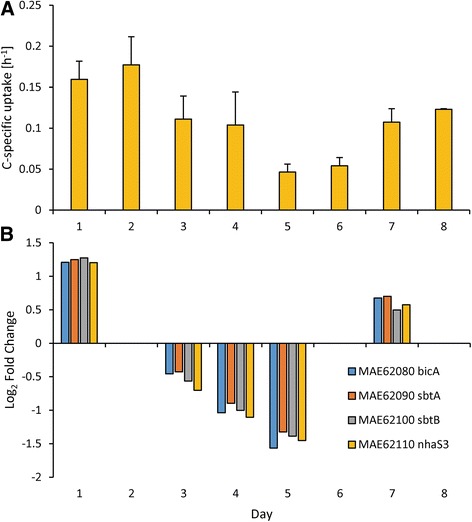
Background: While transcriptomics have become a valuable tool for linking physiology and ecology in aquatic microbes, the temporal dynamics of global transcriptomic patterns in Microcystis have rarely been assessed. Furthermore, while many microbial studies have explored expression of nutrient transporter genes, few studies have concurrently measured nutrient assimilation rates. Here, we considered how the global transcriptomic patterns and physiology of the cyanobacterium, Microcystis aeruginosa, changed daily as cells were grown from replete to deficient nitrogen (N) conditions and then back to replete conditions.
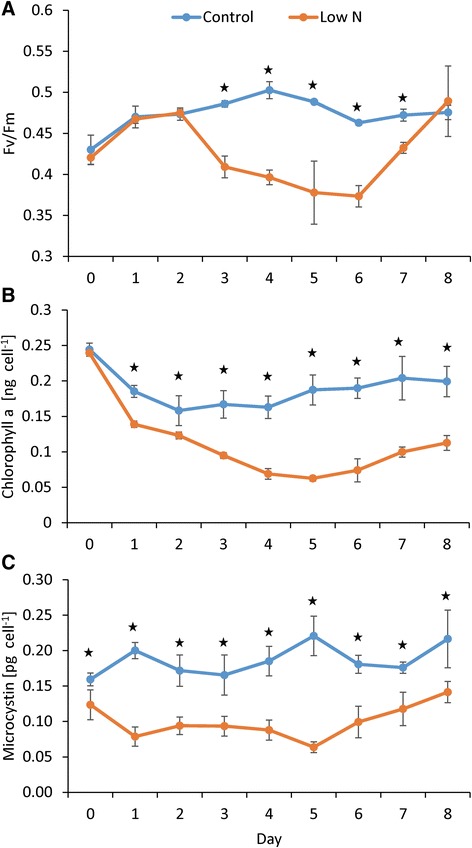
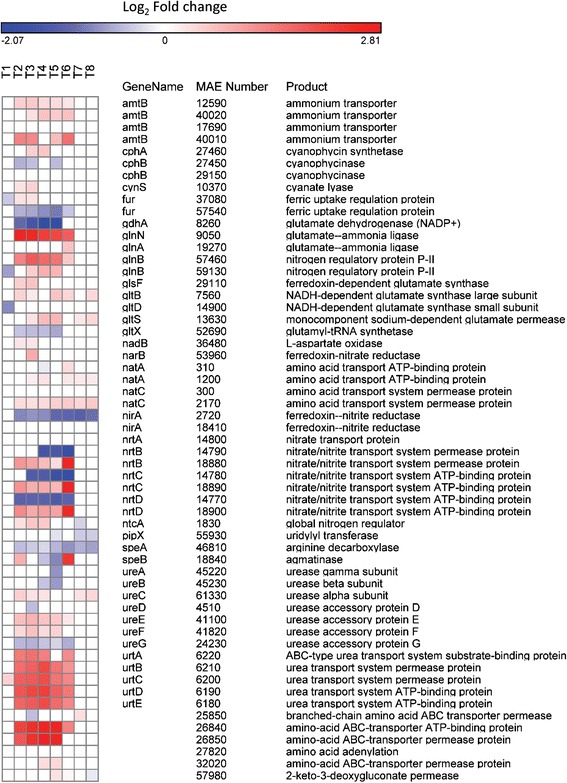
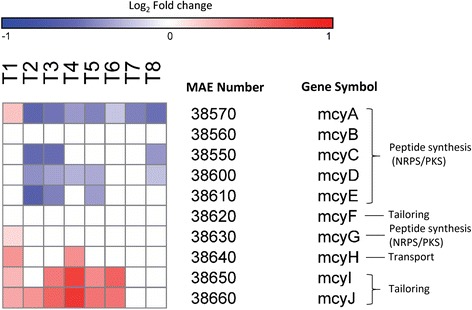
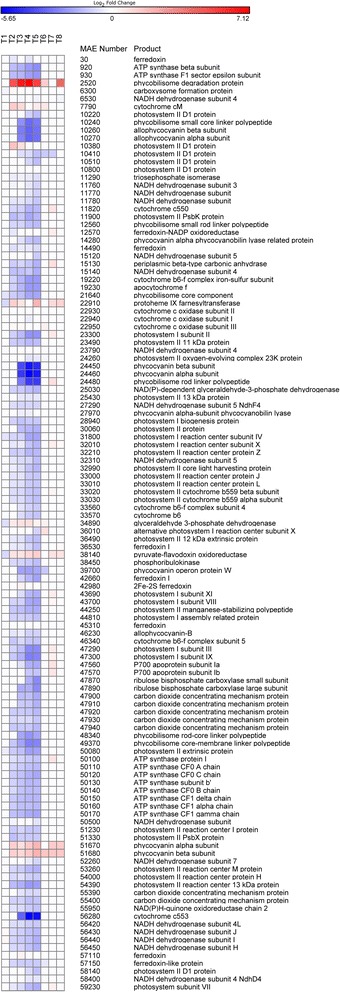
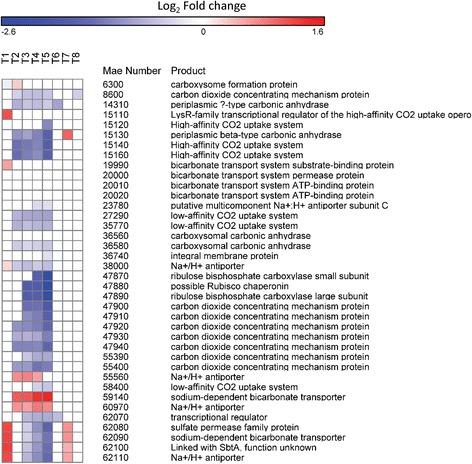
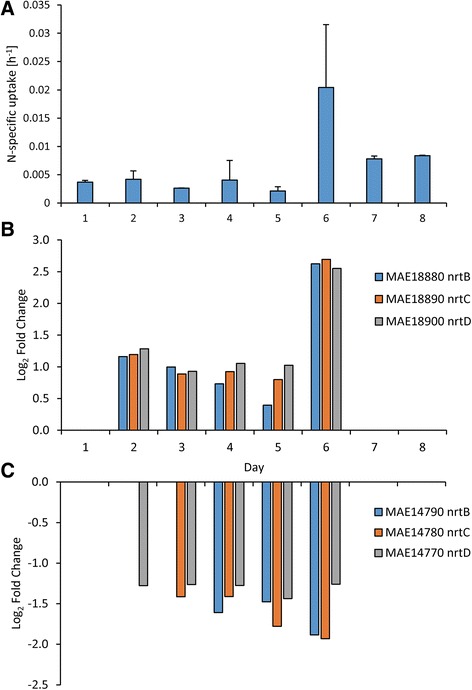
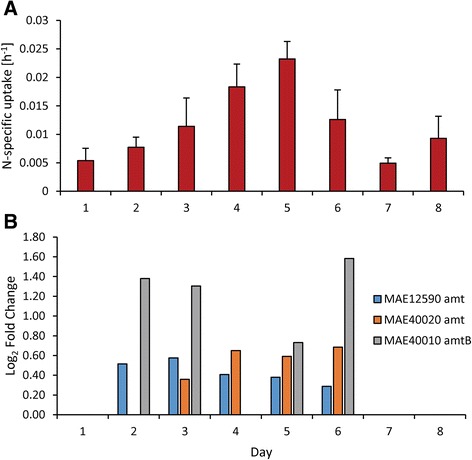
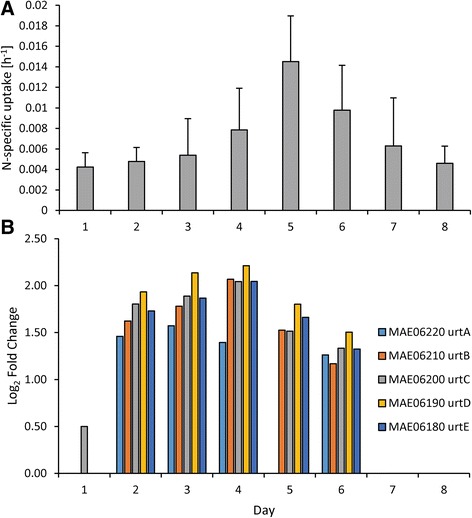
Results: During N deprivation, Microcystis downregulated genes involved in photosynthesis and respiration, carbon acquisition, lipid metabolism, and amino acid biosynthesis while upregulating genes involved in N acquisition and transport. With increasing N stress, both the strength of expression and number of genes being differentially expressed increased, until N was restored at which point these patterns reversed. Uptake of (15)N-labeled nitrate, ammonium and urea reflected differential expression of genes encoding transporters for these nutrients, with Microcystis appearing to preferentially increase transcription of ammonium and urea transporters and uptake of these compounds during N deprivation. Nitrate uptake and nitrate transporter expression were correlated for one set of transporters but not another, indicating these were high and low affinity nitrate transporters, respectively. Concentrations of microcystin per cell decreased during N deprivation and increased upon N restoration. However, the transcript abundance of genes involved in the synthesis of this compound was complex, as microcystin synthetase genes involved in peptide synthesis were downregulated under N deprivation while genes involved in tailoring and transport were upregulated, suggesting modification of the microcystin molecule under N stress as well as potential alternative functions for these genes and/or this toxin.
Conclusions: Collectively, this study highlights the complex choreography of gene expression, cell physiology, and toxin synthesis that dynamic N levels can elicit in this ecologically important cyanobacterium. Differing expression patterns of genes within the microcystin synthetase operon in response to changing N levels revealed the potential limitations drawing conclusions based on only one gene in this operon.
Figures
Similar articles
-
Transcriptional profiles of Microcystis reveal gene expression shifts that promote bloom persistence in in situ mesocosms.Microbiol Spectr. 2025 Jan 7;13(1):e0136924. doi: 10.1128/spectrum.01369-24. Epub 2024 Nov 18. Microbiol Spectr. 2025. PMID: 39555930 Free PMC article.
-
Global transcriptional responses of the toxic cyanobacterium, Microcystis aeruginosa, to nitrogen stress, phosphorus stress, and growth on organic matter.PLoS One. 2013 Jul 23;8(7):e69834. doi: 10.1371/journal.pone.0069834. Print 2013. PLoS One. 2013. PMID: 23894552 Free PMC article.
-
Evaluation of changes in Microcystis aeruginosa growth and microcystin production by urea via transcriptomic surveys.Sci Total Environ. 2019 Mar 10;655:181-187. doi: 10.1016/j.scitotenv.2018.11.100. Epub 2018 Nov 8. Sci Total Environ. 2019. PMID: 30469064
-
A review of the global ecology, genomics, and biogeography of the toxic cyanobacterium, Microcystis spp.Harmful Algae. 2016 Apr;54:4-20. doi: 10.1016/j.hal.2015.12.007. Harmful Algae. 2016. PMID: 28073480 Review.
-
Genome-wide reprogramming of primary and secondary metabolism, protein synthesis, cellular growth processes, and the regulatory infrastructure of Arabidopsis in response to nitrogen.Plant Physiol. 2004 Sep;136(1):2483-99. doi: 10.1104/pp.104.047019. Plant Physiol. 2004. PMID: 15375205 Free PMC article. Review.
Cited by
-
Quantification of microcystin production and biodegradation rates in the western basin of Lake Erie.Limnol Oceanogr. 2022 Jul;67(7):1470-1483. doi: 10.1002/lno.12096. Epub 2022 May 4. Limnol Oceanogr. 2022. PMID: 36248197 Free PMC article.
-
Nitrogen limitation, toxin synthesis potential, and toxicity of cyanobacterial populations in Lake Okeechobee and the St. Lucie River Estuary, Florida, during the 2016 state of emergency event.PLoS One. 2018 May 23;13(5):e0196278. doi: 10.1371/journal.pone.0196278. eCollection 2018. PLoS One. 2018. PMID: 29791446 Free PMC article.
-
Conserved Transcriptional Responses to Nutrient Stress in Bloom-Forming Algae.Front Microbiol. 2017 Jul 18;8:1279. doi: 10.3389/fmicb.2017.01279. eCollection 2017. Front Microbiol. 2017. PMID: 28769884 Free PMC article.
-
Transcriptional profiles of Microcystis reveal gene expression shifts that promote bloom persistence in in situ mesocosms.Microbiol Spectr. 2025 Jan 7;13(1):e0136924. doi: 10.1128/spectrum.01369-24. Epub 2024 Nov 18. Microbiol Spectr. 2025. PMID: 39555930 Free PMC article.
-
Evaluating putative ecological drivers of microcystin spatiotemporal dynamics using metabarcoding and environmental data.Harmful Algae. 2019 Jun;86:84-95. doi: 10.1016/j.hal.2019.05.004. Epub 2019 May 31. Harmful Algae. 2019. PMID: 31358280 Free PMC article.
References
-
- Hoagland P, Anderson DM, Kaoru Y, White AW. The economic effects of harmful algal blooms in the United States: Estimates, assessment issues, and information needs. Estuaries. 2002;25(4):819–837. doi: 10.1007/BF02804908. - DOI
-
- Carmichael W. A world overview - One-hundred-twenty-seven years of research on toxic cyanobacteria - Where do we go from here? In: Hudnell HK, editor. Cyanobacterial Harmful Algal Blooms: State of the Science and Research Needs. New York: Springer; 2008. - PubMed
-
- Carmichael WW. Health effects of toxin-producing cyanobacteria: “The CyanoHABs”. Human Ecol Risk Assess. 2001;7(5):1393–1407. doi: 10.1080/20018091095087. - DOI
-
- Orr PT, Jones GJ. Relationship between microcystin production and cell division rates in nitrogen-limited Microcystis aeruginosa cultures. Limnol Oceanogr. 1998;43(7):1604–1614. doi: 10.4319/lo.1998.43.7.1604. - DOI
Publication types
MeSH terms
Substances
LinkOut - more resources
Full Text Sources
Other Literature Sources
