. 2016 Apr 20;44(7):3131-46.
doi: 10.1093/nar/gkv1459. Epub 2015 Dec 15.

A transcription-independent epigenetic mechanism is associated with antigenic switching in Trypanosoma brucei

Affiliations

A transcription-independent epigenetic mechanism is associated with antigenic switching in Trypanosoma brucei

Francisco Aresta-Branco et al. Nucleic Acids Res. .

Abstract

Antigenic variation in Trypanosoma brucei relies on periodic switching of variant surface glycoproteins (VSGs), which are transcribed monoallelically by RNA polymerase I from one of about 15 bloodstream expression sites (BES). Chromatin of the actively transcribed BES is depleted of nucleosomes, but it is unclear if this open conformation is a mere consequence of a high rate of transcription, or whether it is maintained by a transcription-independent mechanism. Using an inducible BES-silencing reporter strain, we observed that chromatin of the active BES remains open for at least 24 hours after blocking transcription. This conformation is independent of the cell-cycle stage, but dependent upon TDP1, a high mobility group box protein. For two days after BES silencing, we detected a transient and reversible derepression of several silent BESs within the population, suggesting that cells probe other BESs before commitment to one, which is complete by 48 hours. FACS sorting and subsequent subcloning confirmed that probing cells are switching intermediates capable of returning to the original BES, switch to the probed BES or to a different BES. We propose that regulation of BES chromatin structure is an epigenetic mechanism important for successful antigenic switching.


Figures

Figure 1.
Figure 1.
BES transcriptional silencing precedes chromatin condensation during differentiation. (A) A bloodstream form cell-line that expressed VSG2 (BES1) was differentiated to procyclic forms by adding cis-aconitate to the medium and changing temperature from 37°C to 27°C. During differentiation, BES1 is silenced. Procyclic forms do not express VSG at the surface. Quantification of mRNA levels and (B) chromatin conformation (C) 6, 12 and 24 h after induction of differentiation. (B) Transcript levels were measured by qPCR and normalized to bloodstream form (BSF) levels and Tb927.10.12970 (56), a gene previously shown to maintain constant transcript levels during differentiation. Four to six independent experiments were analyzed. (C) DNA purified from FAIRE was quantified by qPCR and normalized to 18S as its transcript levels also remained constant throughout differentiation (23) and FAIRE signal was more intense than Tb927.10.12970. Three to five independent experiments were analyzed. (D) Comparison between transcript levels and FAIRE enrichment for VSG2 gene. Values were extracted from analysis in (B) and (C). Statistical significance was determined by one-way ANOVA with Bonferroni post-test comparison.. *P < 0.05; **P < 0.01; ***P < 0.001.
Figure 2.
Figure 2.
BES silencing causes growth delay and G2/M cell-cycle arrest but only after more than 8 h of induction. (A) In the bloodstream reporter cell-line, GLB1, removing tetracycline from the medium induces BES1 silencing and subsequent activation of another BES. Upper panel shows that in the presence of tetracycline, BES1 is actively transcribed. BES1 contains a tet operator sequence (TetO, black rectangle), GFP, luciferase and BSR genes downstream of the promoter. Lower panel shows the outcome of tetracycline removal: BES1 becomes silent (because tetracycline repressor (grey circle) binds TetO, sterically blocking Pol I transcription) and a new BES is activated. BSR, Blasticidin-S Resistance. (B) Growth curves of cells in the presence (Tet+, black curve) or after removal (Tet-, grey curve) of tetracycline. Four independent experiments were analyzed. (C) Cell-cycle profile of GLB1 at different time-points after removal of tetracycline. ‘Other’ represents cells with abnormal DNA content. Four independent experiments were analyzed. Statistical significance was determined by a two-way ANOVA with Bonferroni post-test comparison. *P < 0.05; ***P < 0.001. (D) Percentage of GLB1 cells that survive the BES silencing induction was determined by a clonogenic assay and normalized to Tet+ cells. Four independent experiments were analyzed. (E) Flow cytometry analysis of GFP expression of cells at 0 h (left panel) and 120 h (right panel) after tetracycline removal.
Figure 3.
Figure 3.
BES chromatin retains an open conformation despite its transcription being reduced 90%. (A) % of luciferase activity of Tet- relative to Tet+ cells after 0, 2, 5 and 8 h of tetracycline removal. Curve represents the best decay fit for time-points 2, 5 and 8 h. Five to seven independent experiments were analyzed for each time-point. (B) % of mRNA levels after 8 h of tetracycline removal relative to Tet+ cells, measured by qPCR and normalized to GAPDH transcripts. Five independent experiments were analyzed. (C) Chromatin conformation was measured by FAIRE at 0, 5, 8 h and 6 days after tetracycline removal. DNA isolated by FAIRE was quantified by qPCR and normalized to gDNA copy number and GAPDH. Three independent experiments were analyzed. Statistical significance was determined by one-way ANOVA with Bonferroni post-test comparison. (D) Nucleosome occupancy was determined by histone H3 ChIP at 0 and 8 h after tetracycline removal. Immunoprecipitated DNA was compared to the total input material. Three independent experiments were analyzed. Statistical significance was determined by a paired t-test against time-point 0 h. *P < 0.05; **P < 0.01; ***P < 0.001.
Figure 4.
Figure 4.
Chromatin conformation of BESs is cell-cycle independent. (A) Nuclear DNA of GLB1 cells was stained by FxCycle Violet and sorted by flow cytometry in G1 (red), S (orange) and G2/M (blue) cell-cycle stages. Panel in grey represents original population, colored panels represent analysis of post-sorted populations. (B) Chromatin conformation of the three cell-cycle populations was measured by FAIRE. DNA isolated by FAIRE was quantified by qPCR and normalized to gDNA copy number and GAPDH. Three independent experiments were analyzed. Statistical significance was determined by a 1-way ANOVA with Bonferroni post-test comparison.
Figure 5.
Figure 5.
When active BES is silenced, TDP1 keeps its chromatin open. (A) TDP1 ChIP at 0, 8 h and 6 days after tetracycline removal in GLB1-TDP1::TY1, a cell-line in which one endogenous allele of TDP1 is fused with a TY1 tag. Immunoprecipitated DNA was compared to the total input material and normalized to 18S DNA. Statistical significance was determined by a one-way ANOVA with Bonferroni post-test comparison. Three independent experiments were analyzed. (B) Western blotting analysis of TDP1 protein after 3, 24, 48 and 72 h of transfection with buffer (mock) or anti-TDP1 dsRNA in GLB1-TDP1::3xcMyc, a cell-line in which one endogenous allele of TDP1 is fused with a triple c-MYC tag that is more sensitive for western blot. Time-point 0 h indicates mock control cells transfected only with buffer. Each lane corresponds to lysates from 2 × 10⁶ cells. Quantification of TDP1 signal is indicated in the lower panel. TDP1 protein levels were normalized for H2A protein levels and mock control. Four independent experiments were analyzed. (C) Chromatin conformation of GLB1-TDP1::3xcMyc cells after 5 h of BES silencing (24 h of TDP1 depletion) was measured by FAIRE. DNA isolated by FAIRE was quantified by qPCR and normalized to gDNA copy number and to GAPDH. Four independent experiments were analyzed. Statistical significance was determined by an unpaired t-test comparing Tet- to Tet+ in each condition (Mock or TDP1 KD). (D) Ratio of FAIRE enrichment (calculated from data in panel C) between Tet- and Tet+ for Mock and TDP1 KD conditions. Statistical significance was determined by an unpaired t-test. *P < 0.05; ***P < 0.001.
Figure 6.
Figure 6.
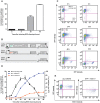
Cells transcriptionally probe silent BESs for up to two days, when most cells are committed to switching. (A) Commitment assay. 8, 24 or 48 h after inducing BES silencing, tetracycline was added back to the medium and cells were cloned. Six days later FACS was used to assess if clones were GFP-positive, indicating re-expression of original BES1. A minimum of 95 total individual wells was analyzed for each time-point between five individual experiments. (B) The cell-line GLB1-R15 is a derivative of GLB1, in which the fused gene RFP::NPT was introduced downstream the promoter of a silent BES. NPT, Neomycin Phosphotransferase. (C) Representative examples of FACS plots at several time-points post-BES silencing showing GFP and RFP expression (see Supplementary Figure S5 for complete set of time points). (D) Proportion of probing cells was assessed by measuring number of cells expressing RFP at intermediate levels and still present high levels of GFP (black line, left Y axis); switchers were defined as GFP-negative cells and either RFP- or RFP+ (blue and orange lines, respectively, right Y axis) after tetracycline removal. Three independent experiments were analyzed. Circled 1,2 and 3 labels indicate the sorted populations described in Figure 7. (E) Left panel - Representative example of a FACS plot at 24 h post-BES silencing showing VSG13 and GFP expression. Right panel - Representative example of a FACS plot showing VSG13 and RFP expression in the cells present on the top right gate in left panel. Four independent experiments were analyzed.
Figure 7.
Figure 7.
Probing cells are switching intermediates that can choose different fates. (A) Experimental design of FACS sorting and subsequent phenotype characterization. Tetracycline was removed from the medium of GLB1-R15 cell-line. One day later, two populations 1 and 2 (indicated in Figure 6C) were sorted and plated by limiting dilution. Population 1 consists of cells that express GFP and RFP, while population 2 consists of cells that express GFP, but not RFP. As control, a third population of GFP+/RFP- cells was sorted from a culture kept under tetracycline pressure. Clones obtained after six days were characterized in terms of expression of GFP and RFP by FACS. (B) GFP and RFP expression of surviving clones was assessed by FACS. Numbers in white show mean number of clones with each specific phenotype from three individual experiments. (C) Chromatin conformation of GLB1-R15 cells after 24 h of BES silencing was measured by FAIRE. DNA was quantified by qPCR and normalized to gDNA copy number and to GAPDH at 0 h. Statistical significance was determined by a paired t-test against time-point 0 h. *P < 0.05; ***P < 0.001.
Figure 8.
Figure 8.
Model for VSG expression site switching: transcriptional probing silent BESs before commitment is associated to a temporary maintenance of open chromatin by TDP1. Chromatin of the actively transcribed BES possesses an open chromatin enriched in TDP1. Upon transcriptional silencing of the active BES, cells undergo an intermediate state characterized by stabilization of the active BES open chromatin by TDP1 while probing silent BESs. Commitment to switch or not switch seems to take around two days. This decision can either be returning to the initial active BES (which, in our reporter cell-line, because BES1 is blocked by tetracycline repressor, it would result in cell death) or switching to a new BES. In this later case, the chromatin of the originally active BES loses TDP1 and becomes nucleosome-enriched.

References

    1. Warner J.R. The economics of ribosome biosynthesis in yeast. Trends Biochem. Sci. 1999;24:437–440. - PubMed
    1. McStay B., Grummt I. The epigenetics of rRNA genes: from molecular to chromosome biology. Annu. Rev. Cell Dev. Biol. 2008;24:131–157. - PubMed
    1. Wittner M., Hamperl S., Stockl U., Seufert W., Tschochner H., Milkereit P., Griesenbeck J. Establishment and maintenance of alternative chromatin states at a multicopy gene locus. Cell. 2011;145:543–554. - PubMed
    1. Figueiredo L.M., Cross G.A., Janzen C.J. Epigenetic regulation in African trypanosomes: a new kid on the block. Nat. Rev. Microbiol. 2009;7:504–513. - PubMed
    1. Gunzl A., Bruderer T., Laufer G., Schimanski B., Tu L.C., Chung H.M., Lee P.T., Lee M.G. RNA polymerase I transcribes procyclin genes and variant surface glycoprotein gene expression sites in Trypanosoma brucei. Eukaryot. Cell. 2003;2:542–551. - PMC - PubMed

Publication types

MeSH terms