. 2016 Jan 12;7(2):1838-53.
doi: 10.18632/oncotarget.6550.

A versatile ex vivo technique for assaying tumor angiogenesis and microglia in the brain

Affiliations

A versatile ex vivo technique for assaying tumor angiogenesis and microglia in the brain

Ali Ghoochani et al. Oncotarget. .

Abstract

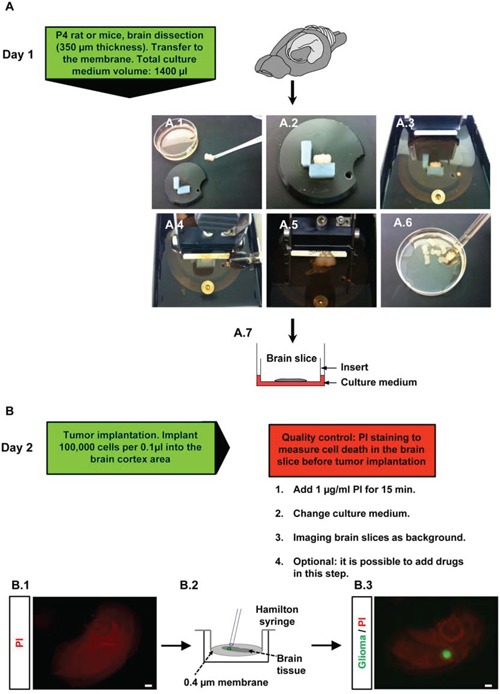
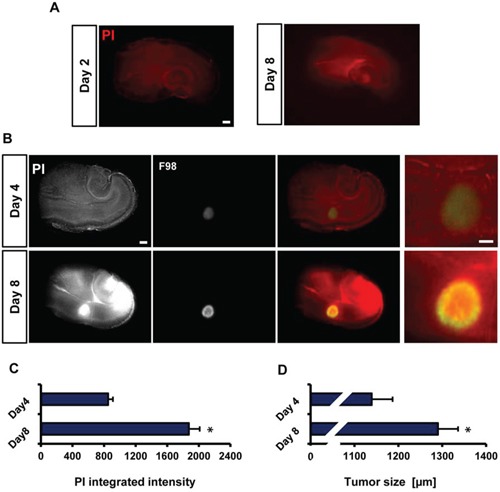
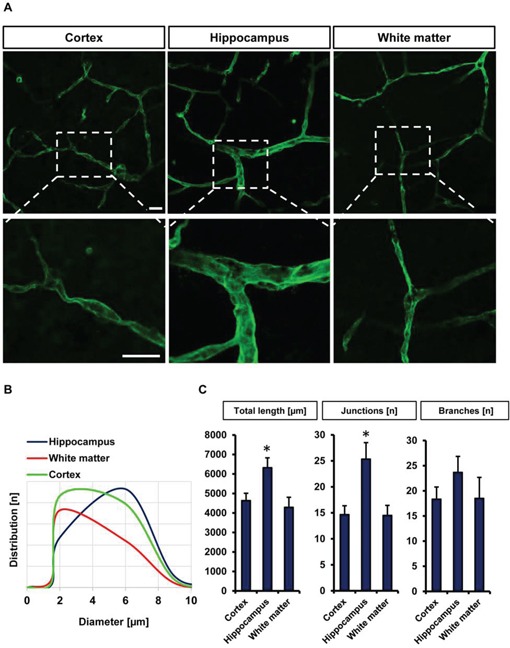
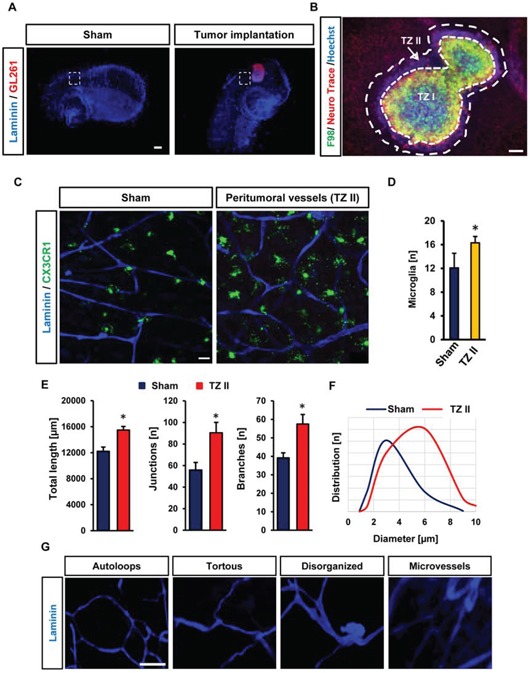
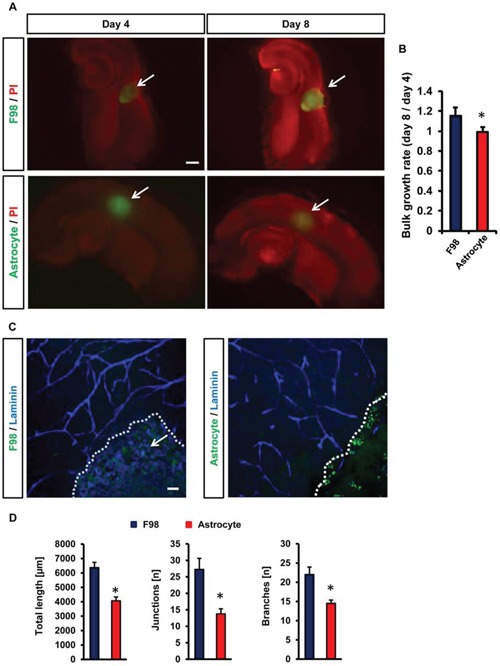
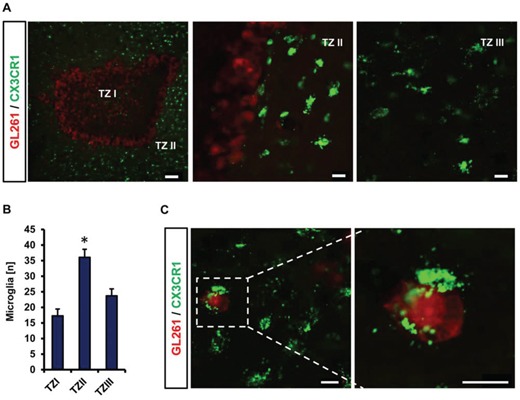
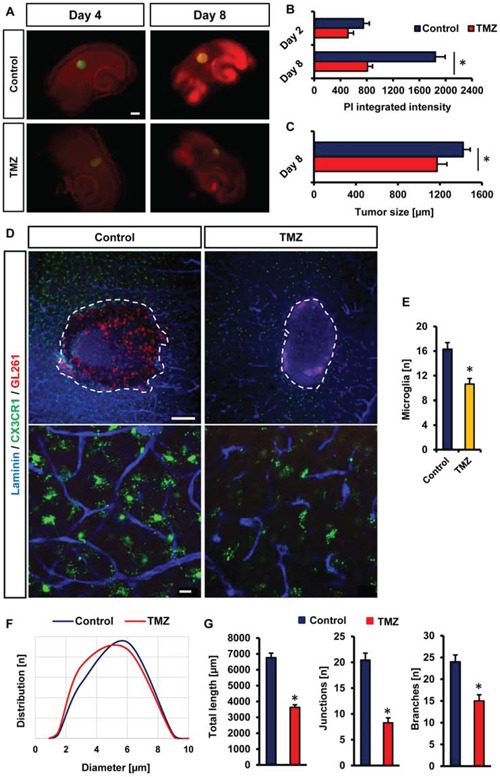
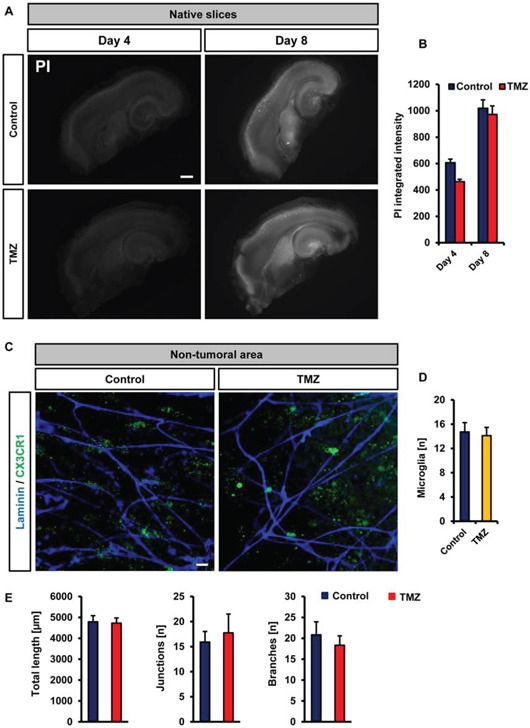
Primary brain tumors are hallmarked for their destructive activity on the microenvironment and vasculature. However, solely few experimental techniques exist to access the tumor microenvironment under anatomical intact conditions with remaining cellular and extracellular composition. Here, we detail an ex vivo vascular glioma impact method (VOGIM) to investigate the influence of gliomas and chemotherapeutics on the tumor microenvironment and angiogenesis under conditions that closely resemble the in vivo situation. We generated organotypic brain slice cultures from rats and transgenic mice and implanted glioma cells expressing fluorescent reporter proteins. In the VOGIM, tumor-induced vessels presented the whole range of vascular pathologies and tumor zones as found in human primary brain tumor specimens. In contrast, non-transformed cells such as primary astrocytes do not alter the vessel architecture. Vascular characteristics with vessel branching, junctions and vessel meshes are quantitatively assessable as well as the peritumoral zone. In particular, the VOGIM resembles the brain tumor microenvironment with alterations of neurons, microglia and cell survival. Hence, this method allows live cell monitoring of virtually any fluorescence-reporter expressing cell. We further analyzed the vasculature and microglia under the influence of tumor cells and chemotherapeutics such as Temozolamide (Temodal/Temcad®). Noteworthy, temozolomide normalized vasculare junctions and branches as well as microglial distribution in tumor-implanted brains. Moreover, VOGIM can be facilitated for implementing the 3Rs in experimentations. In summary, the VOGIM represents a versatile and robust technique which allows the assessment of the brain tumor microenvironment with parameters such as angiogenesis, neuronal cell death and microglial activity at the morphological and quantitative level.

Keywords: angiogenesis; ex vivo; glioblastoma; neuronal cell death; slice culture.


Conflict of interest statement

CONFLICTS OF INTEREST

The authors declare no competing financial conflict of interests.

Figures

Figure 1
Figure 1. Flowchart and procedure of the VOGIM protocol
A. Day 1: Isolation of brain tissue and brain dissection (‘slicing’). Green box gives hand-on details of this experimental step. A.1. Transfer of trimmed brain tissue to fit onto the specimen disc. A.2-3. Fixation of the trimmed brain on the specimen disc, afterwards it is placed into buffer chamber filled with cold preparation medium. A.4-5. Sectioning horizontal brain slices in 350 μm thickness. A.6. Collection of brain slices with large blunted Pasteur pipette in petri dish filled with cold preparation medium. A.7. Transfer of brain slices onto a 0.4 μm pore-size transwell membrane insert which is placed into a six well plate filled with 1400 μl culture medium. B. Day 2: tumor implantation step, green and red boxes indicate details and give quality control checkpoints of experimental steps. B.1. PI staining and intensity measurement in the brain slices before tumor implantation to evaluate quality. B.2. Tumor implantation method is presented. Implantation of 100,000 cells per 0.1 μl into the cortex area with a Hamilton syringe (one μl capacity). B.3. Fluorescence microscopic images for the evaluation of invaded tumor cells into brain slice. Scale bar represents 500 μm.
Figure 2
Figure 2. Visualization of tumor growth and cell death in the VOGIM protocol
A. Representative fluorescence images for PI staining of brain slices to detect cell death after 8 days in culture. Scale bar represents 500 μm. B. Representative fluorescence images monitoring tumor growth (green) and cell death (PI) at day 4 and day 8. Scale bar represents 500 μm. C. Quantification of cell death (PI intensity quantification) at day 4 and 8 (n = 9). D. Quantification of tumor size measurements on day 4 and 8 (n = 9). Scale bar represents 500 μm. Statistical analysis was performed with Student's t-test (*P < 0.05, mean is given ± s.e.m.).
Figure 3
Figure 3. Visualization and quantification of the vasculature in different brain slice areas
A. Cortex, hippocampus and white matter were candidate to monitor vascularization in different bran slice areas. Laminin antibody was utilized to stain vessels. Scale bar represents 20 μm. B. Distribution of vessels diameter (μm) in cortex, hippocampus and white matter (n = 6). C. Quantification of different vascular parameters total vessels length, number of junctions and branches with Image J Angiogenesis tools plugin. Images with 314 μm × 314 μm size were used for quantification. Statistical analysis was performed with Student's t-test (*P < 0.05, error bars represent mean ± s.e.m.).
Figure 4
Figure 4. Visualization and quantification of tumor angiogenesis and microglia
A. CX3CR1-GFP mouse brain slices were utilized to implant RFP expressing murine glioma cells (GL261). For control samples, we implanted only medium at the same position and in the same manner as tumor was implanted. White squares display peritumoral positions or peri-injection area in sham operated slices which were quantified. Scale bar represents 500 μm. B. Representative image displaying cell death and tumor zones in the VOGIM. Cell nuclei staining is shown in blue (stained with Hoechst 33258), tumor (green) and neurons (red) are given. Arrow indicates the typical breaking-up of neuronal cell structures in the peritumoral zone (TZ II). The tumor bulk is also termed as Tumor Zone I (TZ I). Scale bar represents 100 μm. C. Vascularization in peritumoral area (TZ II). Vessels are stained for Laminin (blue). GFP positive (CX3CR1-GFP mice) cells represent perivascular microglia. Scale bar represents 20 μm. D. Number of perivascular microglial cells in TZ II in comparison to sham. Images with 288 μm × 288 μm size were used for quantification. E. Quantification of vessel parameters: total length, number of junctions and branches in peritumoral area (TZ II) versus sham operated brain slices. Images with 570 μm × 570 μm size were used for quantification (n = 6). F. Distribution of vessels diameter (μm) in TZ II and sham (n = 6). G. Images represent tan assembly of pathological tumor vessels found in the VOGIM. Scale bars is given as 40 μm. Statistical analysis was performed with Student's t-test (*P < 0.05, error bars represent mean ± s.e.m.).
Figure 5
Figure 5. Vascular and cellular response after non-transformed cell implantation in VOGIM
A. PI staining (red) and GFP positive area to monitor cell death and tumor growth respectively in brain slices (top) in comparison to astrocytes cell implantation (bottom). Given are cell growth at day 4 and 8. Arrows indicate tumor bulk. Scale bar represents 500 μm. B. Quantification of bulk cell growth area of gliomas (F98) and primary astrocytes in brain slices. C. Vascularization in peritumoral area (TZ II). Vessels are stained for Laminin (blue). Glioma cells (F98, left) or astrocytes (right) are displayed in green and cell growth is indicated by the white dotted line. Arrows indicate intra-tumoral vessels in glioma-implanted brains. Scale bar represents 50 μm. D. Quantification of vessel length, junctions and branches in glioma implanted slices (green) and astrocytes-implanted brain slices (green). Images with 288 μm × 288 μm size were used for quantification. Statistical analysis was performed with Student's t-test (*P < 0.05, error bars represent mean ± s.e.m, n = 6).
Figure 6
Figure 6. Microglia distribution and interaction in different tumor zones
A. Distribution of microglial cells (green) located in tumor zone I, II and III. RFP stable expressing GL261 (red) were implanted into CX3CR1-GFP positive brain slices. TZ I represents the tumor bulk, TZ II indicates the peritumoral zone and TZ III is the area distant to TZ I. Scale bar represents 100 μm (for left), 20 μm for middle and right images. B. Quantification of the number of microglial cells in different tumor zones. Images with 710 μm × 710 μm size were utilized for quantification. Statistical analysis was performed with Student's t-test (*P < 0.05, error bars represent mean ± s.e.m, n = 4). C. Representative image displaying interaction of microglia with glioma cells. Scale bar represents 20 μm.
Figure 7
Figure 7. Analysis the drug sensitivity of VOGIM method
A. PI staining (red) and GFP positive area (green) monitors cell death and tumor growth respectively in brain slices treated with temozolamide (TMZ, 100 μM). Untreated brain slices served as control samples and analysis was performed on day 4 and 8. Scale bar displays 500 μm. B. Quantification of cell death after temozolamide (TMZ) treatment in comparison to untreated control samples on day 4 and 8. C. Quantification of tumor growth after temozolamide (TMZ) treatment in comparison to untreated controls at day 8. D. Peritumoral (TZ II) vascularization of TMZ treated brain slices (CX3CR1-GFP positive) and untreated controls. Laminin staining (blue) was utilized for vessel visualization. Microglial cells are displayed in green. Scale bar in top images represents 200 μm, scale bar in bottom images shows 20 μm. E. Quantification of the numbers of perivascular microglial cells in peritumoral area (TZ II) of temozolomide (TMZ) treated and untreated tumor-implanted brain slices. Images with 288 μm × 288 μm size were used for quantification. F. Distribution of vessel diameters (μm) in peritumoral areas after temozolomide (TMZ) treatment and in untreated controls. G. Quantification of vessel length, junctions and branches in glioma implanted untreated slices and temozolomide treated brain slices. Statistical analysis was performed with Student's t-test (*P < 0.05, error bars represent mean ± s.e.m, n = 6).
Figure 8
Figure 8. Vascular and cellular response after temozolomide treatment in VOGIM
A. Cell death monitoring (PI staining, white signal) in native slices under untreated control conditions (top) and after temozolomide (TMZ, 100 μM) treatment (bottom). Given is cell death at day 4 and day 8. Scale bar represents 500 μm. B. Quantification of cell death in brain slices after temozolomide (TMZ, 100 μM) treatment. Untreated controls are displayed in blue, TMZ treated group is given in red. C. Vascularization and microglial distribution of brain areas after temozolomide (TMZ) treatment. Vessels are stained for Laminin (blue) and microglial cells are displayed in green. Scale bar represents 20 μm. D. Quantification of the numbers of perivascular microglial cells after temozolomide (TMZ) treatment and in untreated (control) brain slices. E. Quantification of vessel length, junctions and branches in brain slices treated with temozolomide (TMZ) or untreated (control). Images with 288 μm × 288 μm size were used for quantification. Statistical analysis was performed with Student's t-test (*P < 0.05, error bars represent mean ± s.e.m, n = 6).

Similar articles

Cited by

References

    1. Carmeliet P, Tessier-Lavigne M. Common mechanisms of nerve and blood vessel wiring. Nature. 2005;436:193–200. - PubMed
    1. Hick S, Fan Z, Buchfelder M, Eyupoglu IY, Savaskan N. Brain Tumor-Induced Angiogenesis: Approaches and Bioassays. In: Lichtor Terry., editor. Evolution of the Molecular Biology of Brain Tumors and the Therapeutic Implications. 2013. ISBN: 978-953-51-0989-1, InTech, Available from: http://wwwintechopencom/books/evolution-of-the-molecular-biology-of-brai.... - DOI
    1. Bennett J, Basivireddy J, Kollar A, Biron KE, Reickmann P, Jefferies WA, McQuaid S. Blood-brain barrier disruption and enhanced vascular permeability in the multiple sclerosis model EAE. J Neuroimmunol. 2010;229:180–91. - PubMed
    1. Croll SD, Goodman JH, Scharfman HE. Vascular endothelial growth factor (VEGF) in seizures: a double-edged sword. Adv Exp Med Biol. 2004;548:57–68. - PMC - PubMed
    1. Ujiie M, Dickstein DL, Carlow DA, Jefferies WA. Blood-brain barrier permeability precedes senile plaque formation in an Alzheimer disease model. Microcirculation. 2003;10:463–70. - PubMed

Publication types

MeSH terms