. 2015 Dec 16;10(12):e0145211.
doi: 10.1371/journal.pone.0145211. eCollection 2015.

Coxiella burnetii Phagocytosis Is Regulated by GTPases of the Rho Family and the RhoA Effectors mDia1 and ROCK

Affiliations

Coxiella burnetii Phagocytosis Is Regulated by GTPases of the Rho Family and the RhoA Effectors mDia1 and ROCK

Romina P Salinas et al. PLoS One. .

Abstract

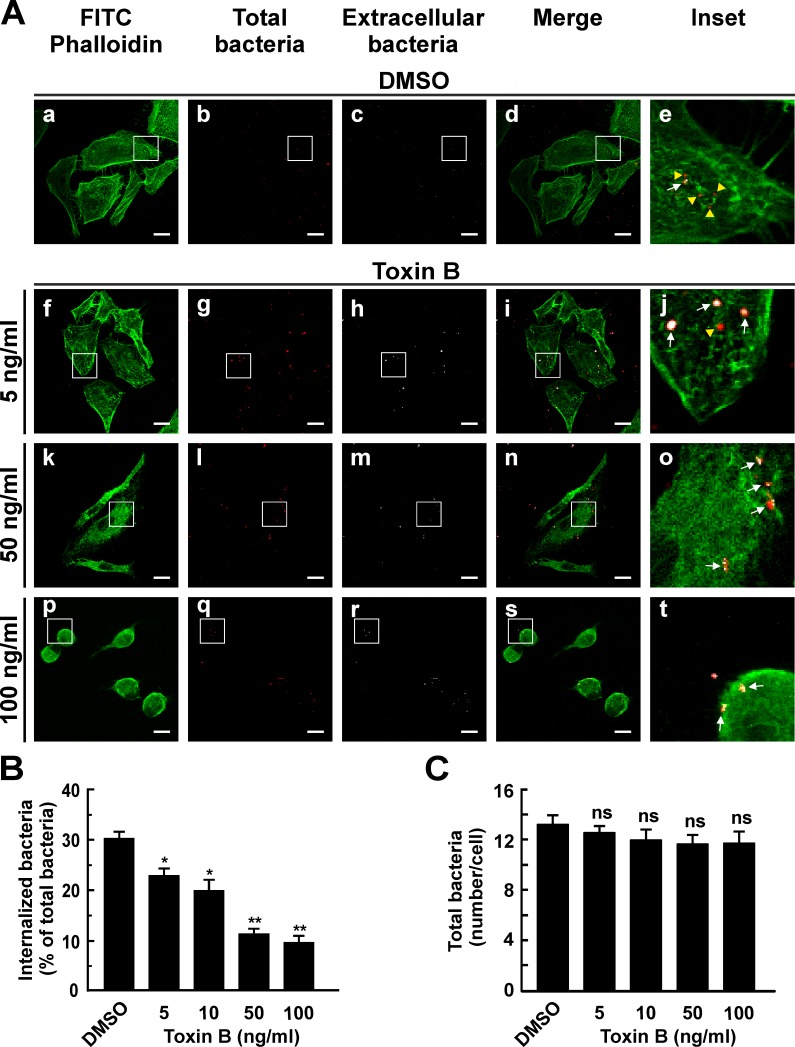
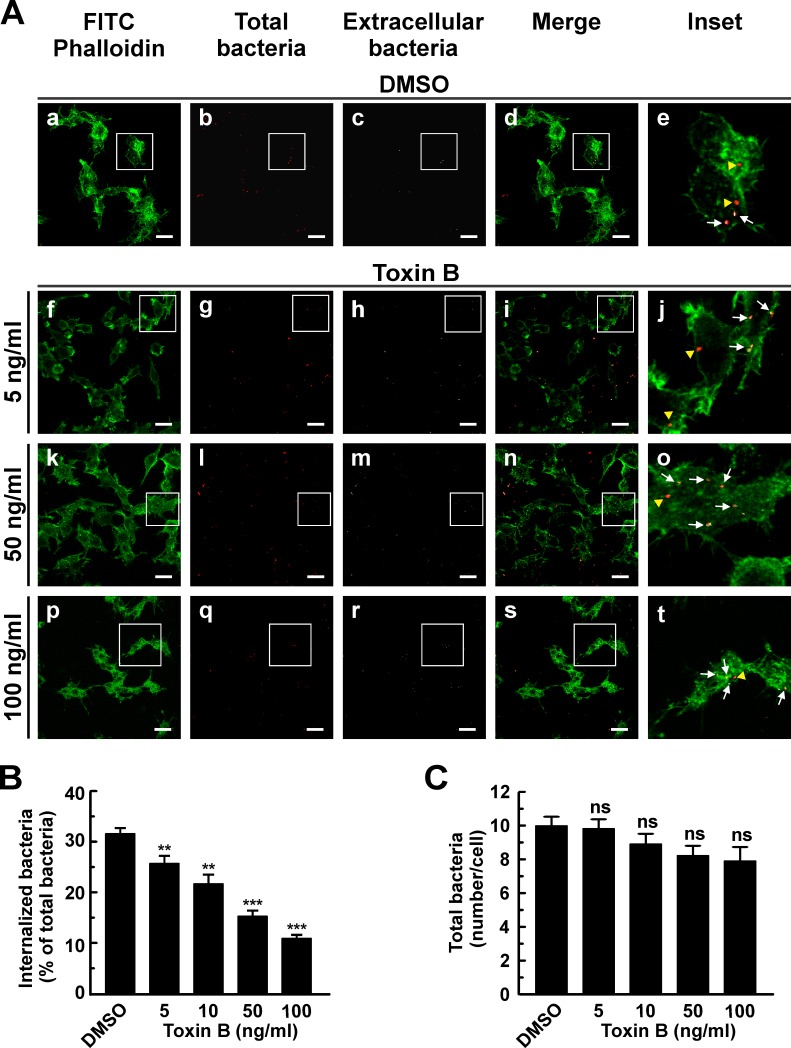
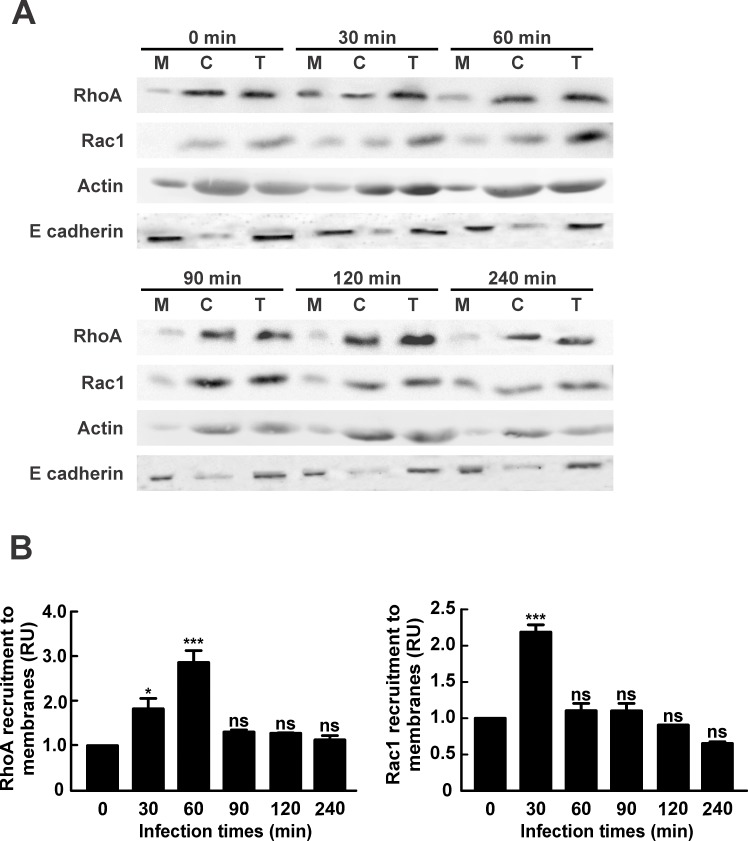
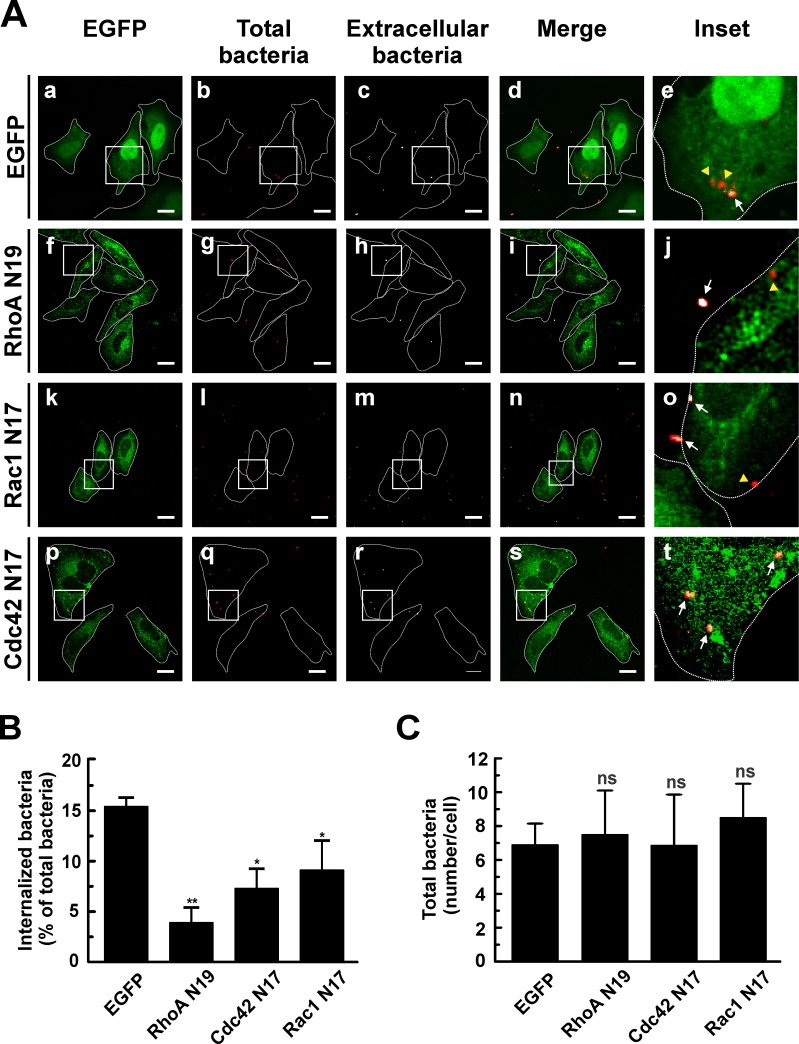
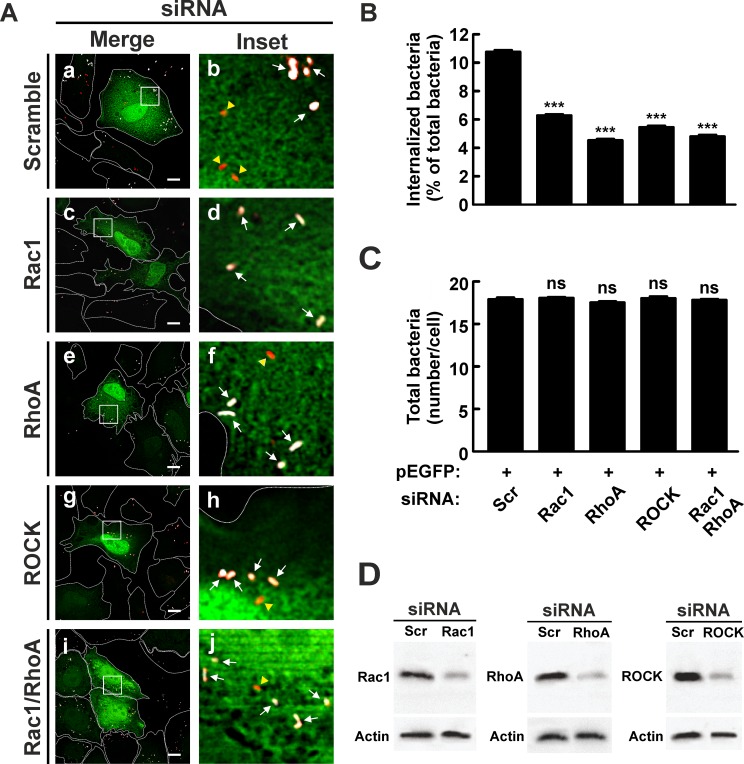
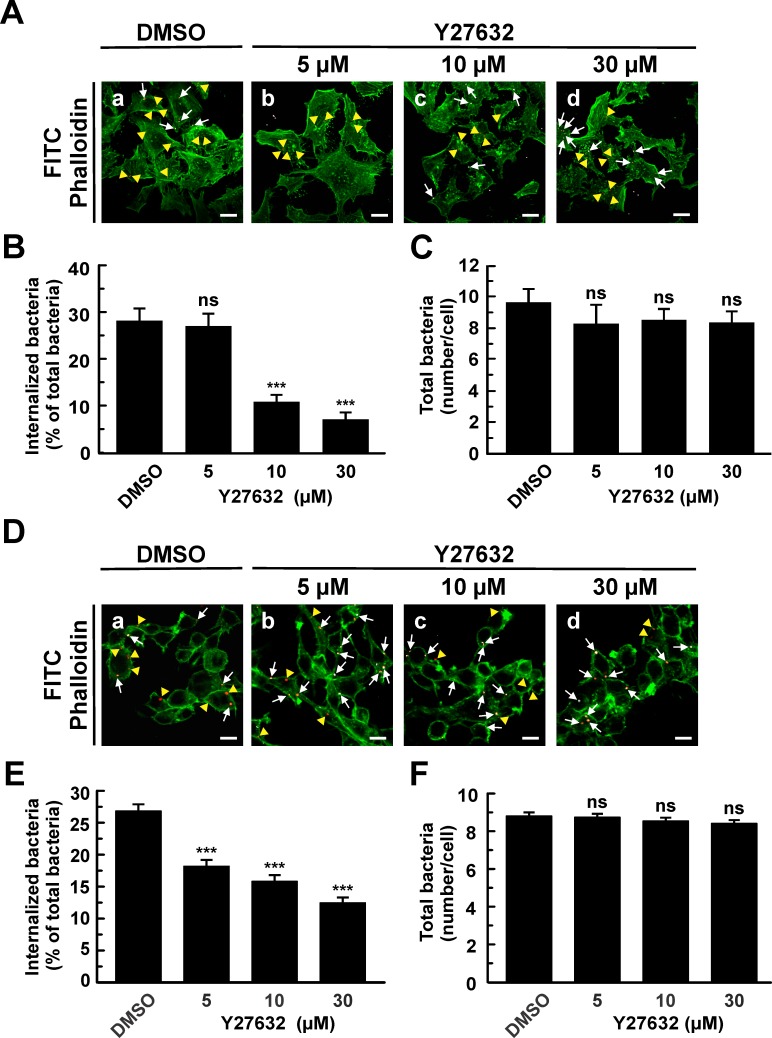
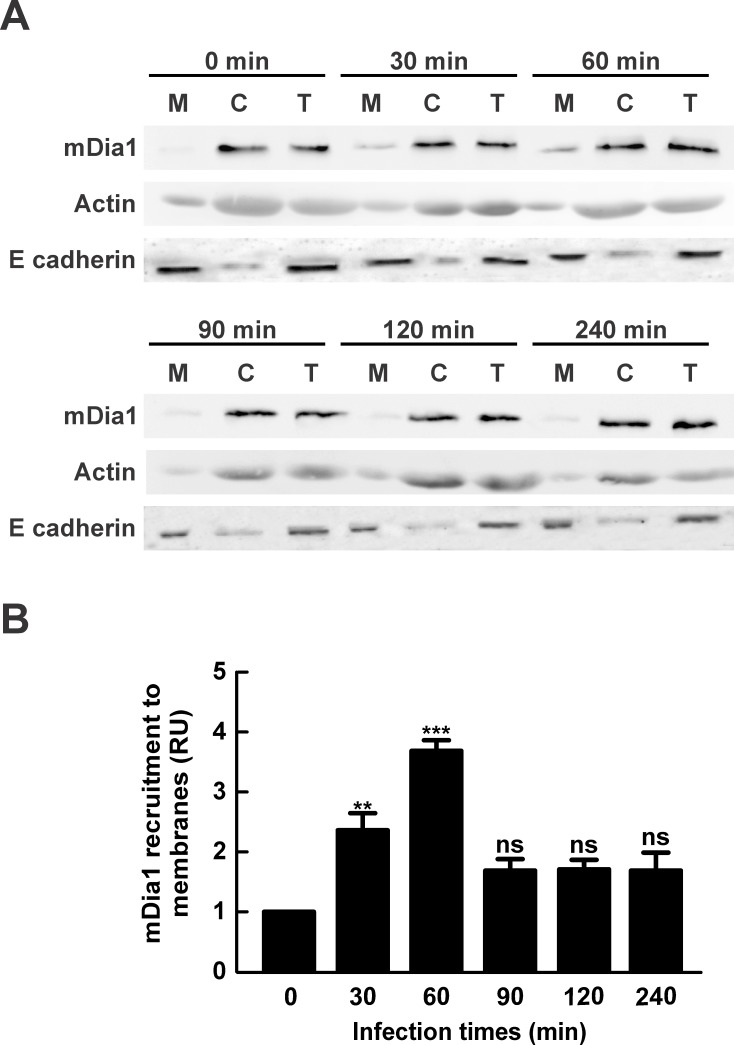
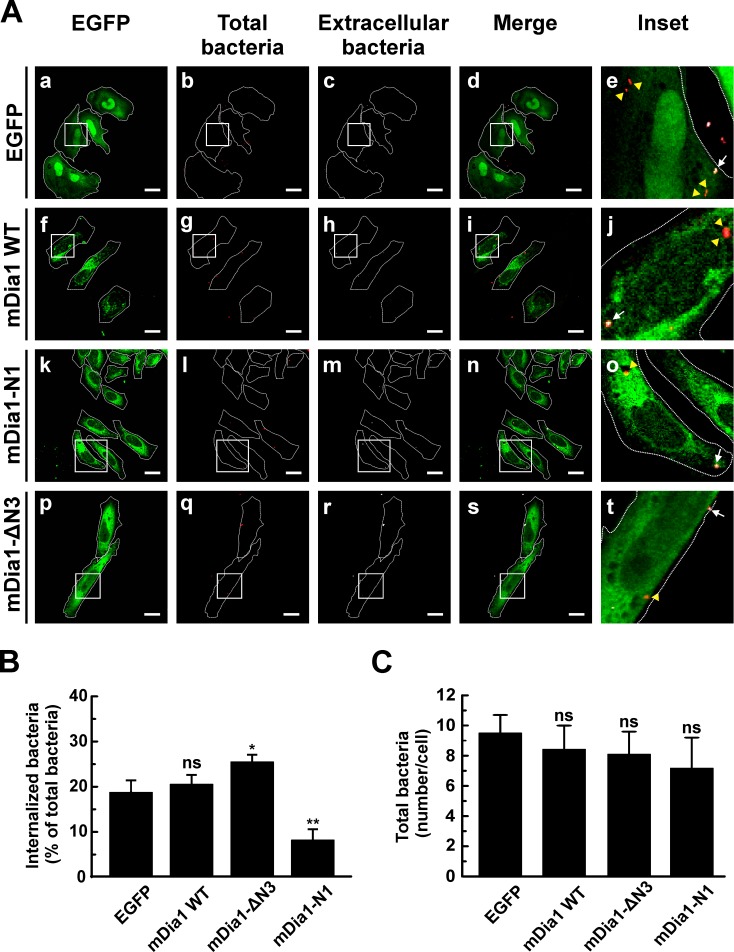
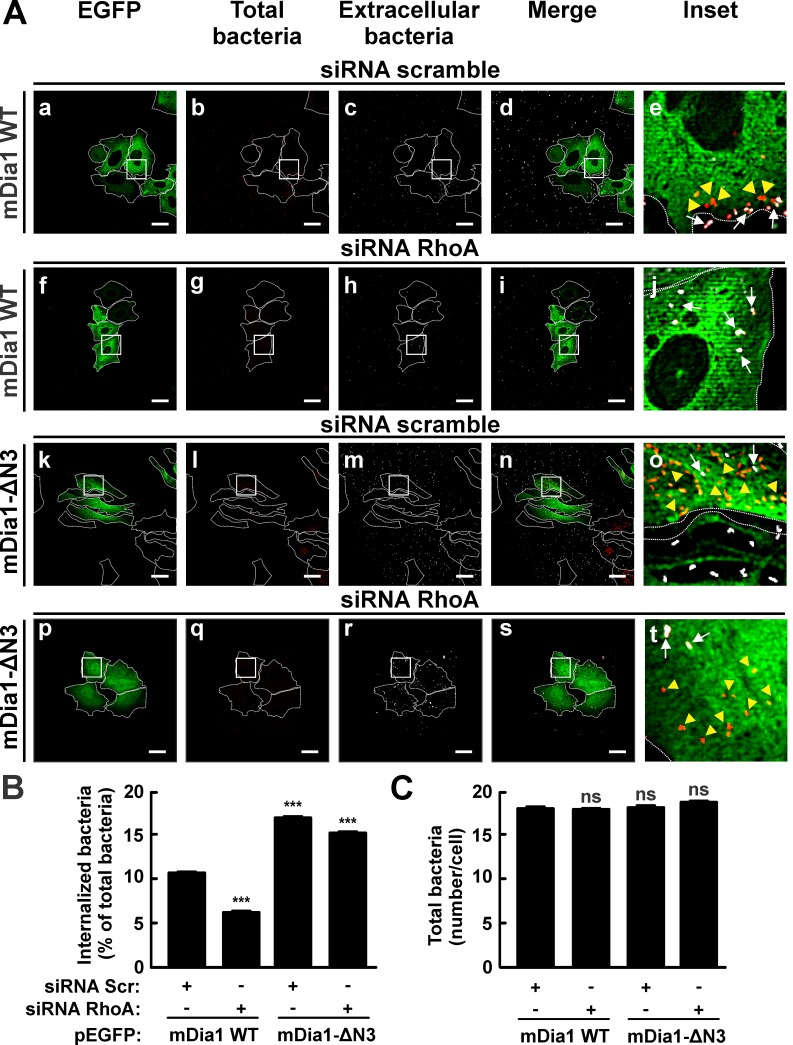
The GTPases belonging to the Rho family control the actin cytoskeleton rearrangements needed for particle internalization during phagocytosis. ROCK and mDia1 are downstream effectors of RhoA, a GTPase involved in that process. Coxiella burnetii, the etiologic agent of Q fever, is internalized by the host´s cells in an actin-dependent manner. Nevertheless, the molecular mechanism involved in this process has been poorly characterized. This work analyzes the role of different GTPases of the Rho family and some downstream effectors in the internalization of C. burnetii by phagocytic and non-phagocytic cells. The internalization of C. burnetii into HeLa and RAW cells was significantly inhibited when the cells were treated with Clostridium difficile Toxin B which irreversibly inactivates members of the Rho family. In addition, the internalization was reduced in HeLa cells that overexpressed the dominant negative mutants of RhoA, Rac1 or Cdc42 or that were knocked down for the Rho GTPases. The pharmacological inhibition or the knocking down of ROCK diminished bacterium internalization. Moreover, C. burnetii was less efficiently internalized in HeLa cells overexpressing mDia1-N1, a dominant negative mutant of mDia1, while the overexpression of the constitutively active mutant mDia1-ΔN3 increased bacteria uptake. Interestingly, when HeLa and RAW cells were infected, RhoA, Rac1 and mDia1 were recruited to membrane cell fractions. Our results suggest that the GTPases of the Rho family play an important role in C. burnetii phagocytosis in both HeLa and RAW cells. Additionally, we present evidence that ROCK and mDia1, which are downstream effectors of RhoA, are involved in that process.


Conflict of interest statement

Competing Interests: The authors have declared that no competing interests exist.

Figures

Fig 1
Fig 1. Clostridium difficile toxin B diminishes the internalization of C. burnetii by HeLa cells.
(A) HeLa cells were infected with C. burnetii for 4 h at 37°C in the presence of 0.05% DMSO (control, panels a-e) or with different concentrations of Clostridium difficile toxin B (panels f-t). Cells were fixed and processed for indirect immunofluorescence to determine C. burnetii internalization and F-actin distribution as described in Materials and Methods. Cells were analyzed by confocal microscopy. Micrographs of representative cells are shown. Cells were incubated sequentially with an antibody against C. burnetii and an appropriate secondary antibody conjugated to Cy5 (white pseudo color) under non-permeabilizing conditions. Under this condition, extracellular bacteria were stained in white pseudo color (panels c, h, m, and r). Then, cells were re-incubated with the same anti-C. burnetii antibody and an appropriate secondary antibody conjugated to Cy3 (red pseudo color) under permeabilizing conditions. Under this condition total bacteria were stained in red pseudo color (panels b, g, l, and q). In the merged images (panels d, i, n and s) and the insets of the merged images (panels e, j, o, and t), extracellular C. burnetii is shown in white and red pseudo colors (arrows), while intracellular C. burnetii is shown in red pseudo color (yellow arrowheads). F-actin was labeled with phalloidin-FITC (green, panels a, f, k, and p). Bars scale: 5 μm. (B) Quantification of C. burnetii internalized in control and toxin-treated HeLa cells. (C) Quantification of total C. burnetii associated to control and treated HeLa cells. Between 100 and 120 cells and 1200 and 1600 bacteria were counted in each experiment. Results are expressed as means ± SE of three independent experiments. *p < 0.05, **p < 0.01 compared to the DMSO treatment (one-way ANOVA and Dunnett's post hoc test). ns: non-significant differences between groups (p > 0.05).
Fig 2
Fig 2. Clostridium difficile toxin B diminishes internalization of C. burnetii by RAW macrophages.
(A) RAW cells were infected with C. burnetii for 4 h at 37°C in the presence of 0.05% DMSO (control, panels a-e) or different concentrations of Clostridium difficile toxin B (panels f-t). Cells were fixed and processed for indirect immunofluorescence to determine C. burnetii internalization and F-actin distribution as described in Materials and Methods. Cells were analyzed by confocal microscopy. Micrographs of representative cells are shown. As indicated in Fig 1, extracellular and total bacteria were stained in white pseudo color (panels c, h, m, and r) and red pseudo color (panels b, g, l, and q), respectively. In the merged images (panels d, i, n, and s) and the insets of the merged images (panels e, j, o, and t), extracellular C. burnetii is shown in white and red pseudo colors (arrows), while intracellular C. burnetii is shown in red pseudo color (yellow arrowheads). F-actin was labeled with phalloidin-FITC (green). Bar scale: 10 μm. (B) Quantification of C. burnetii internalized in control and toxin-treated RAW cells. (C) Quantification of total C. burnetii associated to control or toxin-treated cells. Between 100 and 120 cells and 1200 and 1600 bacteria were counted in each experiment. Results are expressed as means ± SE of three independent experiments. **p < 0.01, ***p < 0.001, compared to DMSO treatment (one-way ANOVA and Dunnett's post hoc test). ns: non-significant differences between groups (p > 0.05).
Fig 3
Fig 3. RhoA and Rac1 are recruited to a membrane fraction obtained from cells infected with C. burnetii.
HeLa cells were infected with C. burnetii for different lengths of time, lysed and centrifuged to obtain postnuclear supernatant, membrane and cytosolic fractions as described in Materials and Methods. (A) Postnuclear supernatant (T: total), cytosol (C) and membrane (M) fractions were analyzed by SDS-PAGE and Western blot using antibodies against RhoA and Rac1. Anti-actin and anti-E cadherin antibodies were used as loading controls. (B) Quantification of RhoA or Rac1 recruitment to the membrane fraction. The band intensities corresponding to RhoA, Rac1, E cadherin and actin were measured by the ImageJ software, and the band intensity ratio between RhoA and E cadherin, and Rac1 and E cadherin in the membrane fractions was calculated. Results are expressed as means ± SE from at least three independent experiments. Mean values were compared with the 0 min infection condition by Student’s t test for single group mean (*p < 0.05, ***p < 0.001). ns: non-significant differences between groups (p > 0.05). RU: Relative Units.
Fig 4
Fig 4. C. burnetti internalization is inhibited by overexpression of the dominant negative mutants of Rho GTPases.
(A) HeLa cells were transfected with pEGFP (panels a-e), pEGFP-RhoA N19 (panels f-j), pEGFP-Cdc42 N17 (panels k-o), or pEGFP-Rac1 N17 (panels p-t). Cells were infected for 4 h at 37°C with C. burnetii and subsequently fixed and processed for immunofluorescence to determine the levels of C. burnetii internalization as described in Materials and Methods. Cells were analyzed by confocal microscopy. Representative micrographs are presented. As indicated in Fig 1, extracellular and total bacteria were stained in white pseudo color (panels c, h, m, and r) and red pseudo color (panels b, g, l, and q), respectively. In the merged images (panels d, i, n, and s) and the insets of the merged images (panels e, j, o, and t), extracellular C. burnetii is shown in white and red pseudo colors (arrows), while intracellular C. burnetii is shown in red pseudo color (yellow arrowheads). Bars scale: 5 μm. (B) Quantification of C. burnetii internalized by transfected HeLa cells. (C) Quantification of total C. burnetii associated to HeLa cells. Between 40 and 60 cells and between 400 and 600 bacteria were counted in each experiment. Results are expressed as means ± SE of three independent experiments. *p < 0.05, **p < 0.01 compared to the EGFP control (one-way ANOVA and Dunnett's post hoc test). ns: non-significant differences between groups (p > 0.05).
Fig 5
Fig 5. Knockdown of Rho GTPases and Rock inhibits internalization of C. burnetii.
(A) HeLa cells were co-transfected with pEGFP and a scramble (panels a and b), Rac1 (panels c and d), RhoA (panels e and f) or ROCK (panels g and h) siRNAs or the RhoA/Rac1 siRNA combination (panels i and j). Cells were infected for 4 h at 37°C with C. burnetii and then fixed and processed for immunofluorescence to determine C. burnetii internalization as described in Materials and Methods. Cells were analyzed by confocal microscopy. Representative micrographs of cells are presented. As indicated in Fig 1, in the merged images (panels a, c, e, g, and i) and the insets of the merged images (panels d, d, f, h, and j), extracellular C. burnetii is shown in white and red pseudo colors (arrows), while intracellular C. burnetii is shown in red pseudo color (yellow arrowheads). Scale bar: 5 μm. (B) Quantification of C. burnetii internalized by transfected HeLa cells. (C) Quantification of total C. burnetii associated to HeLa cells. Between 40 and 60 cells and between 400 and 600 bacteria were counted in each experiment. Results are expressed as means ± SE of three independent experiments. ***p < 0.001, compared to scramble siRNA (one-way ANOVA and Dunnett's post hoc test). ns: non-significant differences between groups (p > 0.05). (D) Lysates of cotransfected HeLa cells were analyzed by SDS-PAGE and Western blot using antibodies against Rac1, RhoA and ROCK. An anti-actin antibody was used as loading control. Scr: scramble siRNA.
Fig 6
Fig 6. The specific inhibitor of ROCK, Y27632, diminishes C. burnetii internalization by HeLa or RAW cells.
(A) HeLa or (D) RAW cells were infected with C. burnetii for 4 h at 37°C in the presence of 0.05% DMSO (control, A, panel a; D, panel a) or different concentrations of Y27632 (A, panels b-d; D, panels b-d). Cells were fixed and processed for indirect immunofluorescence to determine C. burnetii internalization and F-actin distribution as described in Materials and Methods. Cells were analyzed by confocal microscopy. Representative micrographs of cells are presented. F-actin was labeled with phalloidin-FITC (green). Representative micrographs of cells are presented. As indicated in Fig 1, in the merged images (A, panels a, b, c, and d; D, panels a, b, c, and d), extracellular C. burnetii is shown in white and red pseudo colors (arrows), while intracellular C. burnetii is shown in red pseudo color (yellow arrowheads). Between 100 and 120 cells and between 1200 and 1600 bacteria were counted in each experiment. Scale bar: 5 μm (A); 10 μm (D). Quantification of C. burnetii internalized by Y27632-treated HeLa (B) or RAW (E) cells. Quantification of total C. burnetii associated to HeLa (C) or RAW (F) cells. Results are expressed as means ± SE of three independent experiments. ***p < 0.001, compared to DMSO treatment (one-way ANOVA and Dunnett's post hoc test). ns: non-significant differences between groups (p > 0.05).
Fig 7
Fig 7. The factor mDia1 is recruited to membrane fraction obtained from cells infected with C. burnetii.
(A) HeLa cells were infected with C. burnetii for different lengths of time, lysed and centrifuged to obtain postnuclear supernatant, membrane and cytosolic fractions. (A) Postnuclear supernatant (T: total), cytosol (C) and membrane (M) fractions were analyzed by SDS-PAGE and western blot using an antibody against mDia1. Anti-actin and anti-E cadherin antibodies were used as loading controls. (B) Quantification of mDia1 recruitment to membrane fraction. The band intensity of mDia1, E cadherin and actin was measured by the ImageJ software, and band intensity ratio between mDia1 and E cadherin in the membrane fractions was calculated. Results are expressed as means ± SE from at least three independent experiments. Means were compared with the 0 min infection condition by Student’s t test for single group mean (**p < 0.01, ***p < 0.001). ns: non-significant differences between groups (p > 0.05). (RU): Relative Units.
Fig 8
Fig 8. The overexpression of the dominant negative mutants of mDia1 inhibits internalization of C. burnetii.
(A) HeLa cells were transfected with pEGFP (panels a-e), pEGFP-mDia1 WT (panels f-j), pEGFP-mDia1-N1 (dominant negative form) (panels k-o) or pEGFP-mDia1-ΔN3 (constitutively active form) (panels p-t). Transfected cells were infected for 4 h at 37°C with C. burnetii. Cells were fixed and processed for immunofluorescence to determine C. burnetii internalization as described in Materials and Methods. Cells were analyzed by confocal microscopy. Representative micrographs of cells are presented. As indicated in Fig 1, extracellular and total bacteria were stained in white pseudo color (panels c, h, m, and r) and red pseudo color (panels b, g, l, and q), respectively. In the merged images (panels d, i, n, and s) and the insets of merged images (panels e, j, o, and t), extracellular C. burnetii is shown in white and red pseudo colors (arrows), while intracellular C. burnetii is shown in red pseudo color (yellow arrowheads). Scale bar: 5 μm. (B) Quantification of C. burnetii internalized by transfected HeLa cells. (C) Quantification of total C. burnetii associated to HeLa cells. Between 40 and 60 cells and between 400 and 600 bacteria were counted in each experiment. Results are expressed as means ± SE of three independent experiments. *p < 0.05, **p < 0.01 compared to the EGFP control (one-way ANOVA and Dunnett's post hoc test). ns: non-significant differences between groups (p > 0.05).
Fig 9
Fig 9. The overexpression of the constitutively active form of mDia1 restored the entry of C. burnetii into RhoA-knocked down HeLa cells.
(A) HeLa cells were cotransfected with pEGFP-mDia1 WT (panels a-j) or pEGFP-mDia1-ΔN3 (constitutively active form) (panels k-t) and scramble siRNA (panels a-e) or RhoA siRNA (panels p-t). Transfected cells were infected for 4 h at 37°C with C. burnetii. Cells were fixed and processed for immunofluorescence to determine C. burnetii internalization as described in Materials and Methods. Cells were analyzed by confocal microscopy. Representative micrographs of cells are presented. As indicated in Fig 1, extracellular and total bacteria were stained in white pseudo color (panels c, h, m, and r) and red pseudo color (panels b, g, l, and q), respectively. In the merged images (panels d, i, n, and s) and the insets of merged images (panels e, j, o, and t), extracellular C. burnetii is shown in white and red pseudo colors (arrows), while intracellular C. burnetii is shown in red pseudo color (yellow arrowheads). Scale bar: 5 μm. (B) Quantification of C. burnetii internalized by cotransfected HeLa cells. (C) Quantification of total C. burnetii associated to HeLa cells. Between 40 and 60 cells and 400 and 600 bacteria were counted in each experiment. Results are expressed as means ± SE of three independent experiments. ***p < 0.001 compared to the EGFP control (one-way ANOVA and Dunnett's post hoc test). ns: non-significant differences between groups (p > 0.05). Scr: scramble siRNA.

References

    1. Gardel ML, Schneider IC, Aratyn-Schaus Y, Waterman CM (2010) Mechanical integration of actin and adhesion dynamics in cell migration. Annu Rev Cell Dev Biol 26: 315–333. 10.1146/annurev.cellbio.011209.122036 - DOI - PMC - PubMed
    1. Gourlay CW, Ayscough KR (2005) A role for actin in aging and apoptosis. Biochem Soc Trans 33: 1260–1264. - PubMed
    1. Croise P, Estay-Ahumada C, Gasman S, Ory S (2014) Rho GTPases, phosphoinositides, and actin: a tripartite framework for efficient vesicular trafficking. Small GTPases 5: e29469 29469 [pii]; 10.4161/sgtp.29469 - DOI - PMC - PubMed
    1. Jaffe AB, Hall A (2005) Rho GTPases: biochemistry and biology. Annu Rev Cell Dev Biol 21: 247–269. - PubMed
    1. Heasman SJ, Ridley AJ (2008) Mammalian Rho GTPases: new insights into their functions from in vivo studies. Nat Rev Mol Cell Biol 9: 690–701. nrm2476 [pii]; 10.1038/nrm2476 - DOI - PubMed

Publication types

MeSH terms

Substances