. 2015 Dec 16;11(12):e1004666.
doi: 10.1371/journal.pcbi.1004666. eCollection 2015 Dec.

Modeling Fatty Acid Transfer from Artery to Cardiomyocyte

Affiliations

Modeling Fatty Acid Transfer from Artery to Cardiomyocyte

Theo Arts et al. PLoS Comput Biol. .

Abstract

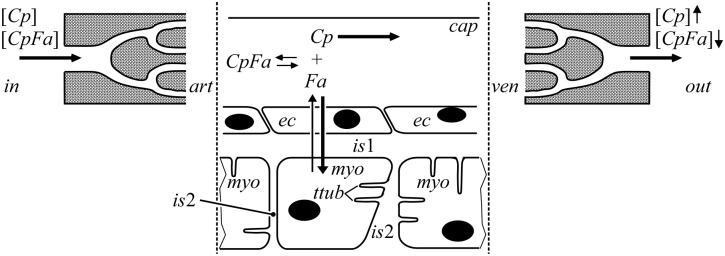
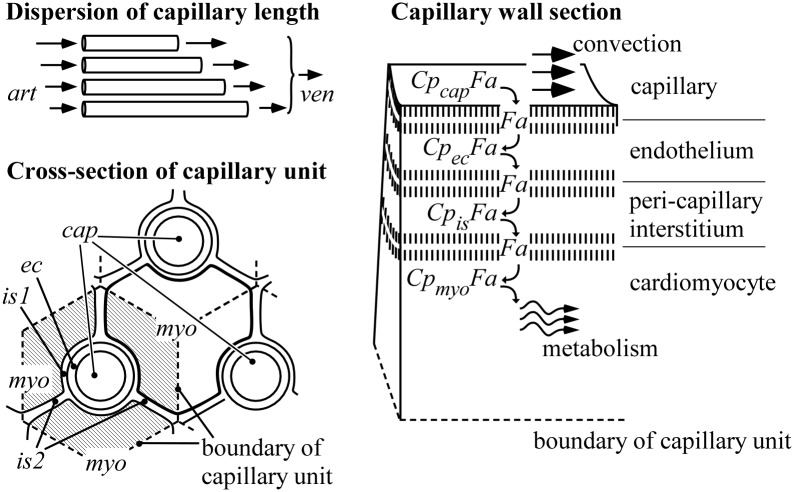
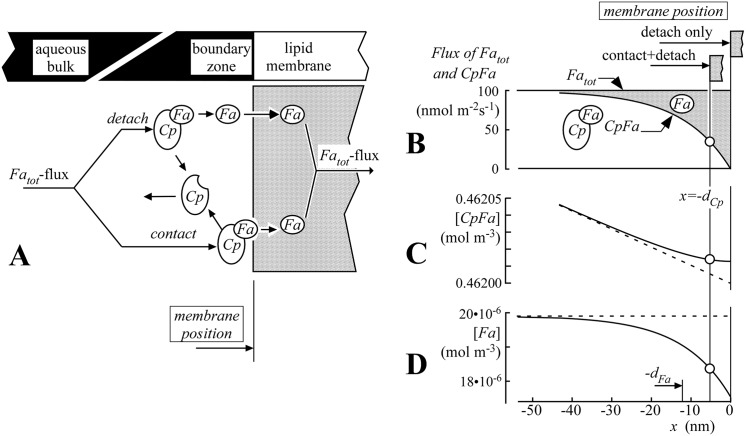
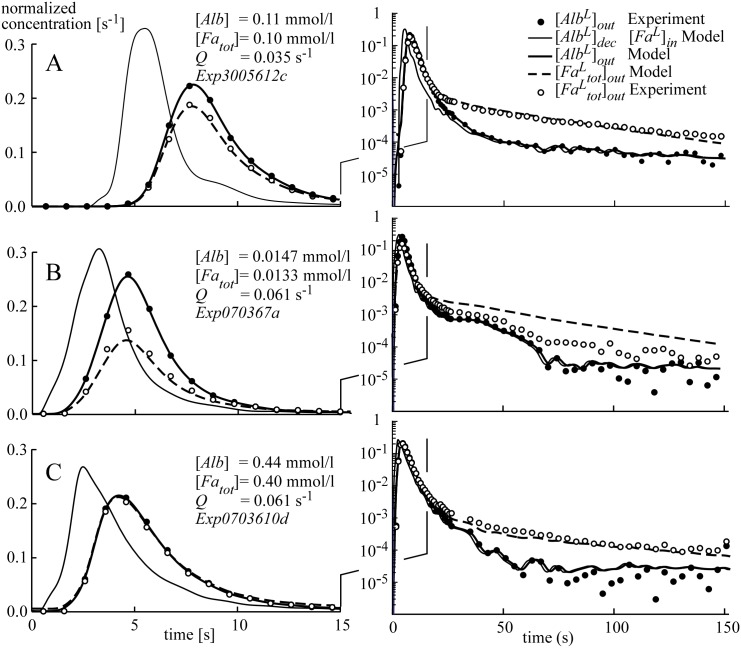
Despite the importance of oxidation of blood-borne long-chain fatty acids (Fa) in the cardiomyocytes for contractile energy of the heart, the mechanisms underlying the transfer of Fa from the coronary plasma to the cardiomyocyte is still incompletely understood. To obtain detailed insight into this transfer process, we designed a novel model of Fa transfer dynamics from coronary plasma through the endothelial cells and interstitium to the cardiomyocyte, applying standard physicochemical principles on diffusion and on the chemical equilibrium of Fa binding to carrier proteins Cp, like albumin in plasma and interstitium and Fatty Acid-Binding Proteins within endothelium and cardiomyocytes. Applying these principles, the present model strongly suggests that in the heart, binding and release of Fa to and from Cp in the aqueous border zones on both sides of the cell membranes form the major hindrance to Fa transfer. Although often considered, the membrane itself appears not to be a significant hindrance to diffusion of Fa. Proteins, residing in the cellular membrane, may facilitate transfer of Fa between Cp and membrane. The model is suited to simulate multiple tracer dilution experiments performed on isolated rabbit hearts administrating albumin and Fa as tracer substances into the coronary arterial perfusion line. Using parameter values on myocardial ultrastructure and physicochemical properties of Fa and Cp as reported in literature, simulated washout curves appear to be similar to the experimentally determined ones. We conclude therefore that the model is realistic and, hence, can be considered as a useful tool to better understand Fa transfer by evaluation of experimentally determined tracer washout curves.


Conflict of interest statement

The authors have declared that no competing interests exist.

Figures

Fig 1
Fig 1. Schematic representation of long-chain fatty acid (Fa) transfer in myocardium.
Fa enter the coronary arteries at location 'in' while predominantly bound to albumin, serving as capillary lumen-specific carrier protein (Cp). After entering the capillaries (cap) at location 'art', part of the CpFa complexes dissociates, allowing Fa transfer to myocardial tissue compartments, i.e., endothelial cells (ec), pericapillary interstitium (is1), cardiomyocytes (myo), non-pericapillary interstitium (is2) and T-tubules (ttub). In the latter aqueous compartments, most Fa are bound to compartment-specific Cp. Non-metabolized Fa leave the capillaries mainly as CpFa draining into the veins (ven). Exchange of Fa between plasma and tissue in blood vessels other than the capillaries is neglected.
Fig 2
Fig 2. Schematic representation of intramyocardial Fa transfer in the capillaries.
Top left, "Dispersion of capillary length": Capillaries of different length all drain in the same venous outlet (ven). Bottom left, "Cross-section of capillary unit": The region attributed to a capillary (cap) defines a capillary unit (shaded). The bold contour marks a cardiomyocyte (myo), being surrounded by three capillaries as an example, resulting in subdivision of the cardiomyocyte by the capillary unit boundaries. Abbreviations ec, is1 and is2 indicate endothelium, pericapillary interstitium and non-pericapillary interstitium, respectively. Right, "Capillary wall section". In this section, Fa move from capillary lumen through endothelium and pericapillary interstitium to the interior of the cardiomyocyte. Within these aqueous compartments, Fa are mainly transferred by carrier-mediated diffusion while bound to a compartment-specific carrier protein Cp. Inside the cellular membranes, separating these compartments, Fa are dissolved as free molecules and transferred by diffusion. At all 6 aqueous compartment-membrane boundaries Fa are exchanged between compartment-specific Cp and phospholipids in the membrane. Only inside the cardiomyocyte, a substantial fraction of Fa is eventually metabolized.
Fig 3
Fig 3. Permeability of water-phospholipid membrane boundary for Fa.
In panel A, transfer mechanisms 'detach' and 'contact' indicate Fa detachment from CpFa in the aqueous boundary zone followed by diffusion of free Fa towards the cellular membrane ('detach pathway') and Fa delivery from CpFa to the phospholipid bilayer of the cellular membrane by direct contact ('contact pathway'), respectively. Panels B-D refer to a physiologically realistic situation in the boundary zone between the capillary plasma and endothelial cell membrane with plasma albumin concentration 0.66 mmol l-1, and total Fa concentration 0.60 mmol l-1. Solid lines in graphs B, C and D represent Fa-flux (Eqs 17, 19 and 20) and concentrations [CpFa] (Eq 23) and [Fa] (Eq 28), respectively, as a function of its position relative to the boundary x = 0. If only the detach pathway is active, the membrane surface is positioned at x = 0. In the boundary zone the fraction of total Fa-flux, occurring by diffusion of free Fa (shaded fraction in B) increases exponentially with distance constant d Fa to 100% at x = 0 at the cost of the fraction of carrier-mediated diffusion. Relative variations in [CpFa] are little, while those for [Fa] are considerable (C and D, respectively). Dashed lines indicate linear extrapolations of concentration profiles in the aqueous bulk. If both the detach and contact pathways are active, the membrane surface is positioned at x = −d Cp, representing the membrane reaction rate parameter. Then, at the membrane surface, part of the total Fa flux occurs by CpFa flux towards the membrane, followed by delivery of Fa into the membrane through direct contact between CpFa and membrane. While keeping Fa tot flux constant, an increase of d Cp induces lowering of the free Fa concentration drop relative to the bulk concentration (D), implying an increase of boundary zone permeability P b, being defined as flux divided by concentration drop. It is of note that with inversion of Fa flux (“back flux”) all processes and concentration gradients are reversed too, in other words the model is symmetric.
Fig 4
Fig 4. Three examples (A-C) of dilution curves for labeled albumin [Alb L] and palmitate [Fa L tot], on a linear scale to focus on the peak (left panels) and on a logarithmic scale to focus on the tail (right panels).
Arterial plasma concentrations [Alb]in and [Fa tot]in and normalized flows Q, expressed in ml s-1 per ml of tissue (s-1), are indicated in the left panels. Panels B and C refer to the same heart, applying different Alb and Fa concentrations. From sampled data [Alb L]out, capillary inlet concentration [Alb L]dec was estimated by deconvolution. Using this time course, the model rendered output concentrations [Alb L]out and [Fa L tot]out. For Alb L, simulation and experiment fit very well. For Fa L tot, the fit is good considering the fact that for all three simulations the same set of parameters is used without any experiment-specific fit. Tracer concentration on the y-axis is expressed in [s-1] due to normalization by setting the time integral of concentration at the coronary artery entrance equal to 1. Fa extraction fraction was found to be 0.12, 0.32 and 0.02 for experiments A, B and C, respectively.
Fig 5
Fig 5. Sensitivity of total labeled Fa L tot concentration in the venous effluent to parameter (par) variations.
In the upper two left panels, sensitivity par ∂[Fa L tot]/par is shown for the peak. In the upper two right panels sensitivity (par/[Fa L tot]) ∂[Fa L tot]/par is shown for the tail. The shaded areas indicate the time interval of the peak. Abbreviation 'par' indicates the varied parameter. In the upper two panels, parameters q, σcap, [Cp]ec and τ CpFa,ec indicate plasma flow, capillary length dispersion, Cp concentration in ec compartment and dissociation time constant of CpFa in ec compartment, respectively. In the middle two panels, symbols τ CpFa,cap, τ CpFa,is1, and τ CpFa,myo indicate dissociation time constants of CpFa in the compartments cap, is1 and myo, respectively. Symbols [Cp]is1 and [Cp]myo indicate total Cp concentration in the compartments is1 and myo, respectively. To facilitate judgment of timing with the dilution curves, the Fa-curves from Fig 4A are shown in the bottom panels. Note that in the middle left panel scaling is different from the panel above.
Fig 6
Fig 6. Functions used to incorporate capillary length dispersion.
Functions A(z), q(z), -dq/dz(z), v(z) and S(z) represent normalized capillary cross-sectional area, capillary blood flow, its derivative, mean capillary blood flow velocity and capillary wall area, respectively (Eqs 9–12), as a function of distance from the capillary entrance z, normalized to average capillary length z 0. Function p len(z) represents capillary length distribution with relative dispersion σ cap = 0.5 (Eq 30).

Similar articles

Cited by

References

    1. van der Vusse G.J., et al., Fatty acid homeostasis in the normoxic and ischemic heart. Physiol Rev, 1992. 72(4): p. 881–940. - PubMed
    1. Lopaschuk G.D., et al., Myocardial fatty acid metabolism in health and disease. Physiol Rev, 2010. 90(1): p. 207–58. 10.1152/physrev.00015.2009 - DOI - PubMed
    1. van der Vusse G.J., et al., Critical steps in cellular fatty acid uptake and utilization. Mol Cell Biochem, 2002. 239(1–2): p. 9–15. - PubMed
    1. Huber A.H., et al., Fatty acid-specific fluorescent probes and their use in resolving mixtures of unbound free fatty acids in equilibrium with albumin. Biochemistry, 2006. 45(48): p. 14263–74. - PMC - PubMed
    1. Richieri G.V., Anel A., and Kleinfeld A.M., Interactions of long-chain fatty acids and albumin: determination of free fatty acid levels using the fluorescent probe ADIFAB. Biochemistry, 1993. 32(29): p. 7574–80. - PubMed

MeSH terms

LinkOut - more resources