

Predicting the impact of promoter variability on regulatory outputs
- PMID: 26675057
- PMCID: PMC4682146
- DOI: 10.1038/srep18238
Predicting the impact of promoter variability on regulatory outputs
Abstract
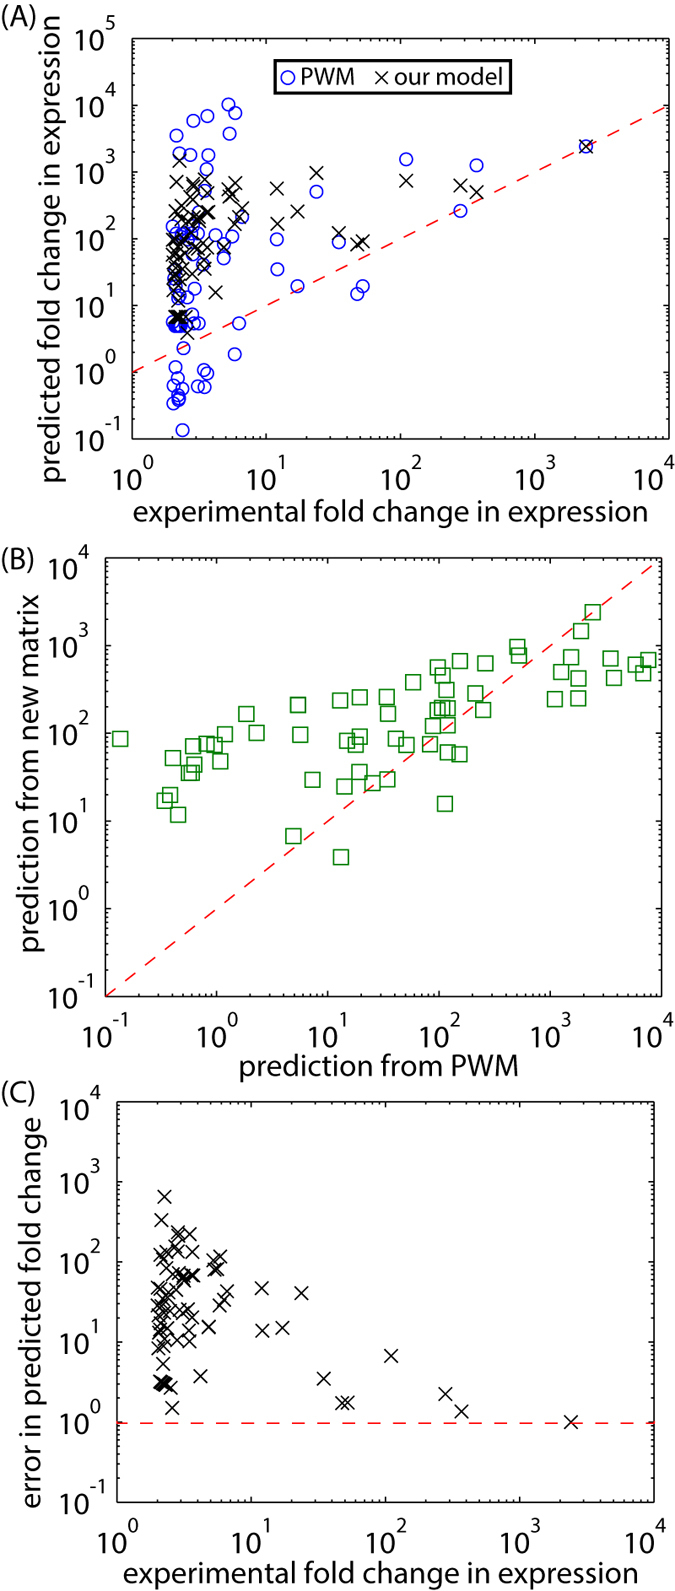
The increased availability of whole genome sequences calls for quantitative models of global gene expression, yet predicting gene expression patterns directly from genome sequence remains a challenge. We examine the contributions of an individual regulator, the ferrous iron-responsive regulatory element, BqsR, on global patterns of gene expression in Pseudomonas aeruginosa. The position weight matrix (PWM) derived for BqsR uncovered hundreds of likely binding sites throughout the genome. Only a subset of these potential binding sites had a regulatory consequence, suggesting that BqsR/DNA interactions were not captured within the PWM or that the broader regulatory context at each promoter played a greater role in setting promoter outputs. The architecture of the BqsR operator was systematically varied to understand how binding site parameters influence expression. We found that BqsR operator affinity was predicted by the PWM well. At many promoters the surrounding regulatory context, including overlapping operators of BqsR or the presence of RhlR binding sites, were influential in setting promoter outputs. These results indicate more comprehensive models that include local regulatory contexts are needed to develop a predictive understanding of global regulatory outputs.
Figures


Similar articles
-
The ferrous iron-responsive BqsRS two-component system activates genes that promote cationic stress tolerance.mBio. 2015 Feb 24;6(2):e02549. doi: 10.1128/mBio.02549-14. mBio. 2015. PMID: 25714721 Free PMC article.
-
Promoter specificity in Pseudomonas aeruginosa quorum sensing revealed by DNA binding of purified LasR.Proc Natl Acad Sci U S A. 2004 Nov 9;101(45):15833-9. doi: 10.1073/pnas.0407229101. Epub 2004 Oct 25. Proc Natl Acad Sci U S A. 2004. PMID: 15505212 Free PMC article.
-
BqsR/BqsS constitute a two-component system that senses extracellular Fe(II) in Pseudomonas aeruginosa.J Bacteriol. 2012 Mar;194(5):1195-204. doi: 10.1128/JB.05634-11. Epub 2011 Dec 22. J Bacteriol. 2012. PMID: 22194456 Free PMC article.
-
Identification of ligand binding activity and DNA recognition by RhlR protein from opportunistic pathogen Pseudomonas aeruginosa-a molecular dynamic simulation approach.J Mol Recognit. 2018 Dec;31(12):e2738. doi: 10.1002/jmr.2738. Epub 2018 Jul 2. J Mol Recognit. 2018. PMID: 29968257
-
Regulatory architecture of the iron-regulated fepD-ybdA bidirectional promoter region in Escherichia coli.J Bacteriol. 2001 Mar;183(6):2059-70. doi: 10.1128/JB.183.6.2059-2070.2001. J Bacteriol. 2001. PMID: 11222606 Free PMC article.
Cited by
-
Quantifying the strength of quorum sensing crosstalk within microbial communities.PLoS Comput Biol. 2017 Oct 19;13(10):e1005809. doi: 10.1371/journal.pcbi.1005809. eCollection 2017 Oct. PLoS Comput Biol. 2017. PMID: 29049387 Free PMC article.
-
Transcriptional Regulators Controlling Virulence in Pseudomonas aeruginosa.Int J Mol Sci. 2023 Jul 25;24(15):11895. doi: 10.3390/ijms241511895. Int J Mol Sci. 2023. PMID: 37569271 Free PMC article. Review.
-
Deciphering regulatory architectures from synthetic single-cell expression patterns.bioRxiv [Preprint]. 2024 Jun 5:2024.01.28.577658. doi: 10.1101/2024.01.28.577658. bioRxiv. 2024. Update in: PLoS Comput Biol. 2024 Dec 26;20(12):e1012697. doi: 10.1371/journal.pcbi.1012697. PMID: 38352569 Free PMC article. Updated. Preprint.
-
Unraveling the Complex Interplay of Fis and IHF Through Synthetic Promoter Engineering.Front Bioeng Biotechnol. 2020 Jun 18;8:510. doi: 10.3389/fbioe.2020.00510. eCollection 2020. Front Bioeng Biotechnol. 2020. PMID: 32626694 Free PMC article.
-
Genetic cargo and bacterial species set the rate of vesicle-mediated horizontal gene transfer.Sci Rep. 2017 Aug 18;7(1):8813. doi: 10.1038/s41598-017-07447-7. Sci Rep. 2017. PMID: 28821711 Free PMC article.
References
-
- Meister G. Argonaute proteins: functional insights and emerging roles. Nat Rev Genet 14, 447–59 (2013). - PubMed
-
- Levo M. & Segal E. In pursuit of design principles of regulatory sequences. Nat Rev Genet 15, 453–468 (2014). - PubMed
-
- Spitz F. & Furlong E. E. M. Transcription factors: from enhancer binding to developmental control. Nature Reviews Genetics 13, 613–626 (2012). - PubMed
Publication types
MeSH terms
Substances
Grants and funding
LinkOut - more resources
Full Text Sources
Other Literature Sources
