. 2015 Dec 16;10(12):e0145234.
doi: 10.1371/journal.pone.0145234. eCollection 2015.

Virulence-Dependent Alterations in the Kinetics of Immune Cells during Pulmonary Infection by Mycobacterium tuberculosis

Affiliations

Virulence-Dependent Alterations in the Kinetics of Immune Cells during Pulmonary Infection by Mycobacterium tuberculosis

Woo Sik Kim et al. PLoS One. .

Abstract

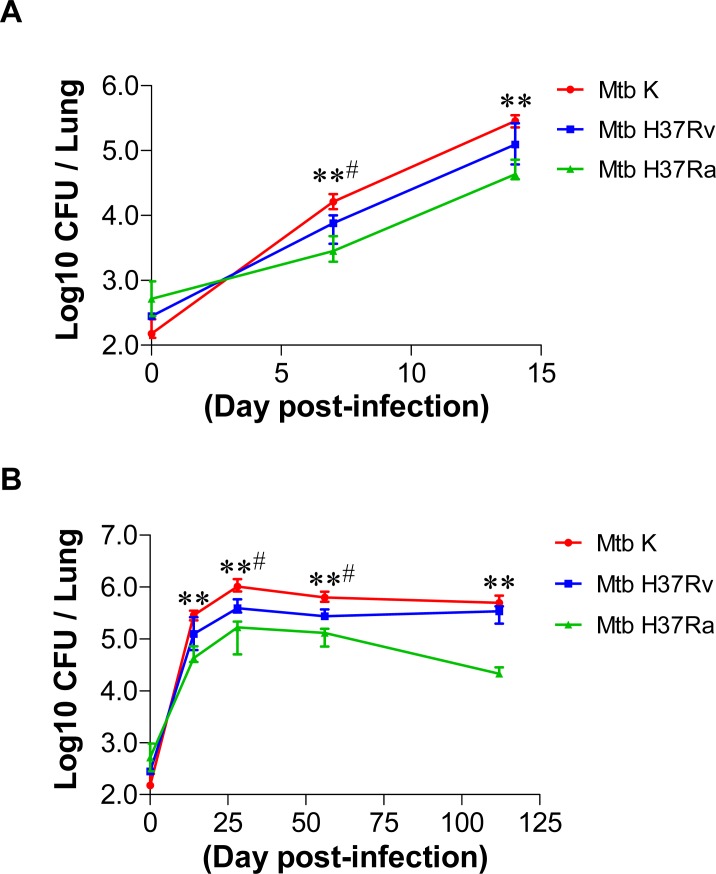
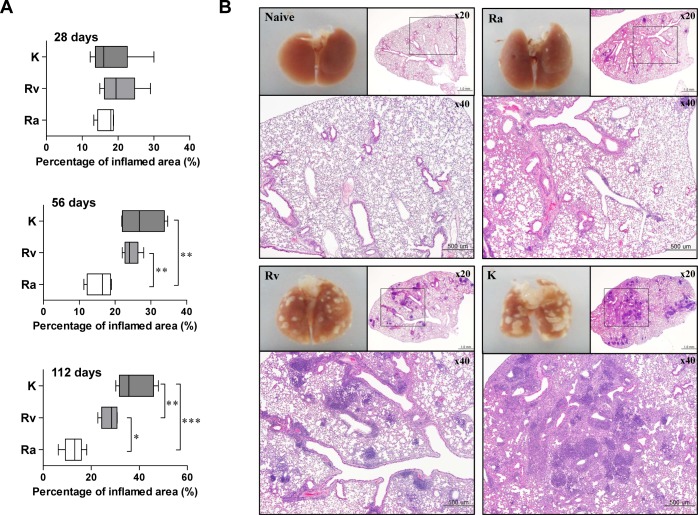
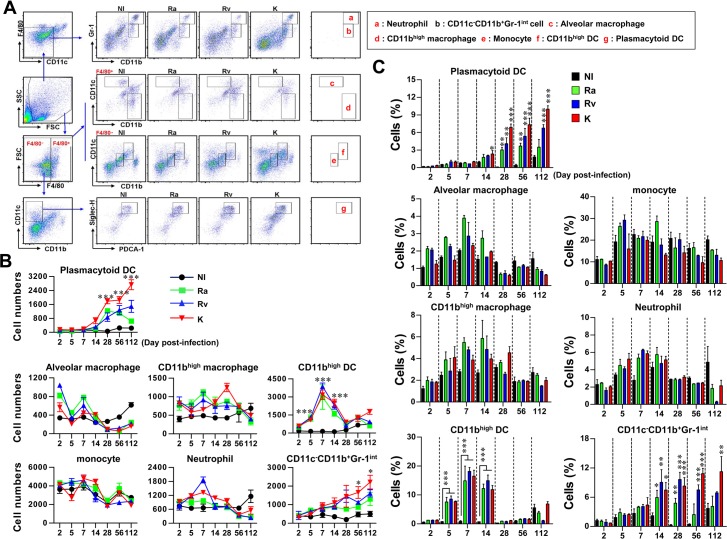
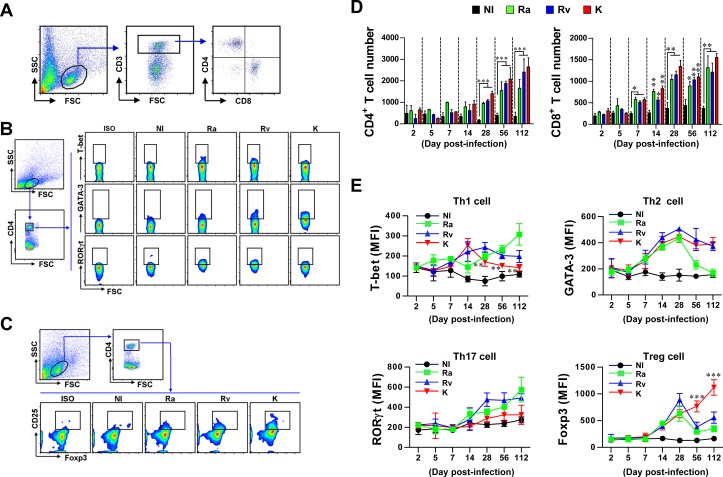
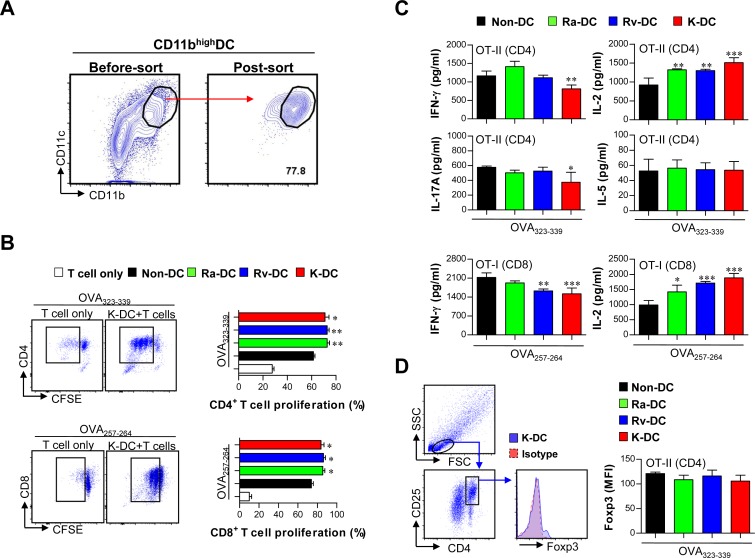
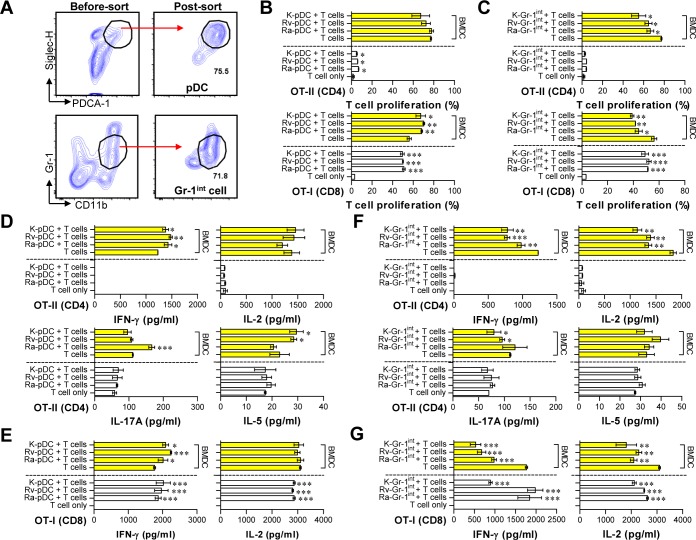
A better understanding of the kinetics of accumulated immune cells that are involved in pathophysiology during Mycobacterium tuberculosis (Mtb) infection may help to facilitate the development of vaccines and immunological interventions. However, the kinetics of innate and adaptive cells that are associated with pathogenesis during Mtb infection and their relationship to Mtb virulence are not clearly understood. In this study, we used a mouse model to compare the bacterial burden, inflammation and kinetics of immune cells during aerogenic infection in the lung between laboratory-adapted strains (Mtb H37Rv and H37Ra) and Mtb K strain, a hyper-virulent W-Beijing lineage strain. The Mtb K strain multiplied more than 10- and 3.54-fold more rapidly than H37Ra and H37Rv, respectively, during the early stage of infection (at 28 days post-infection) and resulted in exacerbated lung pathology at 56 to 112 days post-infection. Similar numbers of innate immune cells had infiltrated, regardless of the strain, by 14 days post-infection. High, time-dependent frequencies of F4/80-CD11c+CD11b-Siglec-H+PDCA-1+ plasmacytoid DCs and CD11c-CD11b+Gr-1int cells were observed in the lungs of mice that were infected with the Mtb K strain. Regarding adaptive immunity, Th1 and Th17 T cells that express T-bet and RORγt, respectively, significantly increased in the lungs that were infected with the laboratory-adapted strains, and the population of CD4+CD25+Foxp3+ regulatory T cells was remarkably increased at 112 days post-infection in the lungs of mice that were infected with the K strain. Collectively, our findings indicate that the highly virulent Mtb K strain may trigger the accumulation of pDCs and Gr1intCD11b+ cells with the concomitant down-regulation of the Th1 response and the maintenance of an up-regulated Th2 response without inducing a Th17 response during chronic infection. These results will help to determine which immune system components must be considered for the development of tuberculosis (TB) vaccines and immunological interventions.


Conflict of interest statement

Competing Interests: The authors have declared that no competing interests exist.

Figures

Fig 1
Fig 1. Comparative growth profiles of tested Mtb strains in the lungs during a 112 day-infection.
(A) Early change in Mtb growth during the first 14 days of infection in C57BL/6 mice. (B) The overall growth pattern of tested Mtb strains in C57BL/6 mice. Mice (n = 5 per group at each designated time point) were aerosol challenged with approximately 450 CFU of Mtb H37Ra or with approximately 200 CFU of the H37Rv or the Beijing-K strain. The bacterial burden of their lungs was determined at various time points post-infection. Data are presented as the median log10 CFU of five mice (± IQR) for each time point. A p-value ≤ 0.05 was considered significant: **p < 0.01 (Mtb K vs. Mtb H37Ra) and # p < 0.05 (Mtb K vs. Mtb H37Rv).
Fig 2
Fig 2. Histopathological analysis of lungs infected with different strains of virulent Mtb.
(A) Inflammatory scores of H&E-stained sections of lungs during Mtb infection. At 28, 56, and 112 days post-infection, mice were sacrificed, and lung sections were stained with H&E (n = 5 per group per designated time point). Ten pictures from each group were randomly selected and analyzed (2 pictures per mouse × 5 mice in each group). Lung inflammation scores are presented as the median percentage (± IQR) of inflammation for each mouse. Lung sections were stained with H&E (bar, 500 μm). A p-value ≤ 0.05 was considered significant: *p < 0.05, **p < 0.01 and ***p < 0.001. (B) Representative histopathology and gross pathology of mouse lungs infected with Mtb strains with different virulence levels at 112 days post-infection.
Fig 3
Fig 3. Analysis of innate immune cell kinetics of mice infected with Mtb with different virulence levels.
Single-cell suspensions prepared from lung tissues of mice infected with Mtb strains at days 2, 5, 7, 14, 56 and 112 days post-infection were stained with the indicated antibodies and analyzed by flow cytometry (n = 4 per group per designated time point). (A) Gating strategy for the analysis of innate immune cells present in the in lungs. All surface-stained samples were primarily gated on forward scatter (FSC)mid/high and side scatter (SSC)mid/high and secondarily gated on F4/80-/+ and CD11clow. The cells were analyzed according to the expression of Gr-1 versus CD11b. F4/80-/CD11c-/CD11bhigh/Gr-1high cells were designated as neutrophils (a). The lower population was designated as CD11c-/CD11b+/Gr-1int cells (b). Next, dot-blots of lung cells were primarily gated on FSCmid/high and SSCmid/high and secondarily gated on F4/80- and F4/80+. The cells were analyzed according to the expression of CD11b versus CD11c. F4/80+/CD11c+/CD11b- cells (c), F4/80+/CD11c-/CD11b+ cells (d), F4/80-/CD11cint/CD11bint cells (e), F4/80-/CD11c+/CD11b+ cells (f) and F4/80-/CD11c+/CD11b-/Siglec-H+/PDCA-1+ cells (g) were designated as alveolar macrophages, CD11b+ macrophages, monocytes, CD11bhigh DCs and pDCs, respectively. (B) The line graphs display the absolute numbers of cells in (A) at various time points during Mtb lung infection. *p < 0.05, ***p < 0.001, Mtb K-infected vs. Mtb H37Rv-infected groups. (C) Bar graphs shows the percentage of infiltrated cells in the lungs. *p < 0.05, **p < 0.01, ***p < 0.001, non-infected vs. Mtb-infected groups. The data are presented as the mean (± SD) or four mice per group at each time point from one representative experiment out of two independent experiments. NI: Non-infected; Ra: H37Ra-infected lung; Rv: H37Rv-infected lung; K: Beijing-K-infected lung.
Fig 4
Fig 4. Analysis of T cell kinetics, subtypes, and polarization in Mtb-infected mice.
Single-cell suspensions prepared from lung tissues of mice infected with Mtb strains at 2, 5, 7, 14, 28, 56 and 112 days post-infection. A representative gating strategy (at 112 days post-infection) for the assessment of CD4 T cells, CD8 T cells, Th1, Th2, Th17, and Treg cells is shown in the left panel of (A), (B), and (C). CD4+ and CD8+ T cells were stained with the indicated surface and transcription factor antibodies and analyzed by flow cytometry. (D) Bar graphs display the absolute numbers of CD3+/CD4+ and CD3+/CD8+ T cells in the lungs at 2, 5, 7, 14, 28, 56 and 112 days post-infection. (E) Using CD3+CD4+ T cells as the parent gate, specific staining for the transcription factors T-bet, GATA-3, RORγt and Foxp3 in lung cells from Mtb-infected mice is shown at various time points. Line graphs show the expression of T-bet (Th1 cells), GATA-3 (Th2 cells), RORγt (Th17 cells) and Foxp3 (Tregs) in CD3+/CD4+ T cell populations at the indicated time points. *p < 0.05, **p < 0.01, and ***p < 0.001, Mtb K-infected group vs. Mtb H37Rv-infected group. One representative plot out of two independent experiments is shown.
Fig 5
Fig 5. PPD-specific cytokine response in lung cells from Mtb-infected mice.
The amount of IFN-γ, IL-5, IL-10, IL-17A (A) and IFN-α (B) produced by lung cells (14, 28, 56 and 112 days post-infection) in response to PPD (10 μg/ml) stimulation for 24 h was measured by ELISA. All data are expressed as the mean ± SD (n = 4 per group per designated time point) of one representative experiment out of two independent experiments.
Fig 6
Fig 6. Analysis of T cell proliferation and polarization by CD11bhigh DCs sorted from the lungs of Mtb-infected mice.
(A) Specific populations of CD11bhigh DCs were sorted from the lungs of mice infected with Mtb strains at 7 days post-infection. (B, C, D) CD11bhigh DCs sorted from Mtb-infected mice were treated with OVA peptides (1 μg/ml), such as OVA323-339 or OVA257-264, for 1 h. The OVA-treated CD11bhigh DCs were co-cultured with OVA-specific CD4+ and CD8+ T cells for 3 days at a sorted DC-to-T cell ratio of 1:10. (B) After 3 days of co-culture, the proliferation of OVA-specific CD4+ and CD8+ T cells was assessed by flow cytometry. (C) IFN-γ, IL-2, IL-5, and IL-17A were analyzed by ELISA. (D) CD25+Foxp3+ Treg cells were analyzed after co-culture with CD4+ T cells. The T cell data are shown as the mean ± SD (n = 5 samples). One representative plot out of two independent experiments is shown. *p < 0.05, **p < 0.01, and ***p < 0.001 compared with T cell/OVA-pulsed DCs sorted from non-infected mice. NI-DC: DC from non-infected mice; Ra-DC: DC from H37Ra-infected mice; Rv-DC: DC from H37Rv-infected mice; K-DC: DC from K-infected mice.
Fig 7
Fig 7. Analysis of T cell proliferation and cytokine generation induced by pDCs and Gr-1int cells sorted from the lungs of Mtb-infected mice.
Details regarding this experiment are provided in the materials and methods section. (A) Specific populations of pDCs and Gr-1int cells were sorted from the lung cells of mice infected with Mtb strains at 28 days post-infection. T cell proliferation (B, C) and cytokine production (D-G) in response to pDCs and CD11c-/CD11b+/Gr-1int cells with (yellow bars) and without (white bars) BMDCs were analyzed by flow cytometry after 3 days of co-culture with CFSE-labeled T cells. One representative plot out of two independent experiments is shown. *p < 0.05, **p < 0.01, and ***p < 0.001 compared with the T cell only or the BMDC + T cell group. Ra-pDC: pDC from H37Ra-infected mice; Rv-pDC: pDC from H37Rv-infected mice; K-pDC: pDC from K-infected mice; Ra-Gr-1int: Gr-1int cells from H37Ra-infected mice; Rv-Gr-1int: Gr-1int cells from H37Rv-infected mice; K-Gr-1int: Gr-1int cells from K-infected mice.

References

    1. World Health Organization (2014) Global tuberculosis report 2014. World Health Organization, WHO/HTM/TB. 2014.08.
    1. Leung AN. Pulmonary tuberculosis: the essentials. Radiology. 1999;210(2):307–22. 10.1148/radiology.210.2.r99ja34307 . - DOI - PubMed
    1. Reiling N, Homolka S, Walter K, Brandenburg J, Niwinski L, Ernst M, et al. Clade-specific virulence patterns of Mycobacterium tuberculosis complex strains in human primary macrophages and aerogenically infected mice. MBio. 2013;4(4). 10.1128/mBio.00250-13 - DOI - PMC - PubMed
    1. Hunter RL, Actor JK, Hwang SA, Karev V, Jagannath C. Pathogenesis of post primary tuberculosis: immunity and hypersensitivity in the development of cavities. Ann Clin Lab Sci. 2014;44(4):365–87. . - PubMed
    1. Guidry TV, Hunter RL Jr, Actor JK. Mycobacterial glycolipid trehalose 6,6'-dimycolate-induced hypersensitive granulomas: contribution of CD4+ lymphocytes. Microbiology. 2007;153(Pt 10):3360–9. 10.1099/mic.0.2007/010850-0 - DOI - PMC - PubMed

Publication types

MeSH terms

LinkOut - more resources