

Circulating long noncoding RNA GAS5 levels are correlated to prevalence of type 2 diabetes mellitus
- PMID: 26675493
- PMCID: PMC4661729
- DOI: 10.1016/j.bbacli.2015.09.001
Circulating long noncoding RNA GAS5 levels are correlated to prevalence of type 2 diabetes mellitus
Abstract
Background: Diabetes mellitus (DM), a metabolic disease, is characterized by impaired fasting glucose levels. Type 2 DM is adult onset diabetes. Long non-coding RNAs (lncRNAs) regulate gene expression and multiple studies have linked lncRNAs to human diseases.
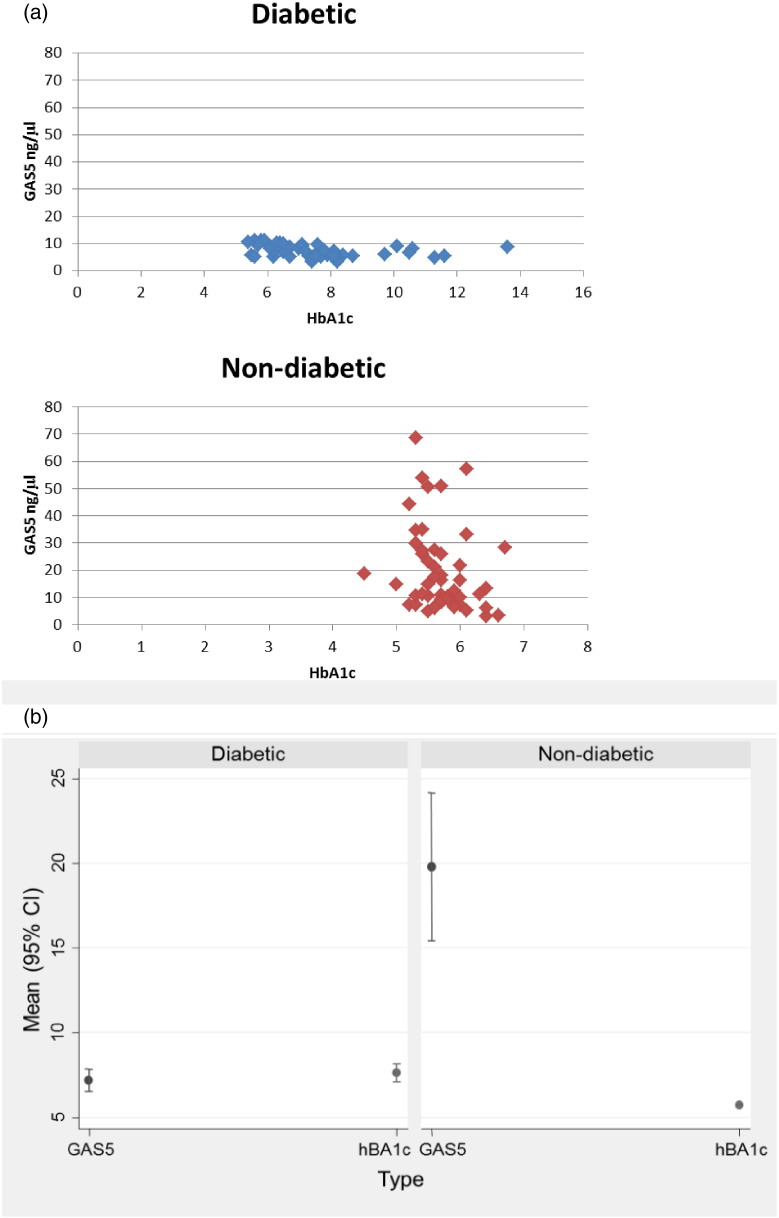
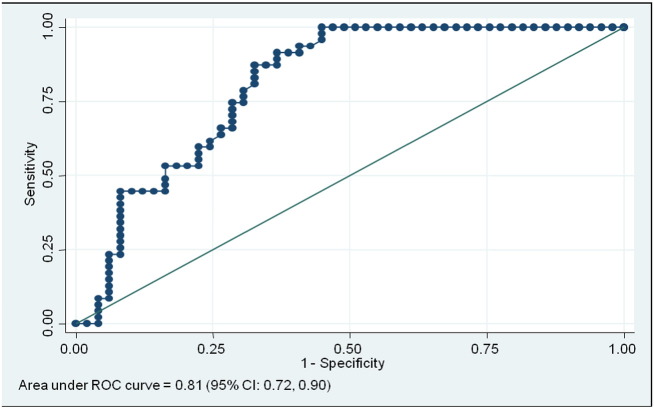
Methods: Serum samples obtained from 96 participating veterans at JAH VA were deposited in the Research Biospecimen Repository. We used a two-stage strategy to identify an lncRNA whose levels correlated with T2DM. Initially we screened five serum samples from diabetic and non-diabetic individuals using lncRNA arrays. Next, GAS5 lncRNA levels were analyzed in 96 serum samples using quantitative PCR. Receiver operating characteristic (ROC) analysis was performed to determine the optimal cutoff GAS5 for diagnosis of DM.
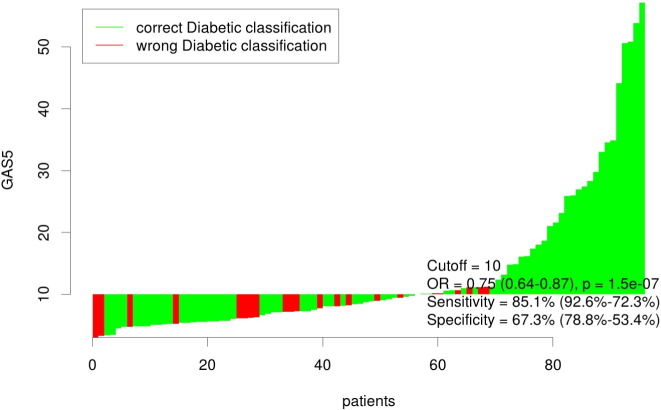
Results: Our results demonstrate that decreased GAS5 levels in serum were associated with diabetes in a cohort of US military veterans. The ROC analysis revealed an optimal cutoff GAS5 value of less than or equal to 10. qPCR results indicated that individuals with absolute GAS5 < 10 ng/μl have almost twelve times higher odds of having diabetes (Exact Odds Ratio [OR] = 11.79 (95% CI: 3.97, 37.26), p < 0.001). Analysis indicated area under curve (AUC) of ROC of 0.81 with 85.1% sensitivity and 67.3% specificity in distinguishing non-diabetic from diabetic subjects. The positive predictive value is 71.4%.
Conclusion: lncRNA GAS5 levels are correlated to prevalence of T2DM.
General significance: Assessment of GAS5 in serum along with other parameters offers greater accuracy in identifying individuals at-risk for diabetes.
Keywords: AUC, area under curve; BMI, body mass index; CI, confidence interval; DM, diabetes mellitus; Diabetes; GAS5; GAS5, growth-arrest specific transcript 5; NMD, nonsense mediated decay; ROC, receiver operating characteristics; Serum; Veterans; lncRNA; lncRNA, long noncoding RNA.
Figures

References
-
- Colosia A.D., Palencia R., Khan S. Prevalence of hypertension and obesity in patients with type 2 diabetes mellitus in observational studies: a systematic literature review. Diabetes Metab. Syndr. Obes. Targets Ther. 2013;6:327–338. Epub 2013/10/02, PubMed PMID: 24082791; PubMed Central PMCID: PMC3785394. - PMC - PubMed
-
- Raj S.M., Halebeedu P., Kadandale J.S., Lahr M.M., Romero I.G., Yadhav J.R., Iliescu M., Rai N., Crivellaro F., Chaubey G., Villems R., Thangaraj K., Muniyappa K., Chandra H.S., Kivisild T. Variation at diabetes- and obesity-associated loci may mirror neutral patterns of human population diversity and diabetes prevalence in India. Ann. Hum. Genet. 2013 Epub 2013/07/03, PubMed PMID: 23808542. - PubMed
-
- Sundborn G., Metcalf P.A., Gentles D., Scragg R., Dyall L., Black P., Jackson R. Overweight and obesity prevalence among adult Pacific peoples and Europeans in the Diabetes Heart and Health Study (DHAHS) 2002–2003, Auckland New Zealand. N. Z. Med. J. 2010;123(1311):30–42. Epub 2010/04/03, PubMed PMID: 20360794. - PubMed
-
- Crawford A.G., Cote C., Couto J., Daskiran M., Gunnarsson C., Haas K., Haas S., Nigam S.C., Schuette R. Prevalence of obesity, type II diabetes mellitus, hyperlipidemia, and hypertension in the United States: findings from the GE Centricity Electronic Medical Record database. Popul. Health Manag. 2010;13(3):151–161. Epub 2010/06/05, PubMed PMID: 20521902. - PubMed
LinkOut - more resources
Full Text Sources
Other Literature Sources
