. 2016 Jan 7;529(7584):43-7.
doi: 10.1038/nature16166. Epub 2015 Dec 16.

Substantial contribution of extrinsic risk factors to cancer development

Affiliations

Substantial contribution of extrinsic risk factors to cancer development

Song Wu et al. Nature. .

Abstract

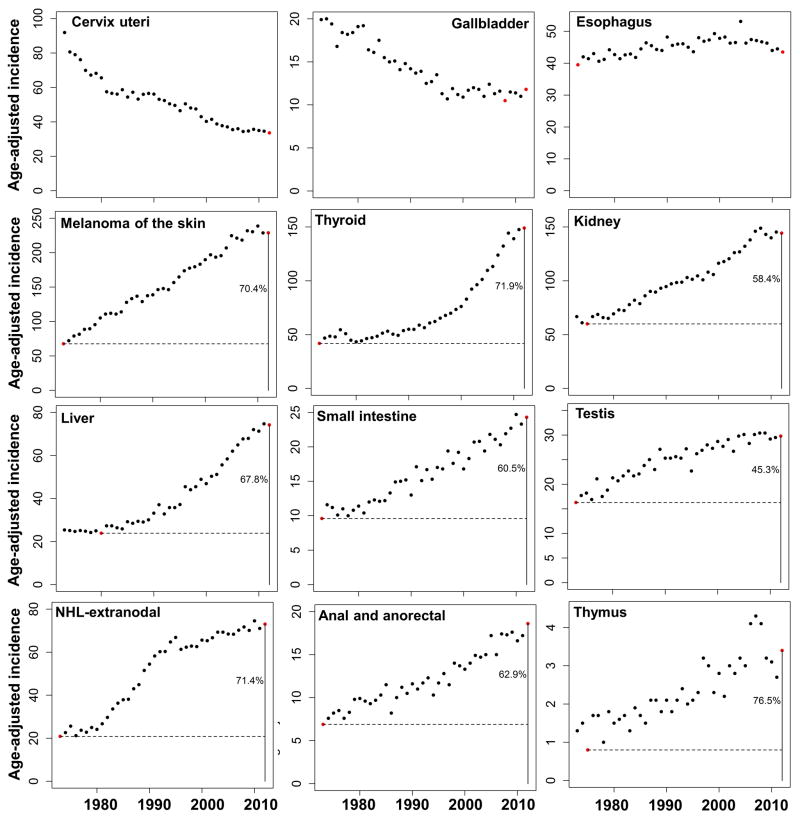
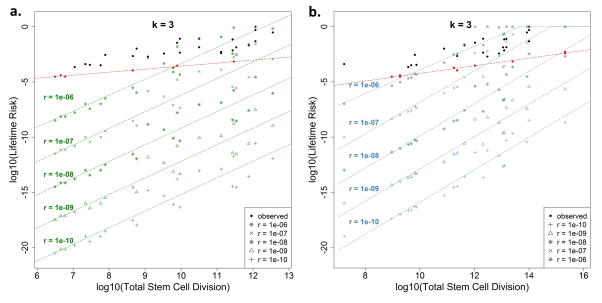
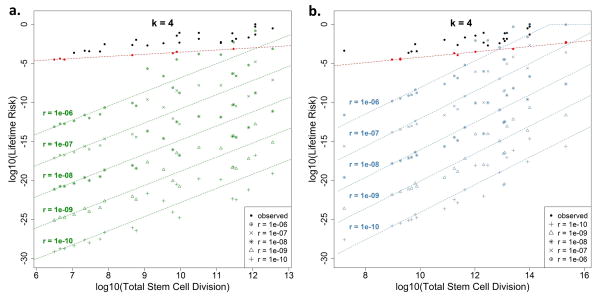
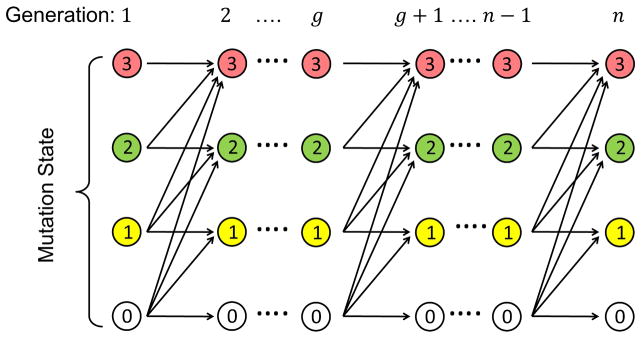
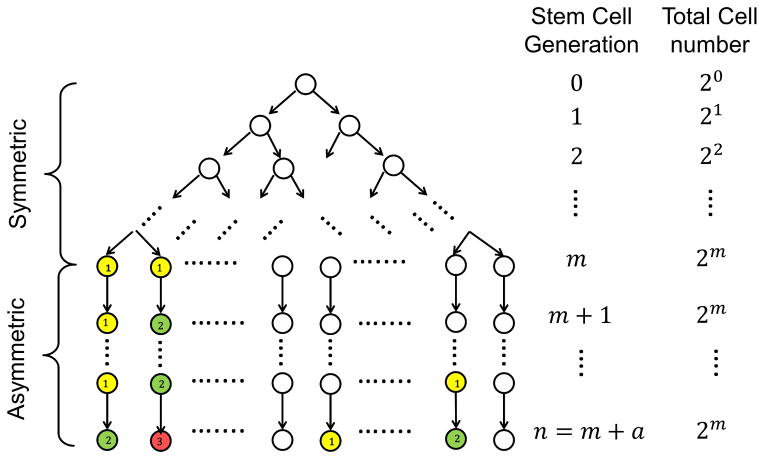
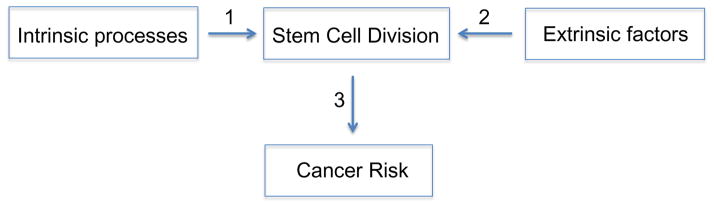
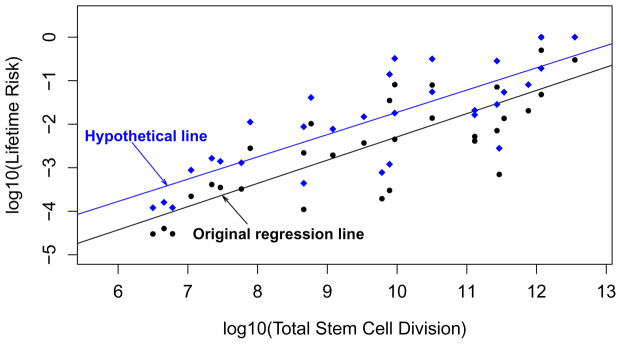
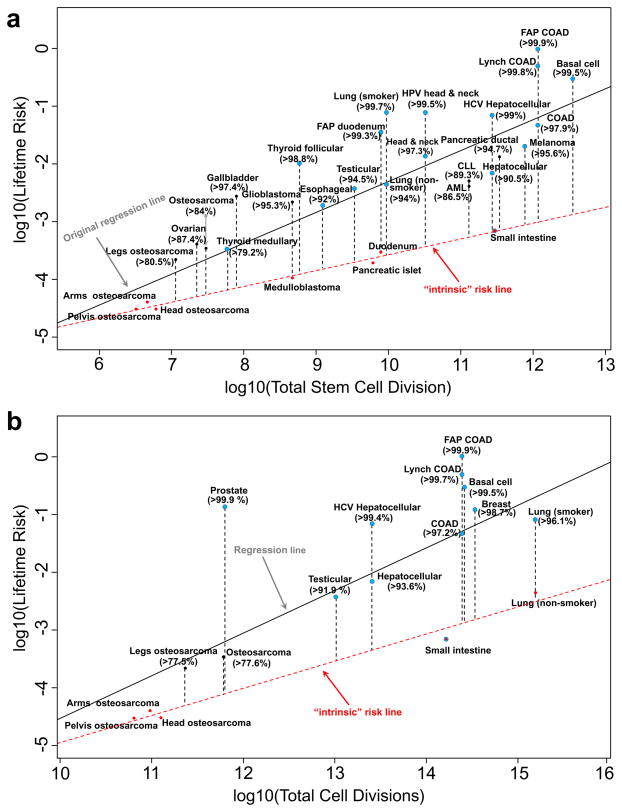
Recent research has highlighted a strong correlation between tissue-specific cancer risk and the lifetime number of tissue-specific stem-cell divisions. Whether such correlation implies a high unavoidable intrinsic cancer risk has become a key public health debate with the dissemination of the 'bad luck' hypothesis. Here we provide evidence that intrinsic risk factors contribute only modestly (less than ~10-30% of lifetime risk) to cancer development. First, we demonstrate that the correlation between stem-cell division and cancer risk does not distinguish between the effects of intrinsic and extrinsic factors. We then show that intrinsic risk is better estimated by the lower bound risk controlling for total stem-cell divisions. Finally, we show that the rates of endogenous mutation accumulation by intrinsic processes are not sufficient to account for the observed cancer risks. Collectively, we conclude that cancer risk is heavily influenced by extrinsic factors. These results are important for strategizing cancer prevention, research and public health.


Conflict of interest statement

The authors declare no competing financial interests.

Figures

Extended Data Figure 1
Extended Data Figure 1. Examples of increased cancer incidence trends from 1973 – 2012
The cancer types include cervix uteri cancer, gallbladder cancer, esophagus cancer, melanoma, thyroid cancer, kidney cancer, liver cancer, small intestine cancer, thymus cancer, anal and anorectal cancer. The horizontal dashed line indicates the historical minimal incidence. The vertical solid line indicates the most recent year. The number represents the minimal percentage of extrinsic risk. The incidence rate is based on per 100,000 people.
Extended Data Figure 2
Extended Data Figure 2. Sensitivity analysis of different mutation rates on tLIR when the number of hits (k) required is 3
Theoretical intrinsic lifetime risks (tLIR) for cancers have been calculated, based on five different mutation rates (r = 1 × 10⁻¹⁰, 1 × 10⁻⁹, 1 × 10⁻⁸, 1 × 10⁻⁷, 1 × 10⁻⁶). The red dashed lines are the “intrinsic” risk lines based on the observed data following the same estimation mechanism as the intrinsic risk line in Fig. 3a. The green (a) and blue (b) dashed lines are the “intrinsic” risk lines estimated based on total reported stem cell numbers and total homeostatic tissue cells, respectively.
Extended Data Figure 3
Extended Data Figure 3. Sensitivity analysis of different mutation rates on tLIR when the number of hits (k) required is 4
Theoretical intrinsic lifetime risks (tLIR) for cancers have been calculated, based on five different mutation rates (r = 1 × 10⁻¹⁰, 1 × 10⁻⁹, 1 × 10⁻⁸, 1 × 10⁻⁷, 1 × 10⁻⁶). The red dashed lines are the “intrinsic” risk lines based on the observed data following the same estimation mechanism as the intrinsic risk line in Fig. 3a. The green (a) and blue (b) dashed lines are the “intrinsic” risk lines estimated based on total reported stem cell numbers and total homeostatic tissue cells, respectively.
Extended Data Figure 4
Intrinsic cancer risk modeling, Part 1/2: Propagation diagram of driver gene mutation states between generations in one stem cell based on which the stem cell mutation transition probabilities from one generation to the next are computed.
Extended Data Figure 5
Intrinsic cancer risk modeling, Part 2/2: Schema of stem-cell divisions and driver gene mutations based on which the theoretical lifetime intrinsic risks (tLIR) for cancer due to k driver gene mutations are computed. Here every colored circle represents the mutation of a new driver gene in the given stem cell (yellow: first mutation; green: second mutation; red: third mutation). If the mutation of 3 designated driver genes would induce a cancerous stem cell (k = 3), then this diagram shows a cancer occurrence as the second stem cell in the last generation (generation n) has accumulated all 3 driver gene mutations.
Figure 1
Figure 1. A schematic view of how intrinsic processes and extrinsic factors are related to cancer risks through stem-cell division
This hypothesis maintains the strong role of stem-cell division in imparting cancer risk, but it also illustrates the potential contributions of both intrinsic and extrinsic factors, both operating through stem-cell division. Other effects, e.g. through division of non-stem cells, are not considered here.
Figure 2
Figure 2. Correlation analysis of stem-cell division and cancer risk does not distinguish contribution of extrinsic vs. intrinsic factors to cancer risk
The black dots are data in Fig. 1 (also tabulated in Supplementary Table S1) of the original work by Tomasetti and Vogelstein. The black line was their original regression line. The blue diamonds represent the hypothesized quadrupled cancer risks due to hypothetical exposure to an extrinsic factor such as radiation. The blue regression line for the hypothetical risk data maintains the same correlation as the original black line, albeit reflecting a much higher contribution of extrinsic factors to cancer risk.
Figure 3
Figure 3. Estimation of the proportion of lifetime cancer risk that is not due entirely to “bad luck” based on: (a). total tissue stem-cell divisions originally reported in Tomasetti and Vogelstein, and (b). total tissue cell divisions
Here red dots are cancers used to compute the “intrinsic” risk linear regression lines (red dashed lines). Blue dots are cancers known to have substantial extrinsic risks from epidemiology studies. The numbers in parentheses are the estimated percentages of cancer risks due to factors other than intrinsic risks.
Figure 4
Figure 4. Theoretical lifetime intrinsic risks (tLIR) for cancers based on different number of hits (k) required for cancer onset
The green (a) and blue (b) dashed lines are the “intrinsic” risk lines estimated based on total reported stem cell numbers and total homeostatic tissue cells, respectively. The intrinsic stem cell mutation rate (r) is assumed to be 1 × 10⁻⁸ per cell division. The red dashed lines are the “intrinsic” risk lines estimated based on the observed data using the same mechanism as Fig. 3a. Adj. Basal and Adj. Melanoma represent cancer risks after adjusting for the effect of sun exposure and UV.

Comment in

References

    1. Sell S. Stem cell origin of cancer and differentiation therapy. Critical reviews in oncology/hematology. 2004;51:1–28. - PubMed
    1. Reya T, Morrison SJ, Clarke MF, Weissman IL. Stem cells, cancer, and cancer stem cells. nature. 2001;414:105–111. - PubMed
    1. Cairns J. Mutation selection and the natural history of cancer. Nature. 1975;255:197–200. - PubMed
    1. Visvader JE. Cells of origin in cancer. Nature. 2011;469:314–322. doi: 10.1038/nature09781. - DOI - PubMed
    1. Tomasetti C, Vogelstein B. Variation in cancer risk among tissues can be explained by the number of stem cell divisions. Science. 2015;347:78–81. doi: 10.1126/science.1260825. - DOI - PMC - PubMed

Publication types