Review
. 2016 Mar 1;310(5):R398-413.
doi: 10.1152/ajpregu.00270.2015. Epub 2015 Dec 16.

Hypoxemia, oxygen content, and the regulation of cerebral blood flow

Affiliations
Review

Hypoxemia, oxygen content, and the regulation of cerebral blood flow

Ryan L Hoiland et al. Am J Physiol Regul Integr Comp Physiol. .

Abstract

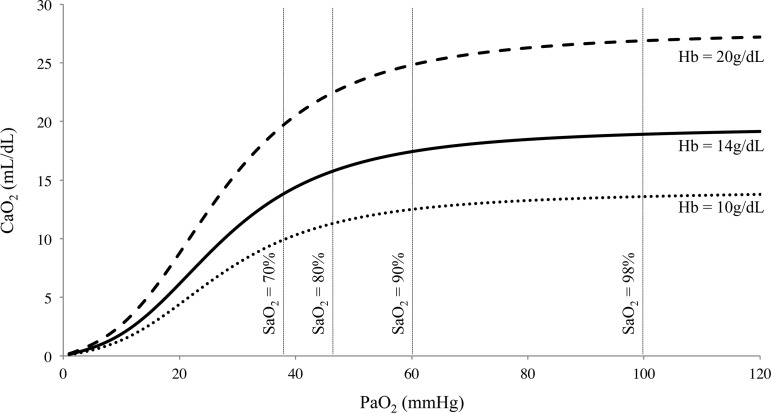
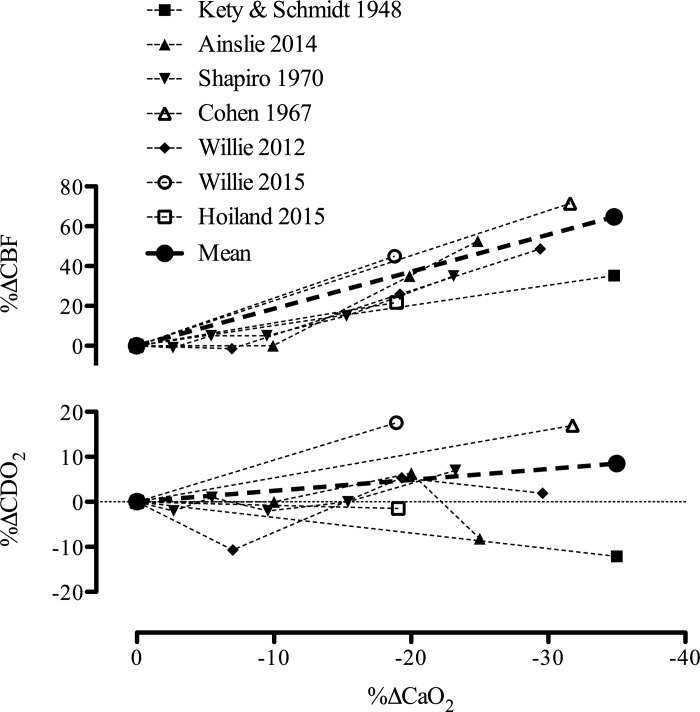
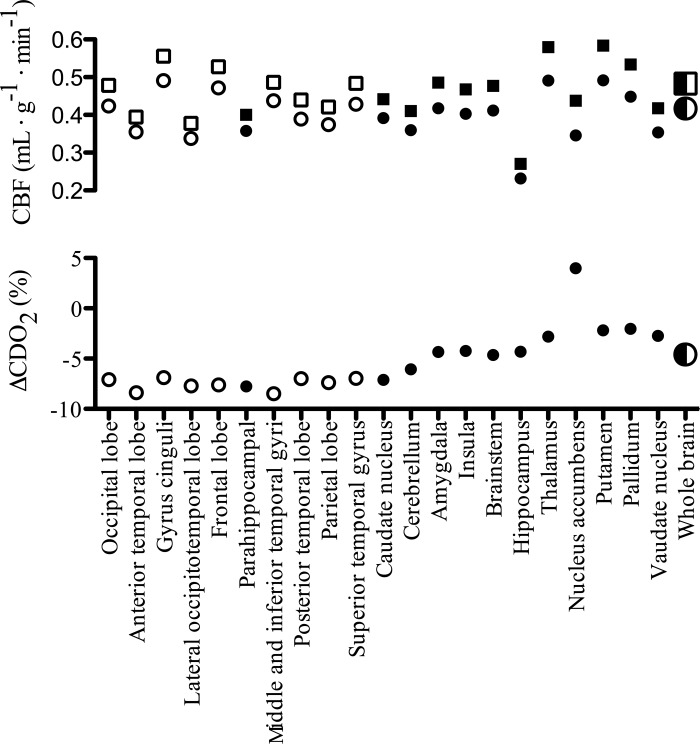
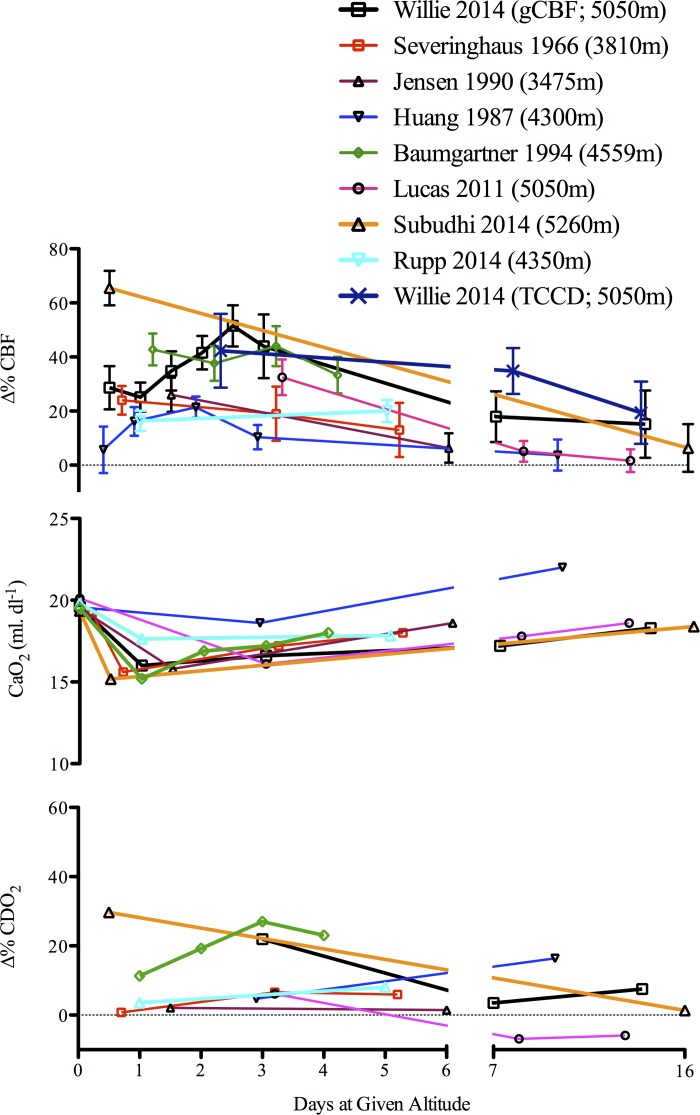
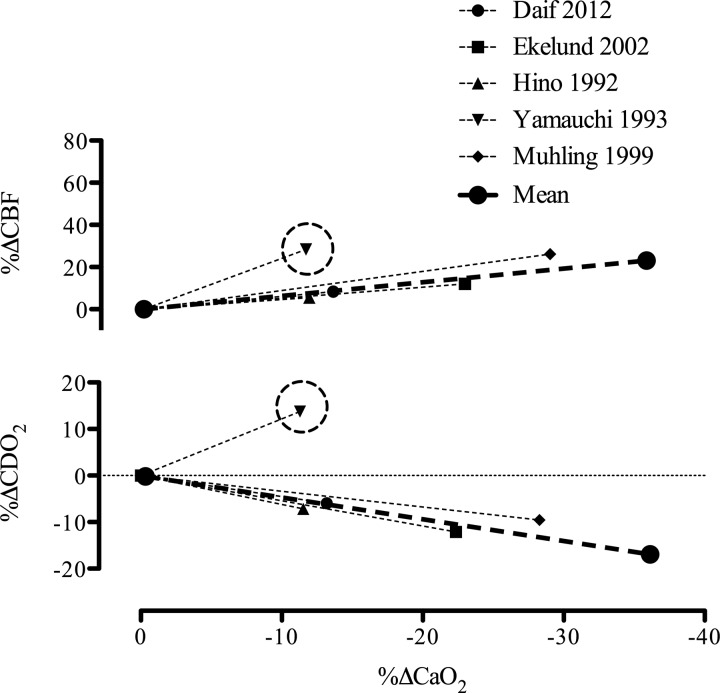
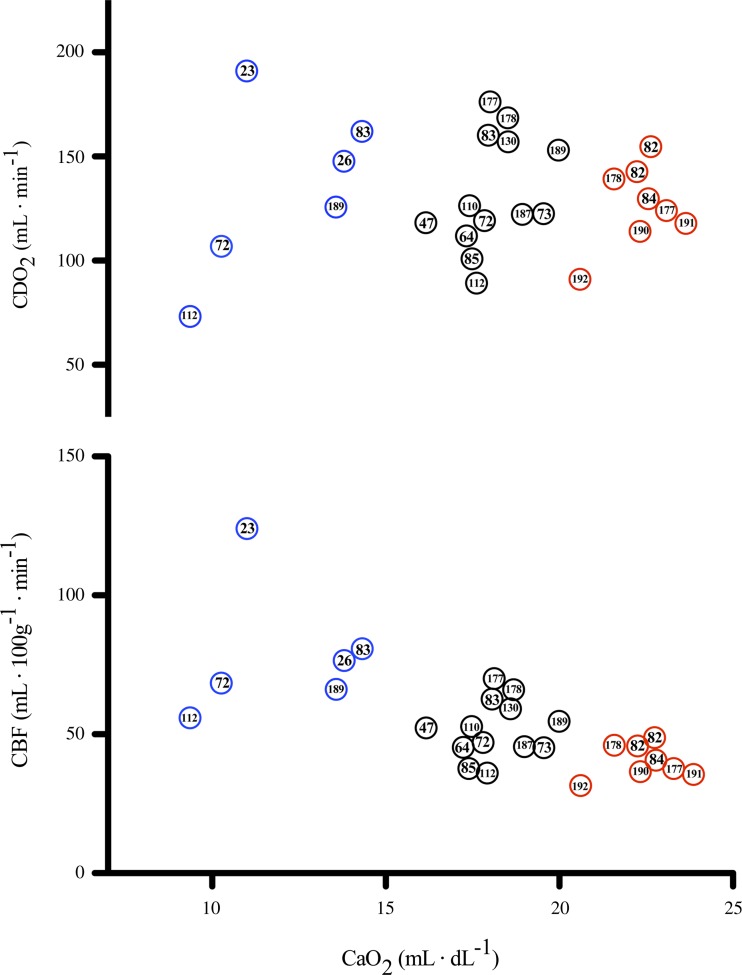
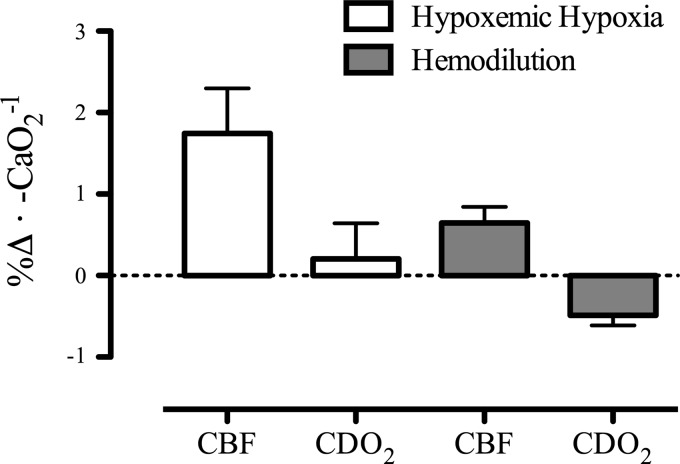
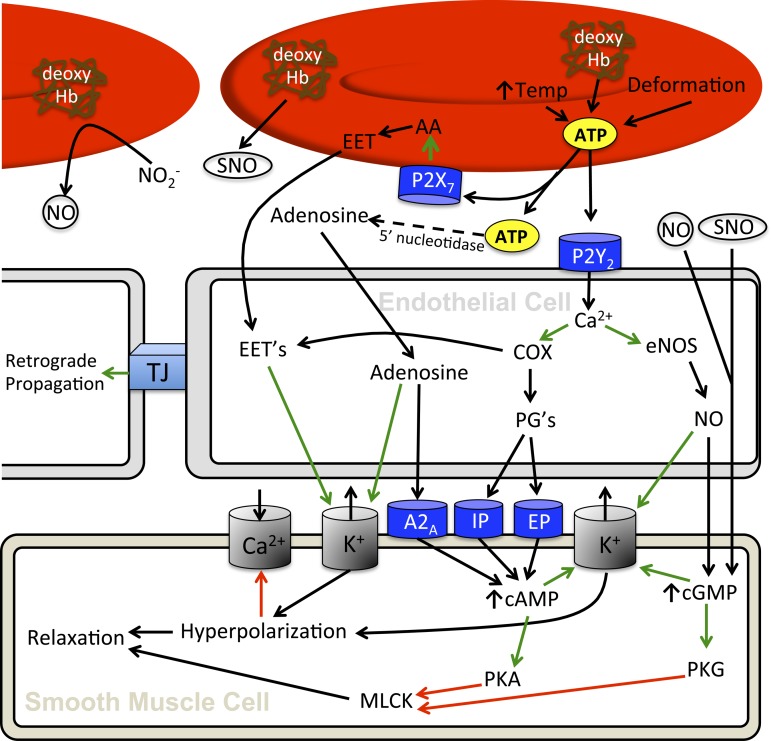
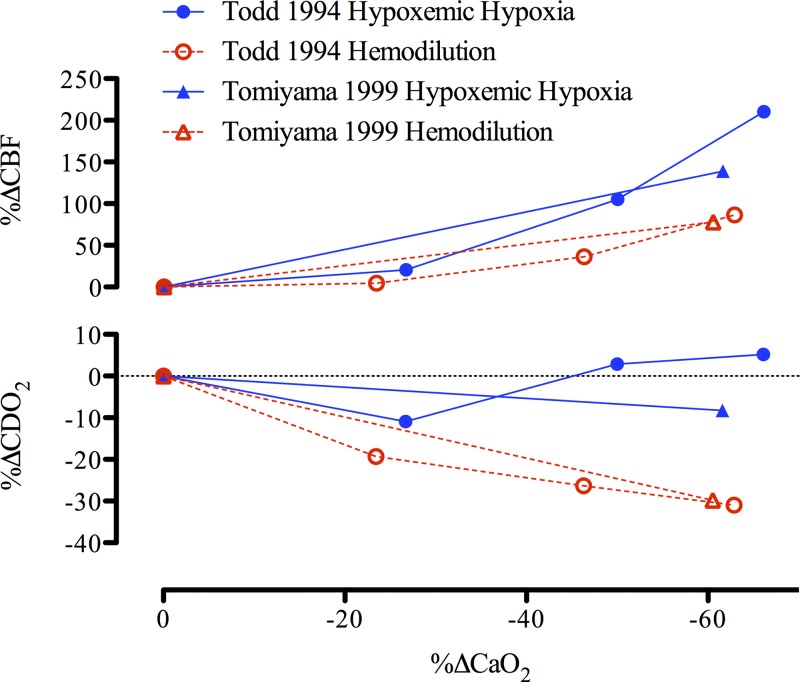
This review highlights the influence of oxygen (O2) availability on cerebral blood flow (CBF). Evidence for reductions in O2 content (CaO2 ) rather than arterial O2 tension (PaO2 ) as the chief regulator of cerebral vasodilation, with deoxyhemoglobin as the primary O2 sensor and upstream response effector, is discussed. We review in vitro and in vivo data to summarize the molecular mechanisms underpinning CBF responses during changes in CaO2 . We surmise that 1) during hypoxemic hypoxia in healthy humans (e.g., conditions of acute and chronic exposure to normobaric and hypobaric hypoxia), elevations in CBF compensate for reductions in CaO2 and thus maintain cerebral O2 delivery; 2) evidence from studies implementing iso- and hypervolumic hemodilution, anemia, and polycythemia indicate that CaO2 has an independent influence on CBF; however, the increase in CBF does not fully compensate for the lower CaO2 during hemodilution, and delivery is reduced; and 3) the mechanisms underpinning CBF regulation during changes in O2 content are multifactorial, involving deoxyhemoglobin-mediated release of nitric oxide metabolites and ATP, deoxyhemoglobin nitrite reductase activity, and the downstream interplay of several vasoactive factors including adenosine and epoxyeicosatrienoic acids. The emerging picture supports the role of deoxyhemoglobin (associated with changes in CaO2 ) as the primary biological regulator of CBF. The mechanisms for vasodilation therefore appear more robust during hypoxemic hypoxia than during changes in CaO2 via hemodilution. Clinical implications (e.g., disorders associated with anemia and polycythemia) and future study directions are considered.

Keywords: adenosine triphosphate; cerebral blood flow; cerebral oxygen delivery; hypoxia; nitric oxide.


Figures

Fig. 1.
Fig. 1.
Diagram of the relationship between oxygen content (CaO2) and the partial pressure of oxygen in arterial blood (PaO2). Reduced hemoglobin (Hb) concentration during anemia or following hemodilution (bottom dotted curve) decreases CaO2. Increased hemoglobin as would occur in polycythemia (top dashed curve) increases CaO2. The middle solid line denotes normal resting values. Figure derived from Eq. 3: CaO2 (ml/dl) = [Hb]·1.36·(%SaO2/100) + 0.003·PaO2.
Fig. 2.
Fig. 2.
Cerebral blood flow (CBF) and oxygen delivery (CDO2) during acute hypoxemic hypoxia in humans. Data taken from five studies during hypoxemic hypoxia with concurrent measures of CBF and arterial blood gases. As exceptions we used data from Refs. and , where Eq. 3 was used to calculate CaO2 with SaO2 estimated using the Severinghaus equation (167). Data from 55 healthy subjects are depicted; i.e., n = seven (108), ten (4), six (169), nine (29), ten (199), nine (200), and four (75). The mean lines for both CBF and CDO2 have been calculated as the linear slope from the mean data of each study weighted for sample size. All studies were conducted under isocapnic conditions except for Ref. , where PaCO2 was reduced by 4 mmHg during the hypoxic exposure.
Fig. 3.
Fig. 3.
Regional disparities in cerebral oxygen delivery (CDO2) relative to the whole brain during isocapnic hypoxia. The top panel depicts regional cerebral blood flow during normoxia (circles) and hypoxia (FiO2* = 0.10; squares) in phylogenetically new (open symbols) and old (closed symbols) brain regions as measured by positron emission tomography. These values can be compared with their respective whole brain flow values (half-filled symbols). The lower panel highlights the heterogeneous changes in CDO2 relative to the whole brain (half-filled circle), and a trend for CDO2 of newer brain regions to be less impacted by hypoxia then phylogenetically older regions. CDO2 was calculated assuming a uniform [Hb] of 15 g/dl and O2 affinity of 1.36. Data adapted from Ref. .
Fig. 4.
Fig. 4.
Cerebral blood flow (CBF) and oxygen delivery (CDO2) at high altitude. Percent change in cerebral blood flow (Δ%CBF) during acclimation (>4 days above 3,400 m) in the eight studies at various altitudes reviewed in Ref. (11, 79, 96, 119, 158, 166, 175, 201), and one recent investigation following 5 days at 4,350 m (158). As depicted, CDO2 is maintained at high-altitude due to the compensatory increase in CBF. As all studies were conducted during hypobaric hypoxia, PaCO2 was not controlled. TCCD, transcranial color-coded Doppler; gCBF, global cerebral blood flow. [Adapted from Ainslie and Subudhi (5) with permission. Copyright Mary Ann Liebert, Inc.]
Fig. 5.
Fig. 5.
Cerebral blood flow (CBF) and oxygen delivery (CDO2) during hemodilution in humans. Data taken from five studies utilizing hemodilution and concurrent measures of CBF and arterial blood gases. The subject samples include 20 anesthetized tumor resection patients prior to surgery (filled circle) (33), eight patients with vasospasm following aneurysmal subarachnoid hemorrhage (filled square) (47), eight young healthy volunteers (upwards triangle) (73), five patients with unilateral internal carotid artery occlusion in addition to previous stroke or transient ischemic attacks (downwards triangle) (211), and 11 healthy young volunteers (filled diamond) (130), totaling 47 subjects [as all of the data collected in clinical patients, except for that of Ref. (circled data point), followed the same trend as the studies using healthy patients, the data from Ref. have been excluded from our representation of mean data]. Indeed, the unilateral internal carotid artery occlusion would have influenced CBF regulation and in turn likely explains the larger increase in CBF (on the patent side). The mean lines for both the CBF and CDO2 graphs have been calculated as the linear slope from the mean data of each study weighted for sample size.
Fig. 6.
Fig. 6.
The relationship between CaO2, CBF, and CDO2 in anemic, hematologically normal, and polycthemic humans. Data were collated from 20 separate studies to highlight the relationship between CaO2 and CBF. Top: across studies there appears to be a relatively linear inverse relationship between CaO2 and CBF, with higher CaO2 concomitant to a reduced CBF, and lower CaO2 concomitant to increased CBF. Bottom: despite reductions in CaO2, the CBF increase is adequate to maintain CDO2. Across the presented studies there appears to be variability in CDO2 at any given CaO2; however, there is no distinct relationship between changes in CaO2 and CDO2. Thus it seems that CDO2 is preserved in anemic hypoxia and maintains a normal level during polycythemia due to a reduced CBF. Data are referenced by study number and collated from (, , , , , , –, , , , , , , –192).
Fig. 7.
Fig. 7.
Change in cerebral blood flow (CBF) and oxygen delivery (CDO2) during reductions in arterial oxygen content (CaO2) induced by hypoxemic hypoxia and hemodilution. The mean slope increase in CBF is 0.66%CBF/−%CaO2 during hemodilution and 1.85%CBF/−%CaO2 during hypoxemic hypoxia. During hypoxemic hypoxia CDO2 is maintained with a 0.24%CDO2/−%CaO2 slope response, whereas during hemodilution, CDO2 is compromised with a −0.47%CDO2/−%CaO2 slope decrease with reduced CaO2. Error bars represent SD of the mean slopes from each study used in Figs. 2 and 5.
Fig. 8.
Fig. 8.
Putative pathways regulating cerebral blood flow during hypoxia. Increased temperature, erythrocyte deformation, and the conformational change concomitant to transition of oxy- to deoxyhemoglobin all signal erythrocyte mediated release of ATP (16, 49, 104, 173). Released ATP can then bind to the erythrocyte P2X7 receptor in an autocrine fashion to induce erythrocyte mediated EET release (101), which will increase vascular smooth muscle cell K+ channel conductance (59). The released ATP also binds endothelial P2Y2 receptors to initiate a signal cascade involving NO and potentially PGs (212). Moreover, ATP will break down into AMP and subsequently adenosine (58) that will also exert a vasodilatory effect on vascular smooth muscle through binding adenosine A2A receptors (71, 103), increasing cAMP levels (136, 161) and also through increasing inward rectify potassium channel conductance (71). Prostaglandins, if implicated, bind IP and EP receptors (35) which increases intracellular cAMP (133). NO, derived from the endothelium, through the nitrite reductase activity of erythrocytes (30), and S-nitrosohemoglobin (117, 174) will lead to increased guanylate cyclase activity and cGMP (145) as well as directly increase K+ channel conductance (20). Cyclic nucleotides will upregulate cAMP-dependent protein kinase (PKA) and cGMP-dependent protein kinase (PKG) activity, which act to inhibit myosin light chain kinase (MLCK; 1), and therefore, reduce smooth muscle tone (107). Cyclic nucleotides will also increase potassium channel conductance (172), with increased potassium efflux hyperpolarizing cells and reducing activity of voltage-gated Ca2+ channels (134). Overall, ATP leads to vasodilation that can be conducted through gap junctions (41, 102). Green arrows represent activation of a downstream factor, and red arrows represent inhibition of downstream factors.
Fig. 9.
Fig. 9.
Differential changes in cerebral blood flow (CBF) during hypoxemic hypoxia and hemodilution and the impact on cerebral oxygen delivery (CDO2) in animals. The CBF response to both hypoxemic hypoxia and hemodilution in animals is presented (181, 182). Despite similar reductions in CaO2 between conditions, the CBF response (%Δ from baseline) is ∼100% greater during hypoxemic hypoxia than hemodilution. Consequently, CDO2 is reduced during hemodilution but not hypoxemic hypoxia.

References

    1. Adelstein R, Conti M. Phosphorylation of smooth muscle myosin catalytic subunit of adenosine 3′,5′-monophosphate-dependent protein kinase. J Biol Chem 253: 8347–8350, 1978. - PubMed
    1. Ainslie PN, Ogoh S. Regulation of cerebral blood flow in mammals during chronic hypoxia: a matter of balance. Exp Physiol 95: 251–262, 2010. - PubMed
    1. Ainslie PN, Poulin MJ. Ventilatory, cerebrovascular, and cardiovascular interactions in acute hypoxia: regulation by carbon dioxide. J Appl Physiol 97: 149–159, 2004. - PubMed
    1. Ainslie PN, Shaw AD, Smith KJ, Willie CK, Ikeda K, Graham J, Macleod DB. Stability of cerebral metabolism and substrate availability in humans during hypoxia and hyperoxia. Clin Sci (Lond) 126: 661–670, 2014. - PubMed
    1. Ainslie PN, Subudhi AW. Cerebral blood flow at high altitude. High Alt Med Biol 15: 133–140, 2014. - PubMed

LinkOut - more resources