. 2016 Feb 15;76(4):927-39.
doi: 10.1158/0008-5472.CAN-15-2321. Epub 2015 Dec 16.

miR-34a Silences c-SRC to Attenuate Tumor Growth in Triple-Negative Breast Cancer

Affiliations

miR-34a Silences c-SRC to Attenuate Tumor Growth in Triple-Negative Breast Cancer

Brian D Adams et al. Cancer Res. .

Abstract

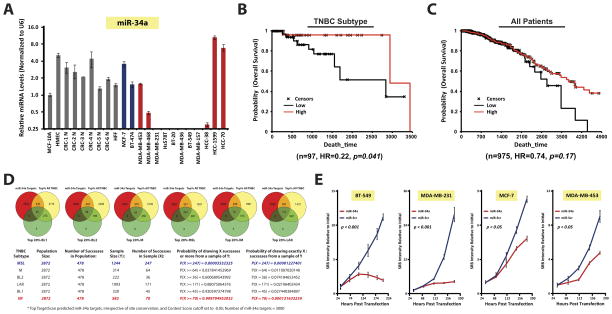
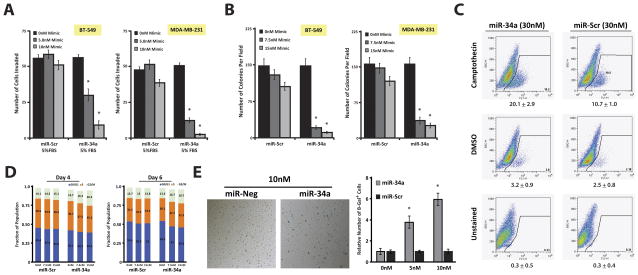
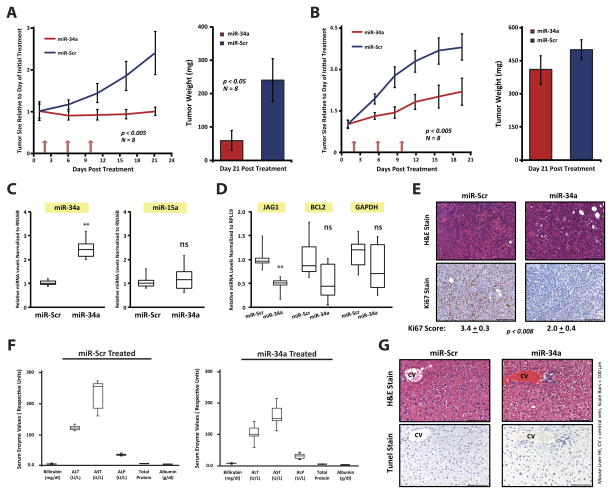
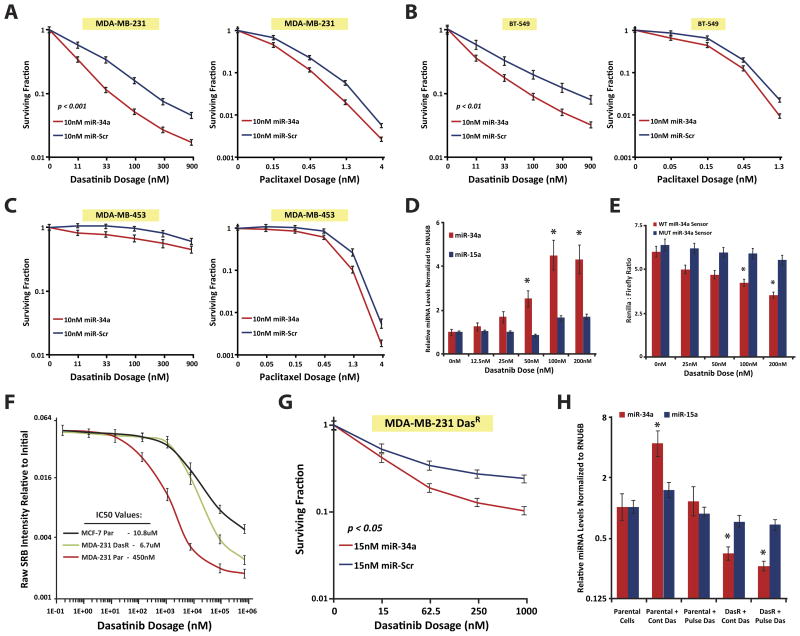
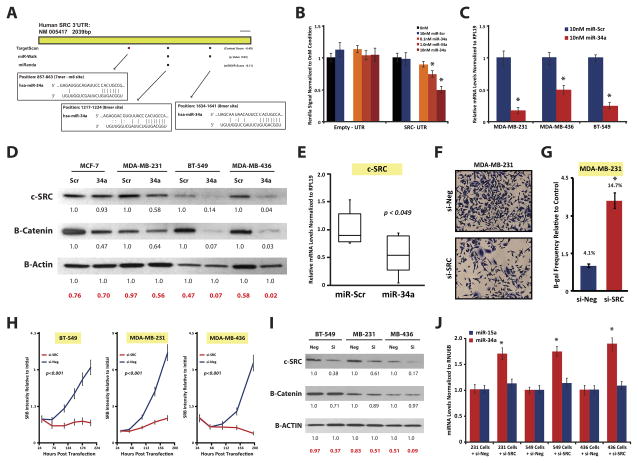
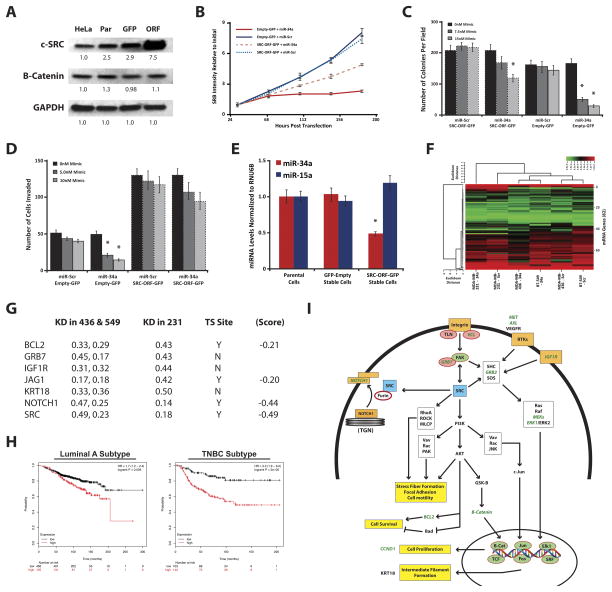
Triple-negative breast cancer (TNBC) is an aggressive subtype with no clinically proven biologically targeted treatment options. The molecular heterogeneity of TNBC and lack of high frequency driver mutations other than TP53 have hindered the development of new and effective therapies that significantly improve patient outcomes. miRNAs, global regulators of survival and proliferation pathways important in tumor development and maintenance, are becoming promising therapeutic agents. We performed miRNA-profiling studies in different TNBC subtypes to identify miRNAs that significantly contribute to disease progression. We found that miR-34a was lost in TNBC, specifically within mesenchymal and mesenchymal stem cell-like subtypes, whereas expression of miR-34a targets was significantly enriched. Furthermore, restoration of miR-34a in cell lines representing these subtypes inhibited proliferation and invasion, activated senescence, and promoted sensitivity to dasatinib by targeting the proto-oncogene c-SRC. Notably, SRC depletion in TNBC cell lines phenocopied the effects of miR-34a reintroduction, whereas SRC overexpression rescued the antitumorigenic properties mediated by miR-34a. miR-34a levels also increased when cells were treated with c-SRC inhibitors, suggesting a negative feedback exists between miR-34a and c-SRC. Moreover, miR-34a administration significantly delayed tumor growth of subcutaneously and orthotopically implanted tumors in nude mice, and was accompanied by c-SRC downregulation. Finally, we found that miR-34a and SRC levels were inversely correlated in human tumor specimens. Together, our results demonstrate that miR-34a exerts potent antitumorigenic effects in vitro and in vivo and suggests that miR-34a replacement therapy, which is currently being tested in human clinical trials, represents a promising therapeutic strategy for TNBC.


Conflict of interest statement

Disclosure of Conflicts of Interest: FJS is an advisor and shareholder in Mirna Therapeutics, which is conducting clinical trials with miR-34 in liver cancer. Other authors have no conflicts of interest to disclose.

Figures

Figure 1
Figure 1. miR-34a is aberrantly expressed in mesenchymal-TNBC and is prognostic
A, qPCR analysis of miR-34a levels in normal breast (gray), Luminal-A cancer (blue), Basal cancer (red) cell lines. B and C, Kaplan-Meier and Cox-regression analysis of miR-34a levels and overall survival in TNBC (B) or all (C) breast cancer patients from TCGA datasets. D, Hypergeometric analysis(55) of miR-34a targets present within each TNBC-subtype as compared all highly expressed TNBC genes. Specifically, Venn diagrams depict the top 20% most abundant TNBC genes (yellow) and TNBC-subtype genes (green) from Pietenpol et al.(6) as compared to all putative miR-34a targets (red). Table depicts the number of miR-34a targets in all TNBC (Number of Successes in Population), and in each TNBC subtype (Number of Successes in Sample), along with the probabilities of success. The probabilities of having X number, or >X number of miR-34a target sites within each TNBC subtype and compared to all TNBC are reported. P<0.05 was considered significant. E, SRB growth curves, where various cell lines were transfected with 30nM miR-34a and assayed at indicated times for enumerating cell abundance. SRB assays were performed three independent times with error bars reflecting SEM for each condition or time point analyzed. P-values were calculated by two-way ANOVA.
Figure 2
Figure 2. miR-34a is tumor-suppressive and promotes cytostasis in mesenchymal-TNBC cells
A, BT-549 and MDA-MB-231 cells were transfected with indicated amounts of miR-Scr or miR-34a mimic, serum starved, and plated into Matrigel-coated Boyden chambers with 5% serum as the chemo-attractant. Values reported are the average number of invaded cells counted per field. B, BT-549 and MDA-MB-231 transfected cells were seeded into 0.3% soft agar and after 25 days the number of colonies were counted. C, MDA-MB-231 transfected cells (30nM miRNA) were treated with either 20μM Camptothecin, 0.1% DMSO vehicle, or left untreated, and stained with FITC-VAD-FMK to detect the percentage of apoptotic cells. MiR-34a cells have a heightened percentage of cells undergoing active caspase cleavage only when concomitantly provided Camptothecin, a quinolone alkaloid known to induce apoptosis. Values under each FACS plot indicate average number or apoptotic events per condition +/− SEM. D, MDA-MB-231 transfected cells at indicated times and dose were stained with PI for cell cycle analysis. Numbers in bar graphs represent average percent of cells within each stage of cell cycle, and as a fraction of the total population within each condition. E, MBA-MB-231 cells, 6 days post-transfection were stained with SA-β-Gal. Presence of blue perinuclear staining emerged in the miR-34a condition (left panel), which is quantified as an average number of SA-β-Gal positive cells from three independent experiments +/-SEM (right panel). * Indicates p<0.01, as compared to control conditions.
Figure 3
Figure 3. tNP-packaged miR-34a nanoparticles harbor therapeutic efficacy in vivo
A, CrTac:NCr-Foxn1nu mice containing subcutaneously implanted MDA-MB-231 cells embedded in Matrigel were treated intratumorally with NLE-packaged miR-34a or miR-Scr control particles at a 25μg/tumor dose (left panel). Green arrows indicate treatment times. At end of study tumor weights were collected (right panel). All data are depicted as an average tumor size from 8 mice +/− SEM. B, CrTac:NCr-Foxn1nu mice containing orthotopically implanted MDA-MB-231 cells were treated with tNP-packaged miR-34a or miR-Scr control particles. Green arrows indicate times at which mice were given tail vein injections of miRNA-tNP particles at a 1.35mg/kg dose. Tumor weights are depicted in right panel. All data are depicted as an average tumor size from 8 mice +/− SEM. C and D, miRNA (C) and target mRNA (D) analysis of tumor RNA from each treatment cohort in the miRNA-tNP trial, n=6, ** indicates p<0.05. E, Representative H&E (top) and Ki67 (bottom) staining images from treated mice; scale bars, 100μm. Ki67 staining is depicted as an average score (n=6). F and G, MiRNA toxicity studies. Liver panel analysis on mouse serum from each miRNA-tNP treatment cohort (n=5) (F), and representative images of liver tissue stained with H&E (top) and TUNEL (bottom); scale bars, 100μm (G).
Figure 4
Figure 4. miR-34a sensitizes mesenchymal-TNBC cells to dasatinib
A–C, Clonogenic assays were performed in mesenchymal-TNBC MDA-MB-231 (A) and BT-549 cells (B), as well as LAR-TNBC MDA-MB-453 cells (C). After 10nM miR-34a (red line) or miR-Scr (blue line) transfection, cells were plated at low cell densities in 0–900nM dasatinib (left panels), or 0–4nM paclitaxel (right panels), and resultant colonies were counted 10 days later. Data are presented as the surviving fraction as relative to the 0nM condition for each miRNA treatment condition. (D) qPCR assessment of miR-34a levels in dasatinib treated MDA-MB-231 cells for 60 hours. (E) miR-34a activity assays using a psiCheck2 3′UTR luciferase reporter in MDA-MB-231 cells. Cells were transfected with sensor constructs (WT=fully complementary miR-34a element (red), or a MUT=mutated miR-34a element (blue)) and treated with the indicated dasatinib doses for 48hrs. (F) Dasatinib IC50 curves of MDA-MB-231-DasR cells (green line), dasatinib sensitive parental MDA-MB-231 cells (red line), and dasatinib insensitive MCF-7 cells (black line). (G) Clonogenic assays performed in MDA-MB-231-DasR cells, with indicated doses of dasatinib. (H) qPCR assessment of miR-34a levels in MDA-MB-231-DasR or parental cells either pulsed or maintained continuously in 100nM dasatinib for 60hrs. P-values of clonogenic assays were calculated by two-way ANOVA. * Indicates p<0.05, as compared to control conditions.
Figure 5
Figure 5. The proto-oncogene c-SRC is a target of miR-34a
A, Schematic depicting the human SRC 3′UTR using the indicated miRNA targeting algorithms, where blue boxes indicated conserved sites, and orange boxes are non-conserved sites. B, 3′UTR luciferase assays whereby 293T cells were co-transfected with either an Empty or full length SRC 3′UTR luciferase construct along with miRNA mimics at the doses as indicated. C–D, qPCR assessment of SRC mRNA levels (C) and western blot analysis of c-SRC expression (D) 72 hours post 10nM miR-34a transfection in the indicated cell lines. E, c-SRC mRNA levels from orthotopically implanted MDA-MB-231 tumors after miR-34a-tNP treatment. F, MDA-MB-231 cells transfected with 15nM si-SRC or si-Neg control, and after 5 days cells were fixed and stained with crystal violet. G, Quantification of SA-β-gal activity in MDA-MB-231 cells 6 days post 15nM siRNA transfection. H–J, Characterization of siRNA transfected TNBC cells (15nM) by SRB growth assays (H), siRNA knockdown efficiency by western blot analysis (I) (Neg=si-Neg, and Si=si-SRC), and by assessment of miRNA levels via qPCR (J). In all experiments cells were transfected with 15nM siRNA, and assayed 72 hours post-transfection unless indicated otherwise. Values below each western blot represent the mean densitometric measurement of band intensities relative to the miR-Scr control treatment within each cell line. The numbers highlighted in red indicate SRC/β-actin ratios for each condition. * Indicates p<0.05, as compared to control conditions. P-values of SRB assays were calculated by two-way ANOVA.
Figure 6
Figure 6. c-SRC overexpression rescues miR-34a-induced phenotypes and is part of miR-34a gene signature
A, Western blot analysis measuring c-SRC, β-catenin, and GAPDH expression in c-SRC-ORF (ORF), GFP-EMPTY (GFP), and parental (Par) MDA-MB-231 cell lines. Values below each blot represent the mean densitometric measurement. B–D, Characterization of SRC-ORF-based rescue experiments. For SRB growth assays, c-SRC-ORF (ORF) and GFP-EMPTY (GFP) lines were transfected with 15nM miR-34a or miR-Scr control, and assayed at indicated time points (B). miR-34a transfected c-SRC-ORF (ORF) and GFP-EMPTY (GFP) lines at indicated doses were assayed for growth in soft agar (C), for invasion potential in Matrigel-Boyden chamber assays (D), and for miR-34a levels via qPCR analysis. E, Levels of miR-34 and miR-15a in c-SRC-ORF, GFP-EMPTY, and parental MDA-MB-231 cell lines. F, Heat map representing log2 transformed qPCR array data from TNBC cells 72 hours post-transfection with either 10nM miR-Scr or miR-34a. Data was normalized to the geometric mean of B2M and RPLP0 levels, and presented as Euclidean distance with average linkage using CIMminer. G, Table depicting a miR-34a gene signature consisting of 7 genes whose expression decreases 2-fold or more when treated with miR-34a, across three different TNBC cell lines. Data originated from qPCR breast cancer array experiments on RNA isolates 72hrs post miR-34a transfection. Values in table represent fold change in gene expression levels in each cell line relative to the miR-Scr control treatment. TS=TargetScan predicted site, (Score)=context score from TargetScan algorithm. H, Kaplan-Meier and Cox-regression analysis of the 7-gene miR-34a gene signature and overall survival in both Luminal-A (left panel) and TNBC (right panel) breast cancer patients from the KM-plotter Affymetrix array dataset(38). I, Diagram depicting the intersection of miR-34a and the c-SRC signaling pathway. Orange boxes indicate receptors, green circles depict intracellular adaptor proteins and kinases, and SRC is highlighted in blue. Experimentally validated miR-34a targets are indicated by italicized green text. For brevity, particular signaling modules are shown as boxes containing keys genes within the pathway. * Indicates p<0.05, as compared to control conditions.

References

    1. Liedtke C, Gonzalez-Angulo A, Pusztai L. PPO Updat Princ Pract Oncol. 2. Vol. 24. New York: Lippincott Williams & Wilkins; 2010. Definition of triple-negative breast cancer and relationship to basal-like molecular subtype; pp. 1–6.
    1. Dent R, Trudeau M, Pritchard KI, Hanna WM, Kahn HK, Sawka CA, et al. Triple-negative breast cancer: clinical features and patterns of recurrence. Clin Cancer Res. 2007;13:4429–34. - PubMed
    1. Haffty BG, Yang Q, Reiss M, Kearney T, Higgins SA, Weidhaas J, et al. Locoregional relapse and distant metastasis in conservatively managed triple negative early-stage breast cancer. J Clin Oncol. 2006;24:5652–7. - PubMed
    1. Metzger-Filho O, Sun Z, Viale G, Price KN, Crivellari D, Snyder RD, et al. Patterns of Recurrence and Outcome According to Breast Cancer Subtypes in Lymph Node-Negative Disease: Results From International Breast Cancer Study Group Trials VIII and IX. J Clin Oncol. 2013 JCO.2012.46.1574–. - PMC - PubMed
    1. Perou CM, Sørlie T, Eisen MB, van de Rijn M, Jeffrey SS, Rees CA, et al. Molecular portraits of human breast tumours. Nature. 2000;406:747–52. - PubMed

Publication types