. 2016 Feb 1;76(3):749-61.
doi: 10.1158/0008-5472.CAN-15-2198. Epub 2015 Dec 16.

Integrated Genomic Analysis of Pancreatic Ductal Adenocarcinomas Reveals Genomic Rearrangement Events as Significant Drivers of Disease

Affiliations

Integrated Genomic Analysis of Pancreatic Ductal Adenocarcinomas Reveals Genomic Rearrangement Events as Significant Drivers of Disease

Stephen J Murphy et al. Cancer Res. .

Abstract

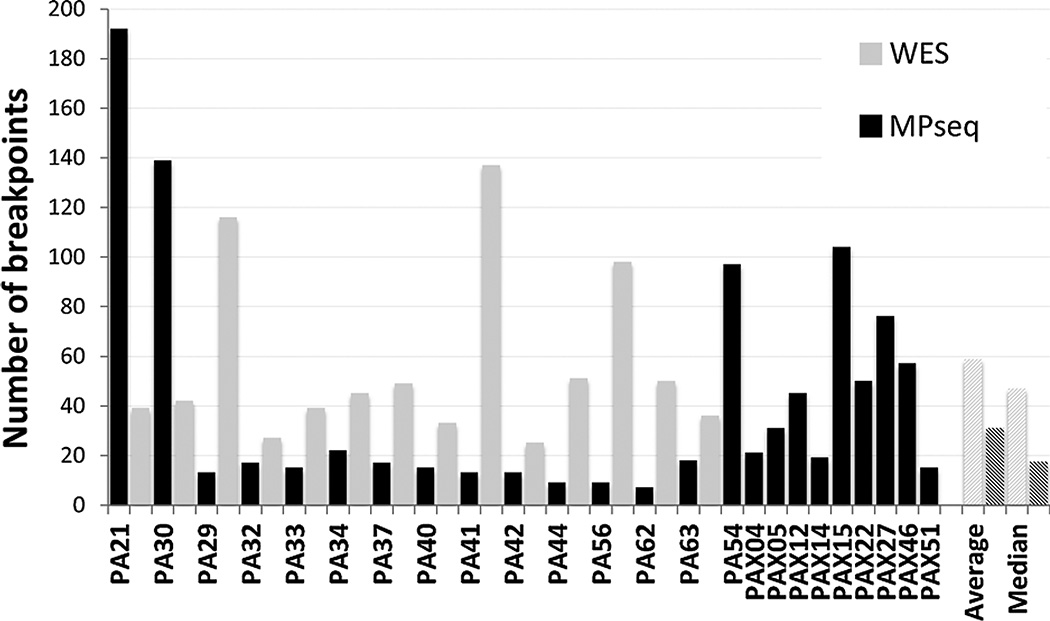
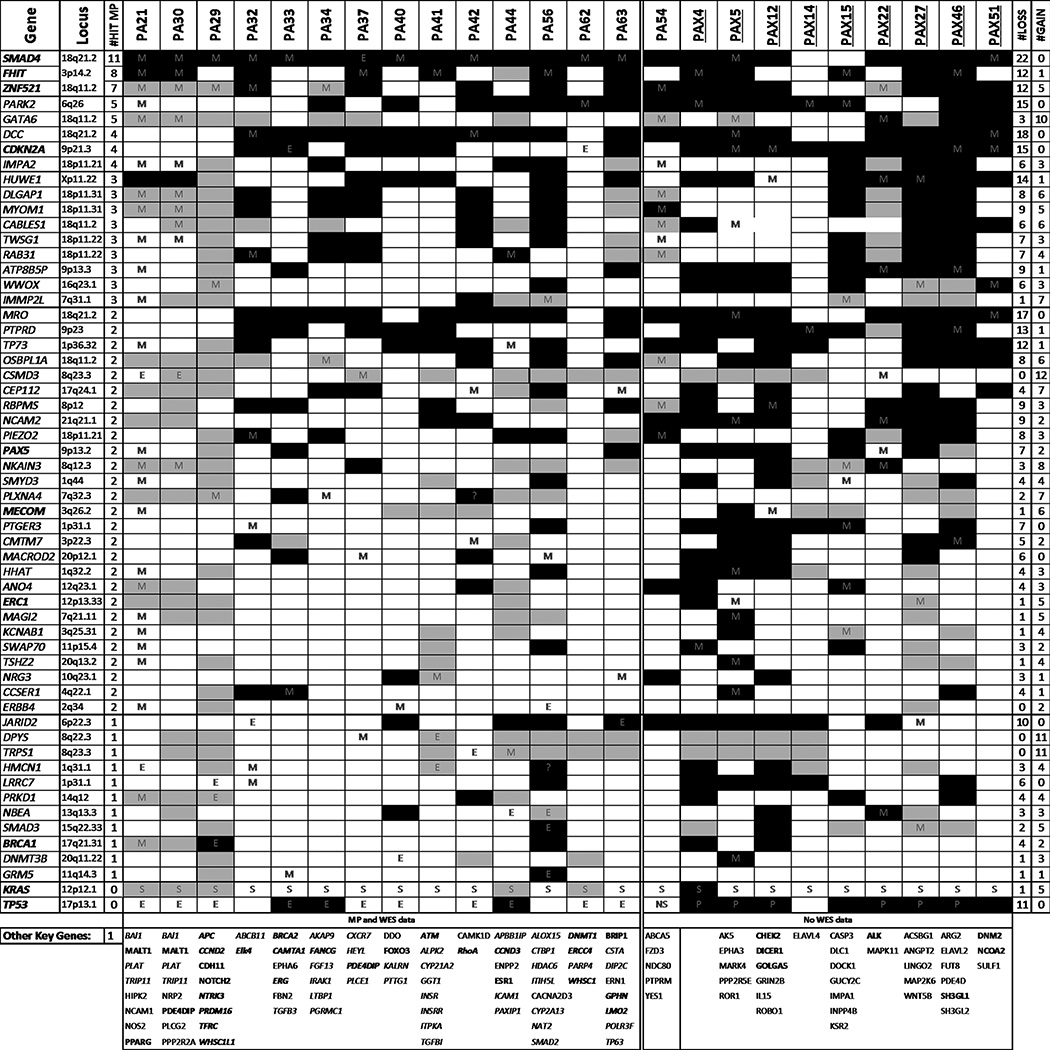
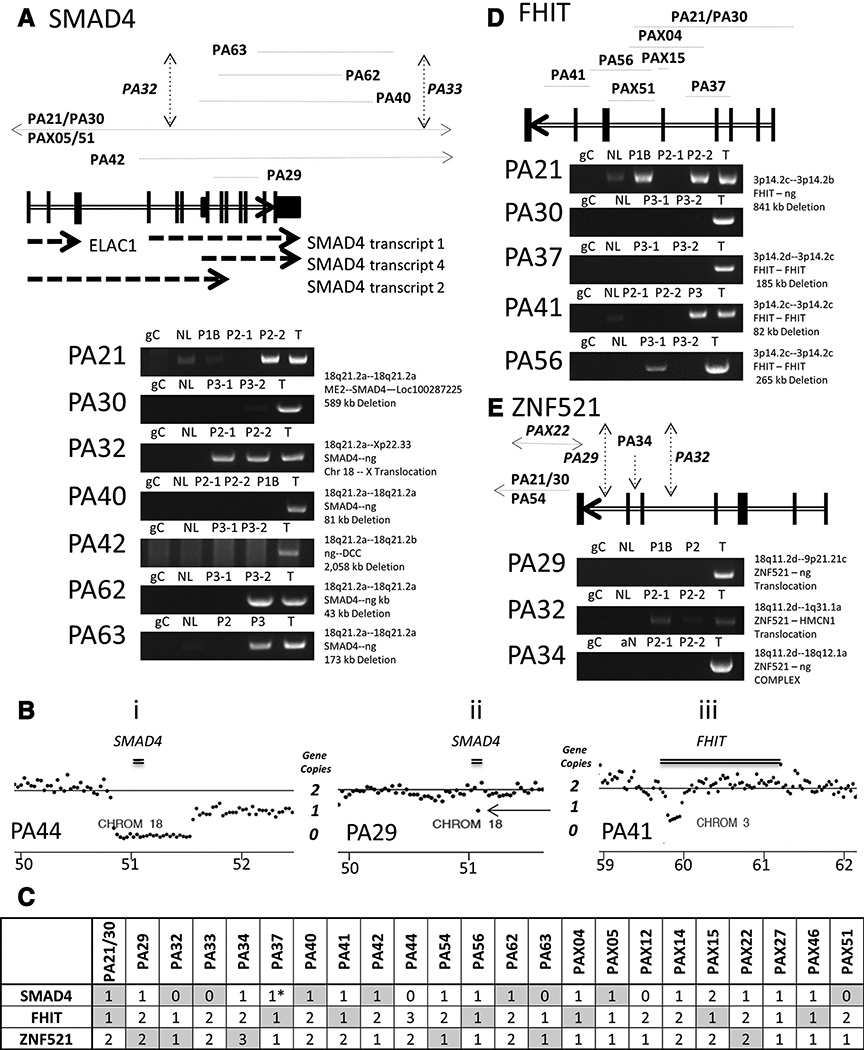
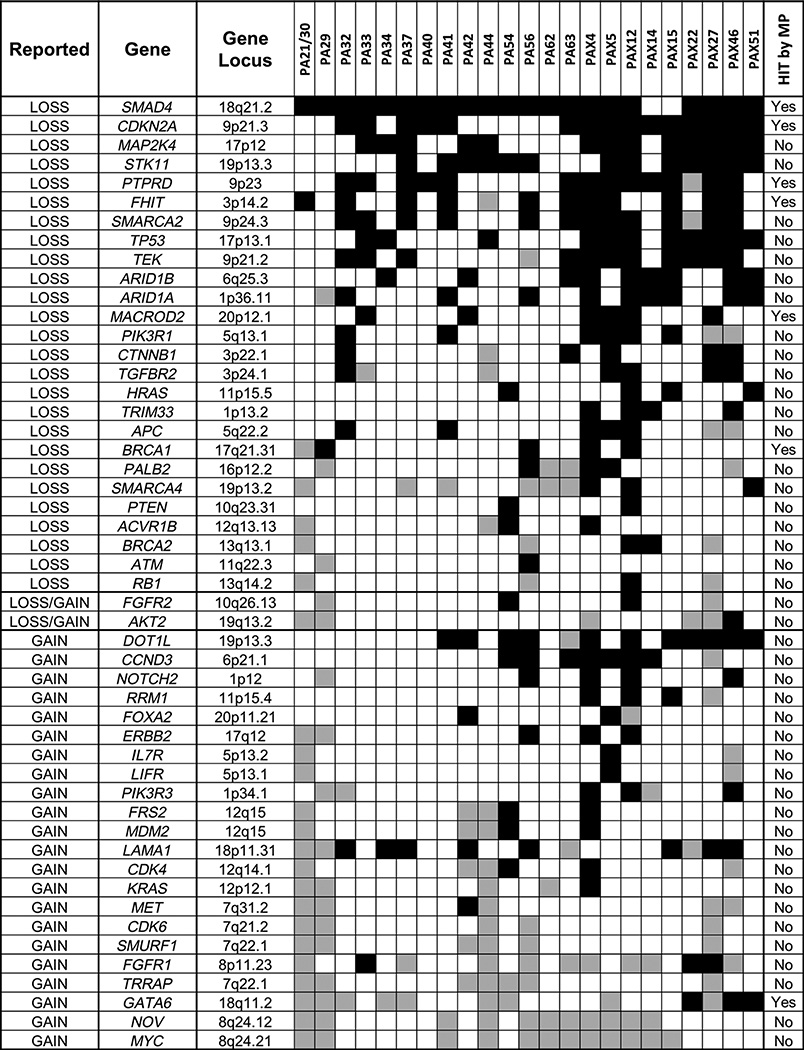
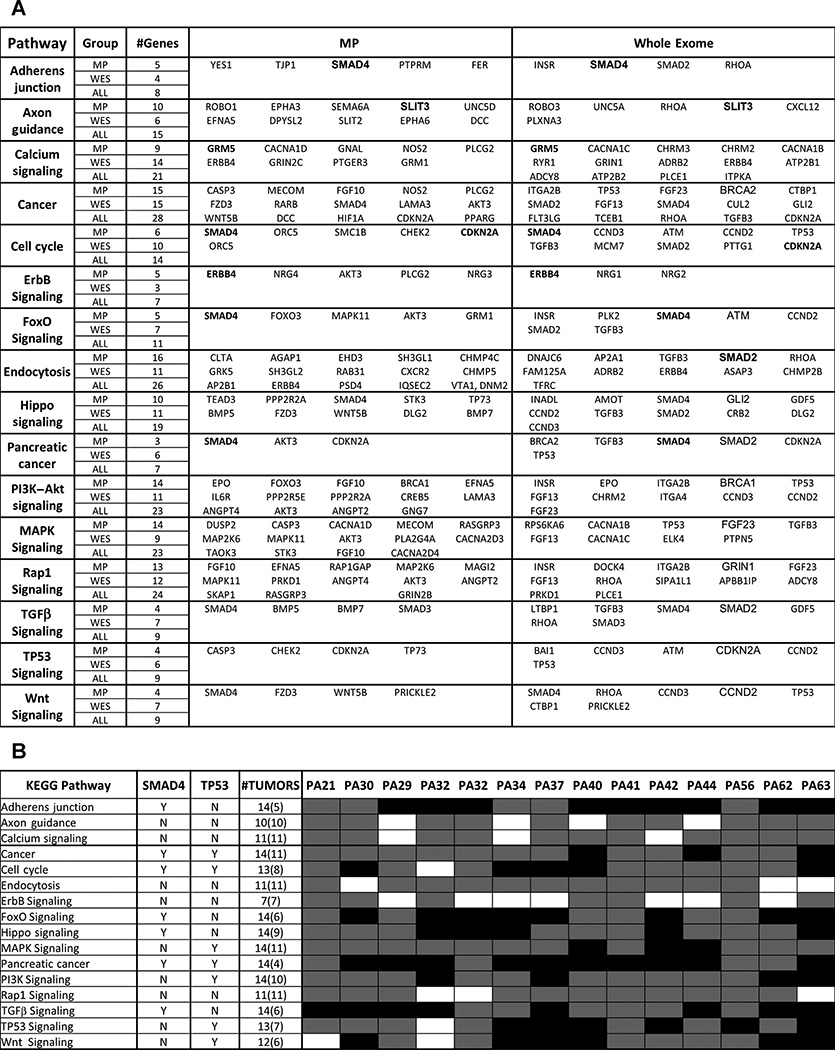
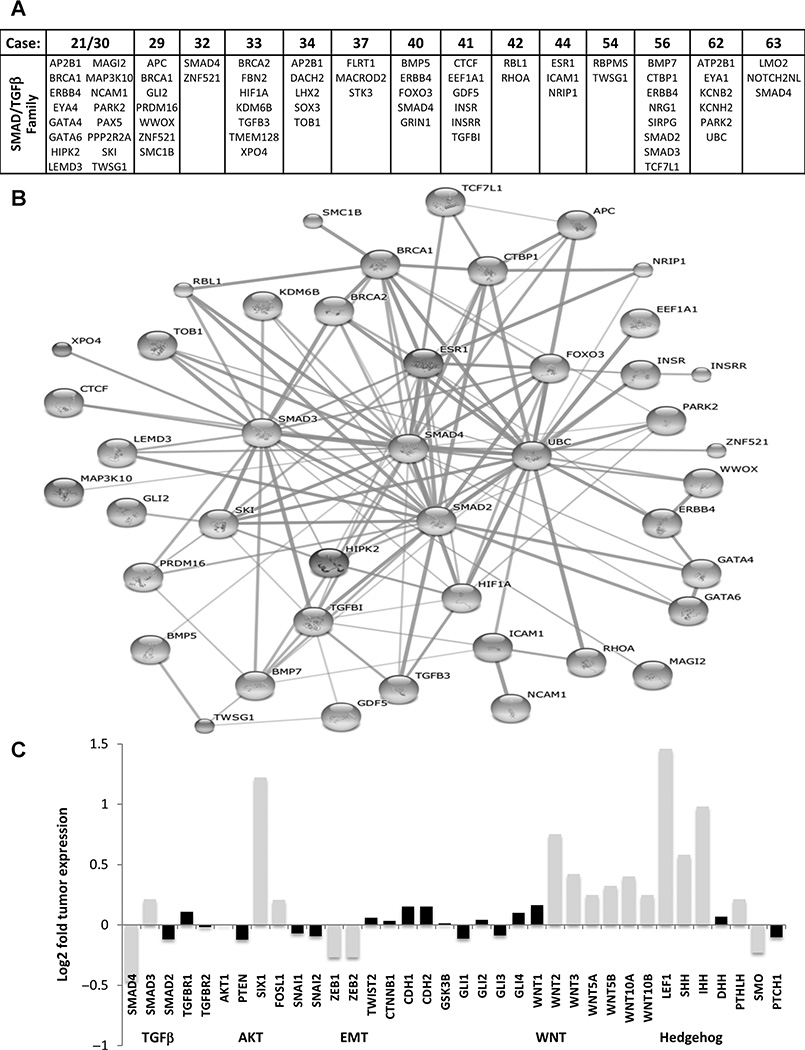
Many somatic mutations have been detected in pancreatic ductal adenocarcinoma (PDAC), leading to the identification of some key drivers of disease progression, but the involvement of large genomic rearrangements has often been overlooked. In this study, we performed mate pair sequencing (MPseq) on genomic DNA from 24 PDAC tumors, including 15 laser-captured microdissected PDAC and 9 patient-derived xenografts, to identify genome-wide rearrangements. Large genomic rearrangements with intragenic breakpoints altering key regulatory genes involved in PDAC progression were detected in all tumors. SMAD4, ZNF521, and FHIT were among the most frequently hit genes. Conversely, commonly reported genes with copy number gains, including MYC and GATA6, were frequently observed in the absence of direct intragenic breakpoints, suggesting a requirement for sustaining oncogenic function during PDAC progression. Integration of data from MPseq, exome sequencing, and transcriptome analysis of primary PDAC cases identified limited overlap in genes affected by both rearrangements and point mutations. However, significant overlap was observed in major PDAC-associated signaling pathways, with all PDAC exhibiting reduced SMAD4 expression, reduced SMAD-dependent TGFβ signaling, and increased WNT and Hedgehog signaling. The frequent loss of SMAD4 and FHIT due to genomic rearrangements strongly implicates these genes as key drivers of PDAC, thus highlighting the strengths of an integrated genomic and transcriptomic approach for identifying mechanisms underlying disease initiation and progression.


Conflict of interest statement

Disclosure of Potential Conflicts of Interest

No potential conflicts of interest were disclosed.

Figures

Figure 1
Figure 1
Mutations in PDAC tumors. Numbers of mutations detected by mate pair (MPseq; black bars) and WES (gray bars) per tumor. Average and median values across all cases represented by hatched bars.
Figure 2
Figure 2
Commonly mutated genes in PDAC. Genes selected according to presence in multiple cases or previously reported association with cancer. Mutation types detected by M, MPseq; E, WES; S, Sanger; or P, TP53 panel are indicated. Copy losses and gains at specific gene loci are marked by black or gray shading, respectively. The gene locus, the number of tumors hit directly by breakpoints (#Hit MP) and the number of cases involving loss (#LOSS) and gain (#GAIN) are listed for each commonly hit gene. Genes listed in COSMIC cancer gene censor are in bold text. Other key single hit genes in the study detected by MP or WES (italics) are presented at the bottom of the table for each case. Tumors evaluated by MP and WES data, or from MP alone, in the absence of WES data, are also indicated.
Figure 3
Figure 3
Deletions at the SMAD4/FHIT/ZNF521 loci. Schematics of predicted breakpoints and deletions, together with PCR validations at the SMAD4 18q21.2a (A), FHIT 3p14.2c (D), and ZNF521 18q11.2d gene loci (E). Exons (vertical black lines) are marked on each gene (double lined arrows), with breakpoints (vertical black dashed-arrows) or deletion spans (horizontal black dotted-lines) marked above. PCR validation gels presented with labeling of tumors (T), PanINs 1B, 2, or 3 (P1B, P2 or P3), adjacent normal (NL), and a mixed population human genomic DNA control (gC). B, examples of copy number loss for SMAD4 in PA44 (i) and PA29 (ii) and for FHIT in PA41 (iii). Central gray lines indicate 2-gene copy levels from normalized values across the whole genome. Lower black base line indicates the hg38 chromosomal coordinates (Mb). Black dots mark the frequency of coverage across 30 kb windows. The SMAD4 and FHIT genes positions are presented as horizontal double black lines. C, heterozygosity in each case for SMAD4, FHIT, and ZNF521 is summarized as 3, 2, 1, or 0 copies. The gray shaded boxes indicate cases where large genomic rearrangements were detected. *, case where SMAD4 gene mutated by SNV.
Figure 4
Figure 4
Copy number levels of commonly gained and lost genes in PDAC. Fifty genes reported from literature (–, –, –23) with recurrent gains or losses of copy numbers are presented detailing loss (black shading) or gain (gray shading) for each case in this study. The gene locus cytoband and whether the gene is additionally hit directly by a breakpoint in our data set also presented. Genes are ordered according to prevalence of gains or losses in cases.
Figure 5
Figure 5
RNA expression of SMAD4, FHIT, and ZNF521. RNA-Seq coverage levels are presented for SMAD4 (A), FHIT (B), and ZNF521 (C) on the whole gene level for each normal duct (Nd; black bars) and tumor (T; gray bars) sample per case. The y-axis represent reads per kilobase per million. The median (med) values are also presented for each gene (hatched bars). Cases predicted with loss or gain of copy number by DNA mutation analysis are exemplified by * or Δ, respectively.
Figure 6
Figure 6
Significant pathways in PDAC. A, sixteen pathways significantly affected in our data set. Columns indicate NGS group, number of genes mutated in each pathway in the mate pair (MPseq), whole exome (WES), or both (ALL) datasets. Specific genes in each pathway detected in MPseq or WES data are presented. B, distribution of affected cases for each pathway. The number of affected tumors and the involvement of TP53 and SMAD4 in a specific pathway are indicated. Gray shading indicates a case is affected through mutations in genes in addition to SMAD4 or TP53, while black shading indicates cases affected solely through SMAD4 or TP53.
Figure 7
Figure 7
SMAD4 pathway genes and signaling networks. A, somatically mutated genes with binding or pathway related functions with SMAD4/TGFβ signaling are presented per case. B, a network of the listed genes visualizing predicted protein–protein interactions (PPI) using the STRING database v9.1. C, median mRNA expression levels for specific genes represented as Log2 of median tumor levels divided by median dN levels. Black shaded bars indicate those genes where expression was gained or decreased less than fifty percent and thus deemed an insignificant change in expression.

References

    1. Siegel R, Naishadham D, Jemal A. Cancer statistics. CA Cancer J Clin. 2013;63:11–30. - PubMed
    1. Fitzgerald TL, Hickner ZJ, Schmitz M, Kort EJ. Changing incidence of pancreatic neoplasms: a 16-year review of statewide tumor registry. Pancreas. 2008;37:134–138. - PubMed
    1. Smeenk HG, Tran TC, Erdmann J, van Eijck CH, Jeekel J. Survival after surgical management of pancreatic adenocarcinoma: does curative and radical surgery truly exist? Langenbecks Arch Surg. 2005;390:94–103. - PubMed
    1. Eser S, Schnieke A, Schneider G, Saur D. Oncogenic KRAS signalling in pancreatic cancer. Br J Cancer. 2014;111:817–822. - PMC - PubMed
    1. Schneider G, Schmid RM. Genetic alterations in pancreatic carcinoma. Mol Cancer. 2013;2:15. - PMC - PubMed

Publication types