. 2016 Sep;84 Suppl 1(Suppl 1):51-66.
doi: 10.1002/prot.24973. Epub 2016 Jan 20.

Evaluation of free modeling targets in CASP11 and ROLL

Affiliations

Evaluation of free modeling targets in CASP11 and ROLL

Lisa N Kinch et al. Proteins. 2016 Sep.

Abstract

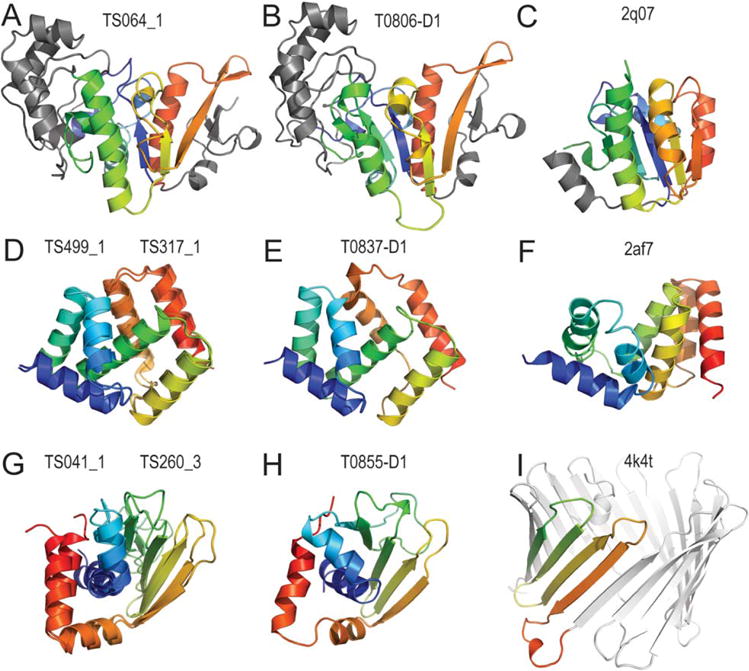
We present an assessment of 'template-free modeling' (FM) in CASP11and ROLL. Community-wide server performance suggested the use of automated scores similar to previous CASPs would provide a good system of evaluating performance, even in the absence of comprehensive manual assessment. The CASP11 FM category included several outstanding examples, including successful prediction by the Baker group of a 256-residue target (T0806-D1) that lacked sequence similarity to any existing template. The top server model prediction by Zhang's Quark, which was apparently selected and refined by several manual groups, encompassed the entire fold of target T0837-D1. Methods from the same two groups tended to dominate overall CASP11 FM and ROLL rankings. Comparison of top FM predictions with those from the previous CASP experiment revealed progress in the category, particularly reflected in high prediction accuracy for larger protein domains. FM prediction models for two cases were sufficient to provide functional insights that were otherwise not obtainable by traditional sequence analysis methods. Importantly, CASP11 abstracts revealed that alignment-based contact prediction methods brought about much of the CASP11 progress, producing both of the functionally relevant models as well as several of the other outstanding structure predictions. These methodological advances enabled de novo modeling of much larger domain structures than was previously possible and allowed prediction of functional sites. Proteins 2016; 84(Suppl 1):51-66. © 2015 Wiley Periodicals, Inc.

Keywords: CASP ROLL; CASP11; ab initio; alignment quality; domain structure; free modeling; protein fold prediction; protein structure; structure comparison.


Figures

Figure 1
Figure 1
Overall performance on FM targets. A three-dimensional graph depicting server model GDT_TS score distributions (first two coordinates) for each FM target domain plotted in the third coordinate. Targets are labeled, ordered by the average server GDT_TS, and colored in bluescale from more difficult (dark blue) to less difficult (light blue).
Figure 2
Figure 2
Random model scores. (a) A histogram of random model GDT_TS scores (red bars) skews to the left where outlier targets (blue bars) with noncompact folds have unusually high GDT_TS scores. (b) A scatter plot of random model GDT_TS scores for each FM target domain (y axis) and their corresponding target lengths (x axis) illustrates the dependence of random model scores on target length. Outlier sequences from panel A are in blue.
Figure 3
Figure 3
Top prediction model highlights. Bar graphs illustrate top manual models (blue bars) and server models (red bars) for all FM templates ordered according to difficulty from top (low average GDT_TS for best server models) to bottom (high average GDT_TS of best server models). (a) A random model ratio compares the best prediction model GDT_TS to the random model average GDT_TS, with the Y axis marking the equivalence ratio and an arbitrary dashed line marking 2.5-fold improvement. Group models outperforming the 2.5-fold ratio are labeled (group number_model number_doman). Domains are only indicated where groups split them. (b) A template ratio compares the top prediction model LGA_S to the top template LGA_S for all FM targets (labeled below). Group models with LGA_S scores that beat the top template LGA_S score by at least 1.1- fold are labeled.
Figure 4
Figure 4
Top prediction model examples. (a) Top random ratio manual model TS064_1 compared to (b) the target T0806-D1 structure shows the correct prediction of the entire fold. The model also outperforms (c) the top template of uncharacterized protein AF0587 [PDB ID:2q07], which retains the core three-layer Rossmann-like topology but lacks the 3-helix insertion as well as an additional C-terminal β-strand/α-helix. (d) Top server prediction TS499_1 superimposed with the top manual prediction TS317_1 compared to (e) the target T0837-D1 structure shows the correct prediction of the entire fold. The model also outperforms (f) the top template [PDB ID:2af7], which has roughly the same topology but with differences in interactions of the α-helices. (g) The top manual model TS317_1 for superimposed with the top server model TS041_1 capture the entire fold of h) the target T0855-D1 structure and improve over (i) the top unrelated template [2k4t], which retains only the β-meander of the target fold.
Figure 5
Figure 5
Prediction methodology insights: selection and refinement of server models. (a) Bar graphs in left and center panels map fraction of prediction models for each manual group that cluster with any server model above GDT_TS 70. (b) Bar graph in right panel illustrates average GDT_TS improvement of manual models with respect to the closest mapped server models.
Figure 6
Figure 6
First model performance. (a) The score distribution of target T0804-D2 highlights a cluster of outlier models (marked by *) that outperform the rest according to GDT_TS. (b) The target structure T0804-D2 adopts the same fold as (c) the top template [PDB ID:2j1k_f] with an LGA_S of 79. (d) The top server template TS499_5 (GDT_TS 38.65) roughly captures the topology, with a shift in alignment of the C-terminus and a failure to adopt the correct structure of 4 β-strands. (e) The top manual template TS333_1 (GDT_TS 38.82) slightly improves the top server model.
Figure 7
Figure 7
Models useful for function prediction. (a) Residue conservations depicted in rainbow from blue (variable) to red (conserved) are mapped to the four-helical TMH bundle of the T0836-D1 heme-binding protein of unknown function. Conserved residues highlight the potential active site (red spheres) of the target structure, which adopts the same core fold as (b) the top template [PDB ID: 2fyn] classified as a transmembrane heme-binding four helical bundle. The template bound heme (magenta stick) is coordinated by four His residues (black sphere). (c) The top prediction TS065_4 correctly places a conserved His residue (black spheres, numbered according to the CASP target) that probably contributes to heme binding of the target. (d) A potential active site (colored as above) is marked by conserved residues mapped to the T0824-D1 NucB DNase, which represents a deterioration of (e) the top template [PDB ID: 1g8t] classified as a His-Me finger endonuclease. Active site (black spheres, motif labeled) and nucleotide binding (magenta spheres) residues are highlighted. (f) The top prediction TS064_2 roughly places conserved active site (motif labeled) and nucleotide binding residues in the correct sites.
Figure 8
Figure 8
CASP ROLL outperformance. (a) The CASP ROLL Target R0034-D1 adopts an up and down α-helical bundle containing five α-helices. (b) The top-performing prediction model (TS045_1) includes all five α-helices in the correct topology, with correct alignment over most to the structure (residues 40–110) and the last α-helix being broken. (c) The closest template [PDB ID: 2lpj] includes all 5 α-helices in the same topology. (d) The CASP ROLL Target R0021 adopts an eight-stranded β-meander barrel. (e) The top-performing model (TS330_4) correctly predicts the β-barrel, but places a peripheral α-helix on the wrong side of the barrel. (f) The closest template [PDB ID: 1ike] classified as lipocalin adopts a somewhat elongated β-barrel compared to the template.
Figure 9
Figure 9
Progress. (a) Distributions of SAM-T08 GDT_TS scores on FM targets from CASP10 (gray bars) and CASP11 (black bars) suggest similar target difficulties. (b) Distributions of normalized performance ratios (best model GDT_TS/SAM-T08 GDT_TS) for CASP11 (blackbars) skew toward higher performance than those for CASP10 (gray bars).

Similar articles

Cited by

References

    1. Berman HM, Westbrook J, Feng Z, Gilliland G, Bhat TN, Weissig H, Shindyalov IN, Bourne PE. The Protein Data Bank. Nucleic Acids Res. 2000;28:235–242. - PMC - PubMed
    1. Lee J, Lee J, Sasaki TN, Sasai M, Seok C, Lee J. De novo protein structure prediction by dynamic fragment assembly and conformational space annealing. Proteins. 2011;79:2403–2417. - PubMed
    1. Rohl CA, Strauss CE, Misura KM, Baker D. Protein structure prediction using Rosetta. Methods Enzymol. 2004;383:66–93. - PubMed
    1. Simons KT, Kooperberg C, Huang E, Baker D. Assembly of protein tertiary structures from fragments with similar local sequences using simulated annealing and Bayesian scoring functions. J Mol Biol. 1997;268:209–225. - PubMed
    1. Xu D, Zhang Y. Ab initio protein structure assembly using continuous structure fragments and optimized knowledge-based force field. Proteins. 2012;80:1715–1735. - PMC - PubMed

Publication types