IL-17 intensifies IFN-γ-induced NOS2 upregulation in RAW 264.7 cells by further activating STAT1 and NF-κB
- PMID: 26677135
- PMCID: PMC4716793
- DOI: 10.3892/ijmm.2015.2433
IL-17 intensifies IFN-γ-induced NOS2 upregulation in RAW 264.7 cells by further activating STAT1 and NF-κB
Abstract
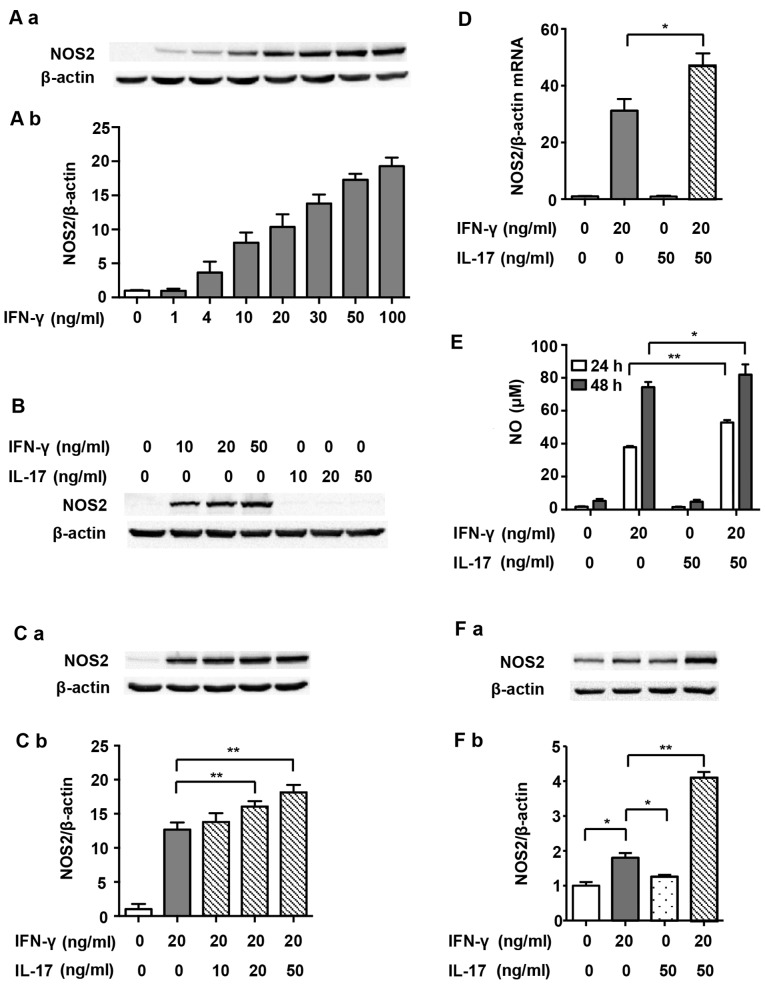
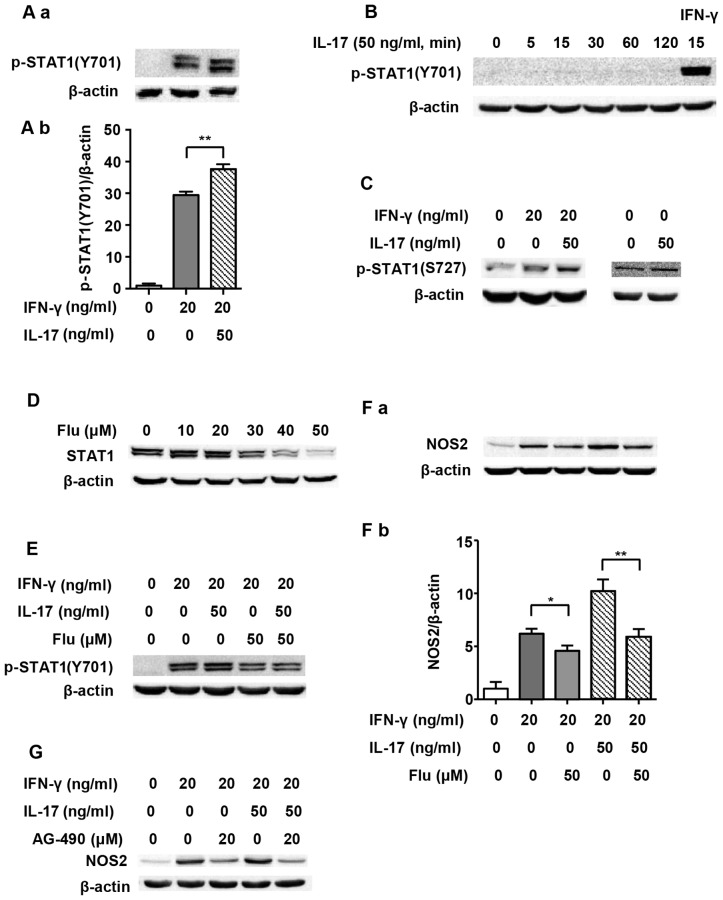
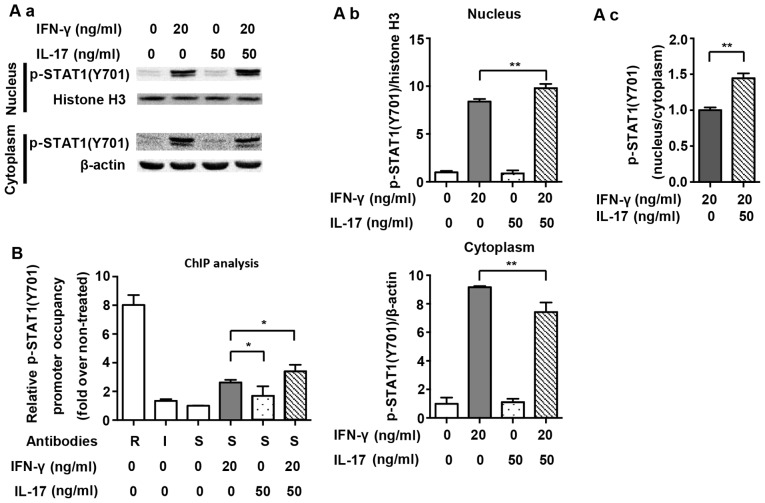
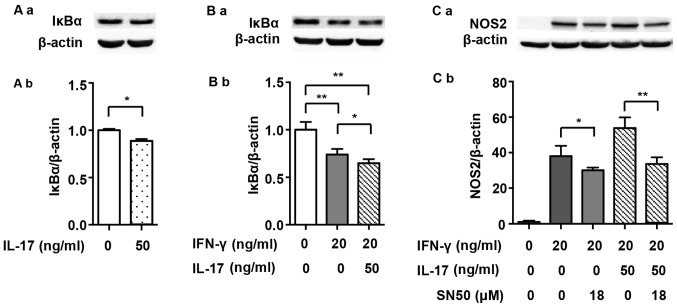
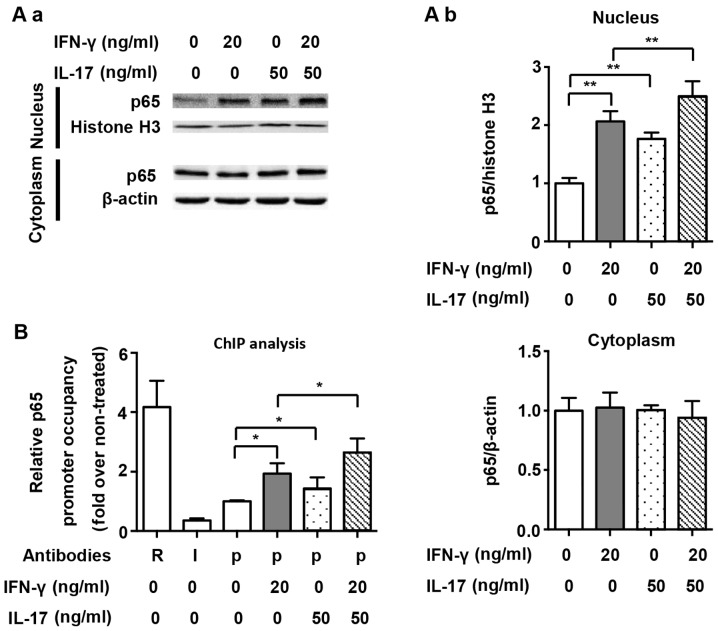
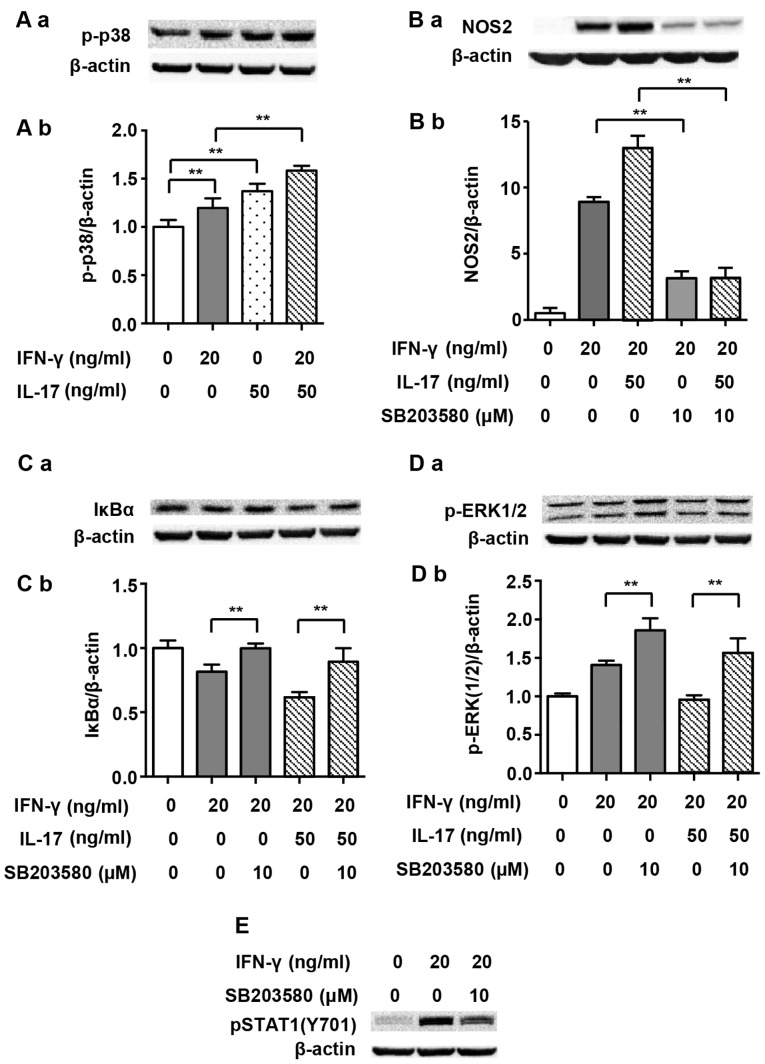
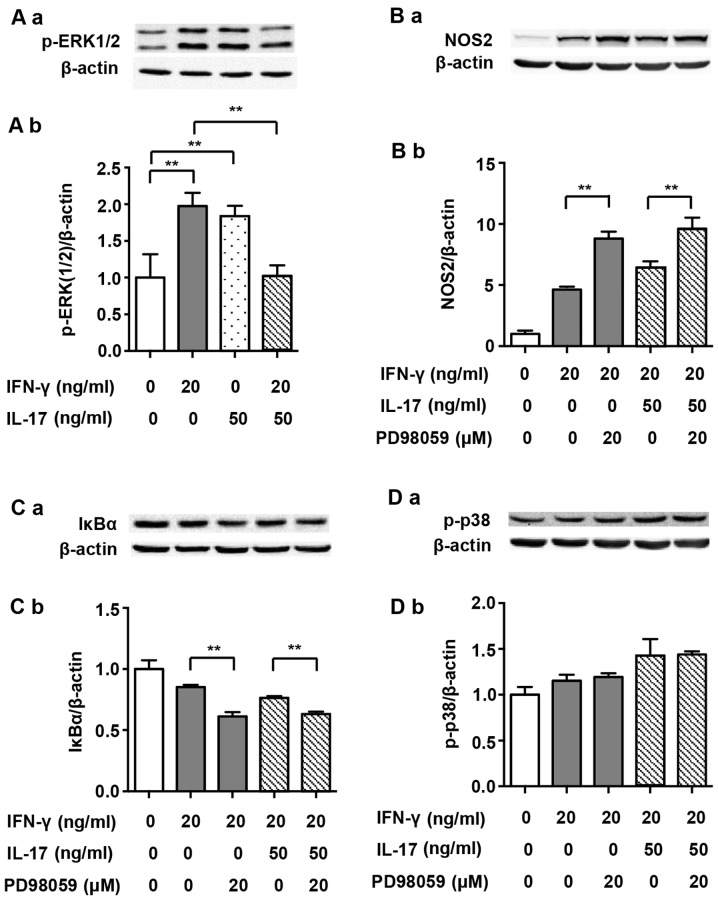
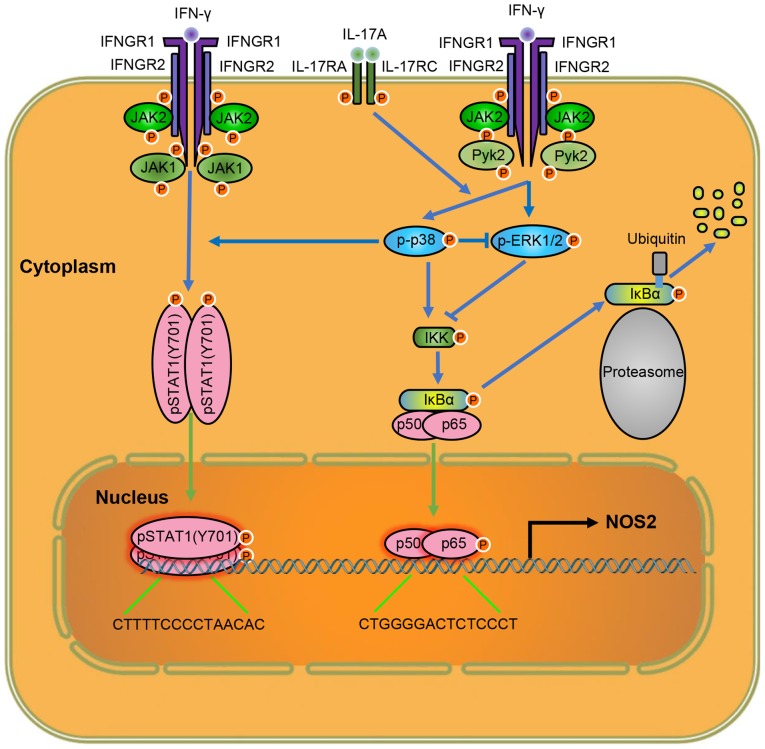
Interleukin-17 (IL-17) is a signature cytokine of Th17 cells. Previous research has indicated that IL-17 plays a proinflammatory role by exacerbating interferon-γ (IFN-γ)-induced inflammation. However, prior to this study, it was not known whether inducible nitric oxide synthase (iNOS or NOS2), a signature molecule of inflammation, could be intensified by IL-17 when combined with IFN-γ. Thus, we explored the roles and underlying mechanisms of IL-17 and IFN-γ in the regulation of NOS2 expression in RAW 264.7 cells using qPCR, western blot analysis, colorimetric analysis, ChIP assay and statistical analysis. Although IL-17 alone did not induce NOS2 expression or nitric oxide (NO) production, as shown by western blot analysis and colorimetric analysis, it intensified IFN-γ-induced NOS2 upregulation and NO production in RAW 264.7 cells. The alteration of relevant transcription factors demonstrated that a combination of IFN-γ and IL-17 enhanced Tyr701-phosphorylated signal transducer and activator of transcription 1 [p-STAT1(Y701)] and nuclear factor-κB (NF-κB) activation, nuclear translocations and their binding to the NOS2 promoter, compared with IFN-γ alone, as illustrated by the results of the western blot analysis and ChIP assay. Also, using the corresponding inhibitors of STAT1 and NF-κB, we noted downregulation of the expression of NOS2 induced by IFN-γ alone or in combination with IL-17, respectively. In addition, IFN-γ increased phosphorylated (p-)p38 mitogen-activated protein kinase (MAPK), and accelerated the activation of the NF-κB pathway and the expression of NOS2, but phosphorylated extracellular signal-regulated kinase 1/2 (p-ERK1/2) was reduced by treatment with IFN-γ and IL-17. IL-17 intensified the activation of the NF-κB pathway and NOS2 upregulation induced by IFN-γ by increasing the phosphorylation of p38 MAPK and limiting the phosphorylation of ERK1/2. Taken together, these results suggest that IL-17 intensified IFN-γ-induced NOS2 upregulation and NO production by increasing the transcription activity of p-STAT1(Y701) and NF-κB in RAW 264.7 cells. Further activation of the NF-κB pathway induced by IL-17 relied on enhanced phosphorylation of p38 MAPK and decreased phosphorylation of ERK1/2. The mechanism suggested in this study provides novel information which may be used for anti-inflammatory therapy with IL-17.
Figures
Similar articles
-
Requirement for endogenous heat shock factor 1 in inducible nitric oxide synthase induction in murine microglia.J Neuroinflammation. 2015 Oct 14;12:189. doi: 10.1186/s12974-015-0406-5. J Neuroinflammation. 2015. PMID: 26467650 Free PMC article.
-
Plumbagin inhibits LPS-induced inflammation through the inactivation of the nuclear factor-kappa B and mitogen activated protein kinase signaling pathways in RAW 264.7 cells.Food Chem Toxicol. 2014 Feb;64:177-83. doi: 10.1016/j.fct.2013.11.027. Epub 2013 Dec 1. Food Chem Toxicol. 2014. PMID: 24296134
-
16-kDa prolactin down-regulates inducible nitric oxide synthase expression through inhibition of the signal transducer and activator of transcription 1/IFN regulatory factor-1 pathway.Cancer Res. 2005 Sep 1;65(17):7984-92. doi: 10.1158/0008-5472.CAN-05-0631. Cancer Res. 2005. PMID: 16140971
-
A paradigm for gene regulation: inflammation, NF-kappaB and PPAR.Adv Exp Med Biol. 2003;544:181-96. doi: 10.1007/978-1-4419-9072-3_22. Adv Exp Med Biol. 2003. PMID: 14713228 Review.
-
Regulation of the expression of the inflammatory nitric oxide synthase (NOS2) by cyclic AMP.FASEB J. 1999 Dec;13(15):2125-37. doi: 10.1096/fasebj.13.15.2125. FASEB J. 1999. PMID: 10593859 Review.
Cited by
-
Physiological Effect of Ghrelin on Body Systems.Int J Endocrinol. 2020 May 25;2020:1385138. doi: 10.1155/2020/1385138. eCollection 2020. Int J Endocrinol. 2020. PMID: 32565790 Free PMC article. Review.
-
A Cytokine Signalling Network for the Regulation of Inducible Nitric Oxide Synthase Expression in Rheumatoid Arthritis.PLoS One. 2016 Sep 14;11(9):e0161306. doi: 10.1371/journal.pone.0161306. eCollection 2016. PLoS One. 2016. PMID: 27626941 Free PMC article.
-
3D model of harlequin ichthyosis reveals inflammatory therapeutic targets.J Clin Invest. 2020 Sep 1;130(9):4798-4810. doi: 10.1172/JCI132987. J Clin Invest. 2020. PMID: 32544098 Free PMC article.
-
Targeting the poliovirus receptor to activate T cells and induce myeloid-derived suppressor cells to differentiate to pro-inflammatory macrophages via the IFN-γ-p-STAT1-IRF8 axis in cancer therapy.Cell Death Differ. 2025 Apr 14. doi: 10.1038/s41418-025-01496-6. Online ahead of print. Cell Death Differ. 2025. PMID: 40229462
-
A Vaccine Based on Kunitz-Type Molecule Confers Protection Against Fasciola hepatica Challenge by Inducing IFN-γ and Antibody Immune Responses Through IL-17A Production.Front Immunol. 2020 Oct 20;11:2087. doi: 10.3389/fimmu.2020.02087. eCollection 2020. Front Immunol. 2020. PMID: 33193292 Free PMC article.
References
-
- Green SJ, Mellouk S, Hoffman SL, Meltzer MS, Nacy CA. Cellular mechanisms of nonspecific immunity to intracellular infection: cytokine-induced synthesis of toxic nitrogen oxides from L-arginine by macrophages and hepatocytes. Immunol Lett. 1990;25:15–19. doi: 10.1016/0165-2478(90)90083-3. - DOI - PubMed
-
- Li LM, Kilbourn RG, Adams J, Fidler IJ. Role of nitric oxide in lysis of tumor cells by cytokine-activated endothelial cells. Cancer Res. 1991;51:2531–2535. - PubMed
-
- Langrehr JM, Hoffman RA, Billiar TR, Lee KK, Schraut WH, Simmons RL. Nitric oxide synthesis in the in vivo allograft response: a possible regulatory mechanism. Surgery. 1991;110:335–342. - PubMed
Publication types
MeSH terms
Substances
LinkOut - more resources
Full Text Sources
Other Literature Sources
Research Materials
Miscellaneous